|
|
Home | Switchboard | Unix Administration | Red Hat | TCP/IP Networks | Neoliberalism | Toxic Managers |
| (slightly skeptical) Educational society promoting "Back to basics" movement against IT overcomplexity and bastardization of classic Unix | |||||||
|
|
Note: HP renamed the product called now HP operations manager way too many times. Also it is very inconsistent with using abbreviations. Here we will assume that the term "HP Operations manager" and abbreviations HPOM, OMU, and OVO mean the same thing :-)
|
|
HPOM can monitor thresholds on the management server. The command opcmon is more specialized and less flexible then opcmsg . Like opcmsg, the command opcmon can be executed only on the node which has the HPOM agent installed. Both are extremely badly documented in HP documentation and the most valuable information is scattered in various HP HPOM-related forums. Here we present a modest attempt to integrate some of this valuable information from HP HPOM forums in a single page.
Syntax:
opcmon [ -help ] <measurement threshold policy> =<script_return_value>
	 [ -object <msg_object> ]
	 [ -option <variable> =<var_value> ]*
Parameters:
msg_object -- should probably more correctly be called threshold selector. This is a field that serves as selector for the application of particular threshold. And yes that means that HPOM is capable of using multiple threshold, each depending on particular value of the object field. This is probably the most interesting and innovative feature of measurement threshold policy: the value of the object can be used as a selector of threshold. In other words threshold applied can vary depending on the value of the parameter -object <msg_object> of the opcmon invocation
For example, if you monitor free space of the filesystem you can have different thresholds for /tmp, then for /var. In this case in Thresholds tab of the policy you need to specify "Use Instance filters" selection as "yes"
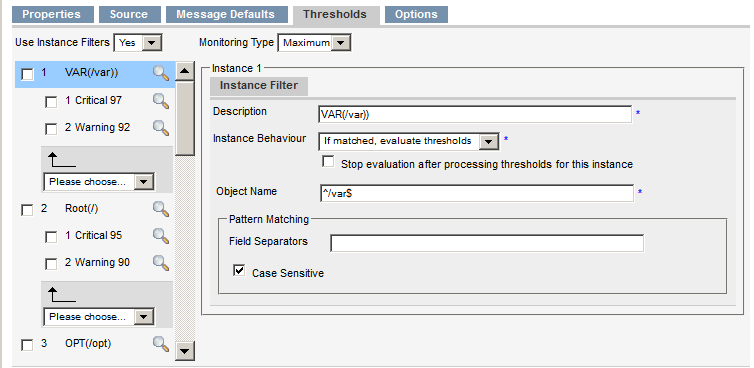
In other words the option -object is used to submit the value to the monitor agent. This value can be matched against various patterns in the policy. See Patterns in HP HPOM
In additions you need to provide monitoring interval, which in case the policy will be applied to multiple boxes would be enough to pulling them all so the measurement does not overlap. For this reason specifying interval less then one minute in HPOM is not recommended.
Summarizing we can state:
In HPOM you can offload part of the processing by a typical script that. Let's say that script that evaluate if the filesystem free space is sufficient. Using HPOM comparison with the threshold can be programmed in HPOM policy instead as a part of the script which makes changes of this threshold simpler and the whole monitoring scheme more transparent. Not by much but still...
For example for Linux you can use something like (shell in not the best language for such processing, Perl would be much better):
$OPCMON='/opt/OV/bin/OpC/opcmon'
df -kl | grep "%" | cut -c 57- | grep -v "Mounted on" | while read fs; do
        used_space=`df $fs | cut -c 53-54 | tail -1`
        ((used_space=used_space+0)) # trick to get rid of blanks
        $OPCMON fsmon=$used_space -object fs=$fs
        if [ $? -ne 0 ] ; then
          logger -p local3.error "Problem submitting $OPCMON command. RC=$?"
          exit 1
        fi
done
We assumed that the name of the policy is fsmon. Now let's assume that you also need for some reason mount of free space not only used space to form HPOM message about the event. Here the capability to specify options becomes handy:
$OPCMON='/opt/OV/bin/OpC/opcmon'
df -kl | grep "%" | cut -c 57- | grep -v "Mounted on" | while read fs; do
        used_space=`df $fs | cut -c 53-54 | tail -1`
        ((used_space=used_space+0)) # trick to get rid of blanks
        ((free_space=100-used_space))
        $OPCMON fsmon=$used_space -object fs=$fs -option free_space=$free_space
        if [ $? -ne 0 ] ; then
          logger -p local3.error "Problem submitting $OPCMON command. RC=$?"
          exit 1
        fi
done
Again the key idea behing opcmon is that a special type of policy designed specifically for this type of monitoring (Measurement Threshold Policy) will check received value against the configured threshold. Depending on policy, the event can be locally logged, suppressed, or forwarded. In the latter case the Message Agent forwards the message to the HPOM Management Server where the message can be reviewed by the operator(s).
|
|
Switchboard | ||||
| Latest | |||||
| Past week | |||||
| Past month | |||||
October 21, 2010 | HP OpenView
To use the script, create a measurement threshold policy and write program name as : "script_name" "monitor_name" "process_name"
and put threshold 1 for not running condition and threshold 0 for running condition.
MON_NAME=$1
PROCESS=$2CMD_OUTPUT=`/usr/bin/ps -ef | grep $PROCESS | grep -v grep | wc -l`
if [ ${CMD_OUTPUT} -eq 0 ]
then
rc=1;
else
rc=0;
fi
/opt/OV/bin/OpC/opcmon $MON_NAME=$rcexit
IT Resource Center forums
Can you please help me how to create monitor to alert if process is down in ovo unix
Hi Jessica,
u can use ::
--------------------------------------------
process=$1 ## The name of the process to be monitored which is welldb
MonitorName=$2ProcNumber=`ps -ef | grep "${process}" | grep -v grep`
/opt/OV/bin/OpC/opcmon ${MonitorName}=${ProcNumber}
exit $?
--------------------------------------------
create a monitor template and in the script part put ::abovescriptname.sh <process name> <monitor name >
+++++++++++++++++++++++++++++++++++++++++++++
you could also use osspi_procmon.sh and procmon_local.cfgtake a look at this ::
http://forums12.itrc.hp.com/service/forums/questionanswer.do?threadId=745240
Which path/directory shall I keep the script and what should be the file permissions for the script....
Hi Jessica,
Under /var/opt/OV/share/databases/OpC/mgd_node/customer/<vendor>/<archi>
there are new directories for the HTTPS agent.
For Solaris agent you have on a OVO 8.1 server :
/var/opt/OV/share/databases/OpC/mgd_node/customer/sun/sparc/solaris7 for the HTTPS agentYou need to place your own scripts in the directory tree for the HTTPS agent, and they will be distributed.
For hp-ux11 the subdirectory for HTTPS agent is hp-ux1100 under /var/opt/OV/share/databases/OpC/mgd_node/customer/hp/pa-risc
The directory structure is documented in the OVO 8.1 installation guide, chapter 5 Directory structure on the management server.
Apr 9, 2009 | IT Resource Center forums
Banu_Prakash:
how do i pass the -object and -option in opcmon command and how will i use these attributes in opcmon message conidtion. For example if i'm passing
opcmon test=0 -object /tmp -option device=sun001Here in montior template condition I need to hard code the "set attribute" Node value as sun001 and object value as /tmp.
How do i make use of this.?
Note: If you are the author of this question and wish to assign points to any of the answers, please login first.For more information on assigning points ,click here
jason_lee:
In the set attributes:
Put $OPTION(device) in where you want to display the device=sun001
Put $MSG_OBJECT in where you want to display "/tmp"
Mar 30, 2004 | IT Resource Center forums
I have a Perl script that checks several applications and returns a 1 or 0. I am running this script as 'Source type' Program in a measurement threshold policy. I want to generate a console message based on whether the MT policy receives a 1 or 0 from the Perl script. The problem that I am having is that the policy does not seem to see a return code either way.
In it's simplest form, for testing, the Perl script is;
$error = 1; DoMsg();
sub DoMsg { return $error; }
I want to be able to capture this in the MT policy with Threshold limit (Maximum) Source >= 1, but the policy does not see the return code. This same script seem to run fine on our Unix ITO v6 console.
any ideas?
Note: If you are the author of this question and wish to assign points to any of the answers, please login first.For more information on assigning points ,click here
drew dimmick:
It's the perl interpreter on your node... if it worked one place, and not the other, the agent isn't picking up the return... most likely because the perl.exe doesn't return the error code.
Also, in OVOW, you don't have to use the external sources anymore... you can use "embedded" scripts... this removes any strangeness in regards to external programs like this.
Here's one that does bottleneck detection in perl...
$util_threshold = 5;
$util = $Policy->Source("cpu_util"); $queue = $Policy->Source("cpu_queue"); $cpus = $Policy->Source("num_cpu");
$util_value = $util->Value; $queue_value = $queue->Value; $cpus_value = $cpus->Value;
$Session->Value("util", $util_value); $Session->Value("queue", $queue_value);
if ($util_value >= $util_threshold) { if ($queue_value > $cpus_value) {
$Rule->Status(TRUE); } }
This assumes that you have set up source objects in the source tab for cpu_util, cpu_queue & num_cpu
Drew
Nicholas Faber:
Ed,
I am not sure I see how you script is returning anything external. Try using an "exit" instead, ie:
$error = 1; &DoMsg;
sub DoMsg {
if ($error==1) {exit 1; } elsif ($error==0) { exit 0; }
}
Edward Pena:
Using exit works for the return code. I thought that 'return' did this. Thanks for that tip.
I still have the problem where OVOW does not see the return code. The reason that I need this functionality is that I have application teams writing thier own monitoring script that I will run and just look for a return code. I'm not sure how to get OVOW to see that return code. In the Measurement Threshold policy, I am running as Program, perl.exe e:\scripts\myscript.pl
Nicholas Faber:
Ed,
The "return" command in a perl script simply returns something from the subroutine to the script for use after the subroutine is called. It generates nothing external.
I work on HPOM /U, but in your case I would use it in an monitor template (policy on HPOM /W). Write a monitor condition with a threshold that triggers on the return value from the perl script.
Nicholas Faber:
If you use a monitor, your script would look like:
$error = 1; `opcmon return_value = $error`;
The ` is a backtick (lower case on the ~ key), which means execute the following from the shell.
Jared Cheney:
If you want to use a Perl script that you have written to return a value to your OVOW Measurement Threshold policy - you have to include the following within your Perl script:
opcmon PolicyName -SourceName=Value
The command opcmon forwards the current value of the monitored object to the monitoring agent of the OV Agent running on the local managed node. When it receives the call from opcmon, it sees which policy it is meant for and then evaulates the value against your rules, etc.
So if I created a Measurement Threshold policy and called it "testPolicy" and created a source of type 'Program' and gave it a short name of "mySource" and the program I'm calling is
c:\temp\blah.pl - within blah.pl I'd put:
#-----------------------------
## perform calc and put into $returnvalue my $returnValue = 10;
## pass return value back to policy `opcmon testPolicy-mySource=$returnValue`;
#------------------------------
You can also do some stuff when you call opcmon like passing in object names. i.e.
`opcmon testPolicy -mySource=$returnValue -option myVar="C Drive"`;
Then you can reference myVar as <$OPTION(myVar)> within your msgText when sending a message to the console, performing an autoAction, etc. See "opcmon" in the online help for more detail - and post back here if you have questions.
BTW, it doesn't matter what you return or print out, etc. from your program. The only way that the OV Agent will see it is if you call opcmon - you must call opcmon from your script if you use a source of type Program or External.
HTH
IT Resource Center forums
Hi guys!
I have a RP7410 server with HPUX 11i and OV 7.1.
Well,
I'm receiving a lot of error messages in my Message Browser.
Looking at the /var/opt/OV/log/OpC/opcerror in my managed node, I found it filled with this message:11/04/04 11:05:20 WARNING opcmona (Monitor Agent)(27491) [genmona.c:2690]: Unknown monitor 'DBSPI-MeasureWare_core'. Ignoring received value. (OpC30-613)
Can't find object 'DBSPI-MeasureWare_core' to set async. flag. (OpC20-37)
There are a lot of ocurrences of this message in opcerror.I'm receiving a similiar message from one of my monitored nodes too. The diference is that a lot of monitors are sending error messages from this node.
I put it on the atached file.
I'm counting with your help guys!
Thanks a lot!
Rafael M. Braga
Rafael,
the message indicates that some monitor script/program is calling the opcmon api with a call like : opcmon DBSPI-MeasureWare_core=<value>
But there is no monitor template named DBSPI-MeasureWare_core assigned to the node.
Did you modify the default DBSPI templates ?
There is a monitor template named DBSPI-MeasureWare in the DBSPI-Core template group of the default DBSPI templates, check if this template (or a containing template group) is assigned on the node, and check the template definition, the default template is : Template name : DBSPI-MeasureWare Program : dbspimwc DBSPI-MeasureWare
The parameter of the dbspimwc is the template name.
If you have modified the default templates, check that the parameter of the dbspimwc command is the template name.
Charles Guiocheau:
Rafael,
The messages "Can't retrieve value for monitor '<monitor name>'" you see in the opcerror file, are from a monitor <monitor name> calling a script/program that did not return a value associated with the monitor name, the program/script called by the monitor did not use the opcmon call : opcmon <monitor name>=value
This may be because you rename or copy template, change the template name, but did not change the "program" field, where most of the monitor scripts use the template name for parameter.
Can you send the output of the following command on the managed node :
/opt/OV/bin/OpC/utils/opcdcode /var/opt/OV/conf/OpC/monitor
This command will show the current template definitions on the node, and we will see if there are inconsistencies between the template names and "program" calls.
Charles Guiocheau:
Rafael,
The templates seems to be ok regarding their names and the parameters supplied to the script/program.
You can check if the monitors program/scripts had been distributed to the node (i think the error message will be different), in particular check that you have the file /var/opt/OV/bin/OpC/monitor/vp_chk.sh on the node, seems that all monitors calling this script are failing to return a value.
You can also manually call the monitor scripts on the node and see if they call the correct opcmon API, on the node execute : sh -x /var/opt/OV/bin/OpC/monitor/vp_chk.sh syslogd Syslogd_Scania
You should see at the end : Process=syslogd MonitorName=Syslogd_Scania PsOpt=-e + ps -e + grep syslogd + grep -v vp_chk.sh + grep -v grep + wc -l tmpNumProcs= 1 + echo 1 NumProcs=1 + /opt/OV/bin/OpC/opcmon Syslogd_Scania=1 + exit 0
It seems also that you are monitoring the same processes with different monitors, like the syslogd process with the monitors Syslogd_Karina and Syslogd_Scania. It's not the cause of your problem, but it doesn't seems to be necessary.
Rafael Mendonça Braga
Hello Charles!! Thanks For your help my friend!
I executed the script manualy, and this is the output:
karina> sh -x /var/opt/OV/bin/OpC/monitor/vp_chk.sh syslogd Syslogd_Scania + + basename /var/opt/OV/bin/OpC/monitor/vp_chk.sh PROGNAME=vp_chk.sh + BIN_DIR=/usr/bin + OS_DIR=/usr + OPT_DIR=/opt + VAR_DIR=/var/opt + ETC_DIR=/etc/opt + LANG_C=C + LANG_SJIS=ja_JP.SJIS + LANG_EUC=ja_JP.eucJP + ROOT_DIR= + INST_OPCVERS=A.07.10 + TMP_DIR=/tmp/opc_tmp + OV_OPT_DIR=/opt/OV + OPC_OPT_DIR=/opt/OV + OV_VAR_DIR=/var/opt/OV + OV_VAR_SH_DIR=/var/opt/OV/share + OPC_VAR_DIR=/var/opt/OV + OV_ETC_DIR=/etc/opt/OV + OV_ETC_SH_DIR=/etc/opt/OV/share + OPC_ETC_DIR=/etc/opt/OV/share + OV_NEWCFG_DIR=/opt/OV/newconfig + OV_OLDCFG_DIR=/opt/OV/old + OV_WWW_DIR=/opt/OV/www + OV_OPT10_DIR=/OV + OV_VAR10_DIR=/OV + OV_VAR10_SH_DIR=/OV/share + OV_ETC10_DIR=/OV + OV_ETC10_SH_DIR=/OV/share + OV_BIN_DIR=/opt/OV/bin + OV_TMP_DIR=/var/opt/OV/tmp + OV_LOG_DIR=/var/opt/OV/log + OV_CFG_DIR=/etc/opt/OV/share/conf + OV_ALT_CFG_DIR=/etc/opt/OV/share/#conf + OPCSVR_BIN_DIR=/opt/OV/bin/OpC + OPCSVR_INST_DIR=/opt/OV/bin/OpC/install + OPCSVR_LIB_DIR=/opt/OV/lib + OPCSVR_NLS_DIR=/opt/OV/lib/nls + OPCSVR_INC_DIR=/opt/OV/include + OPCSVR_UTIL_DIR=/opt/OV/bin/OpC/utils + OPCSVR_AGTINST_DIR=/opt/OV/bin/OpC/agtinstall + OPCSVR_OPC_DIR=/opt/OV/OpC + OPCSVR_NEWCFG_DIR=/opt/OV/newconfig/OpC + OPCSVR_OLDCFG_DIR=/opt/OV/old/OpC + OPCSVR_HELP_DIR=/var/opt/OV/share/help + OPCSVR_LRF_DIR=/etc/opt/OV/share/lrf + OPCSVR_REG_DIR=/etc/opt/OV/share/registration + OPCSVR_DB_DIR=/var/opt/OV/share/databases/OpC + OPCSVR_VEND_DIR=/var/opt/OV/share/databases/OpC/mgd_node/vendor + OPCSVR_CUST_DIR=/var/opt/OV/share/databases/OpC/mgd_node/customer + OPCSVR_TMP_DIR=/var/opt/OV/share/tmp/OpC + OPCSVR_LOG_DIR=/var/opt/OV/log/OpC + OPCSVR_CFG_DIR=/etc/opt/OV/share/conf/OpC + OPCSVR_APPL_DIR=/var/opt/OV/share/tmp/OpC_appl + OPCSVR_MAN_DIR=/opt/OV/man + OPCSVR_INFO_F=/opt/OV/bin/OpC/install/opcsvinfo + OPC_GUICLT_MSV_F=/etc/opt/OV/share/conf/opc_guiclt_msv + OPC_GUICLT_TMP_MSV_F=/tmp/opc_guiclt_msv + OVDB_CONFIG_FILE=/etc/opt/OV/share/conf/ovdbconf + OPCAGT_BIN_DIR=/opt/OV/bin/OpC + OPCAGT_LIB_DIR=/opt/OV/lib + OPCAGT_NLS_DIR=/opt/OV/lib/nls + OPCAGT_INC_DIR=/opt/OV/include + OPCAGT_UTIL_DIR=/opt/OV/bin/OpC/utils + OPCAGT_INST_DIR=/opt/OV/bin/OpC/install + OPCAGT_ACTMONCMD_DIR=/var/opt/OV/bin/OpC + OPCAGT_MON_DIR=/var/opt/OV/bin/OpC/monitor + OPCAGT_ACT_DIR=/var/opt/OV/bin/OpC/actions + OPCAGT_CMD_DIR=/var/opt/OV/bin/OpC/cmds + OPCAGT_LOG_DIR=/var/opt/OV/log/OpC + OPCAGT_CFG_DIR=/var/opt/OV/conf/OpC + OPCAGT_TMP_DIR=/var/opt/OV/tmp/OpC + OPCAGT_VARBIN_DIR=/var/opt/OV/tmp/OpC + OPCAGT_TMPBIN_DIR=/var/opt/OV/tmp/OpC/bin + OPCAGT_TMPCFG_DIR=/var/opt/OV/tmp/OpC/conf + OPCAGT_NEWCFG_DIR=/opt/OV/newconfig/OpC + OPCAGT_OLDCFG_DIR=/opt/OV/old/OpC + OPCAGT_NDINFO_F=/var/opt/OV/conf/OpC/nodeinfo + OPCAGT_INFO_F=/opt/OV/bin/OpC/install/opcinfo + OPCAGT_NETLS_F=/var/opt/OV/conf/OpC/opcnetls + OPCAGT_MGRCONF_F=/var/opt/OV/conf/OpC/mgrconf + OPCAGT_UPD_F=/var/opt/OV/tmp/OpC/update + OPCAGT_CLIENT_F=/opt/OV/bin/OpC/install/cfg.clients + OPCAGT_MGMTSV_F=/tmp/opc_tmp/mgmt_sv.dat + OPCMON=/opt/OV/bin/OpC/opcmon + OPCMSG=/opt/OV/bin/OpC/opcmsg + VUE_DIR=/etc/vue + VUE_USR_DIR=/usr/vue + VUE_ETC_DIR=/etc/vue + VUE_VAR_DIR=/var/vue + CDE_USR_DIR=/usr/dt + CDE_ETC_DIR=/etc/dt + CDE_VAR_DIR=/var/dt + SYSTEM_PATH=/bin:/usr/bin:/sbin:/usr/sbin:/etc:/usr/etc:/usr/ucb + OV_PATH=/opt/OV/bin + OPCSVR_PATH=/opt/OV/bin/OpC:/opt/OV/bin/OpC/agtinstall:/opt/OV/bin/OpC/install + OPCAGT_PATH=/opt/OV/bin/OpC:/opt/OV/bin/OpC/install:/var/opt/OV/bin/OpC/monitor :/var/opt/OV/bin/OpC/actions:/var/opt/OV/bin/OpC/cs + APPLNAME=ITO + LONG_APPLNAME=HP OpenView IT/Operations A.07.10 + umask 022 + ORATAB_LOC=/etc/oratab + SHLIBSUFFIX=@SHLIBSUFFIX@ + SUCCESS=0 + FAILURE=1 + WARNING=2 + EXIT_CODE=0 + MSG_LOGFILE= + MSG_INFO=I + MSG_ERROR=E + MSG_WARN=W + MSG_NOTE=N + MSG_USAGE=U + MSG_QUERY=Q + MSG_LOG=L + MSG_SAME=. + MSG_PREFIX= + MSG_PREFIX_INFO= + MSG_PREFIX_ERROR=ERROR: + MSG_PREFIX_WARN=WARNING: + MSG_PREFIX_NOTE=NOTE: + MSG_PREFIX_USAGE=USAGE: + MSG_PREFIX_QUERY=-------> + MSG_PREFIX_LOG=LOG: + MSG_FD=2 + [ 2 != 2 ] + + echo syslogd + cut -c1-14 Process=syslogd + MonitorName=Syslogd_Scania + PsOpt=-e + + ps -e + grep -v vp_chk.sh + grep -v grep + grep syslogd + wc -l tmpNumProcs=1 + + echo 1 NumProcs=1 + /opt/OV/bin/OpC/opcmon Syslogd_Scania=1 + exit 0
And I've checked and i have the file vp_chk.sh. Look: karina> ll /var/opt/OV/bin/OpC/monitor/vp_chk.sh -rwxr--r-- 1 root root 12310 Aug 30 12:51 /var/opt/OV/bin/OpC/monitor/vp_chk.sh
I Really have no idea why it's happening...
Thanks
Rafael M. Braga
Charles Guiocheau:
Rafael,
The script works correctly, it return a value to the monitor name with opcmon. In this case, it should not return a message "Cant' retrieve value" when launched by the opcmona process.
I found the document 8606325381 describing a problem generating the same error message when "many" monitors are distributed to the node. The document don't give a number for "many", but you have "many" monitors on the node, and most of them are running at a 5mn interval, so the solution in this document may solve your problem.
On the node add the following line in the /opt/OV/bin/OpC/opcinfo file : MAX_NBR_PARALLEL_ACTIONS 20
And restart the opcagt with opcagt -kill;opcagt -start
The value 20 is arbitrary (the document says higher than 10).
Contents of the HP doc :
title: Documentation of MAX_NBR_PARALLEL_ACTIONS in Release Notes document id: 8606325381 product: operations for UNIX version: 7.x os: HP-UX 11.0 updated: 2004-Oct-05 severity: Medium classification: Enhancement Request status: Investigation in plan: Under Review submitted: 2003-Aug-19
customer symptom
On a node with many monitors distributed, opcmona generated errors like
08/13/03 12:23:32 WARNING opcmona (Monitor Agent)(16907) [genmona.c:5154]: Can't retrieve value for monitor 'r3monwpa'. Suppressing further error messages. (OpC30-608)
The fix was to add MAX_NBR_PARALLEL_ACTIONS into the opcinfo file with a higher value than 10.
The customer wants this documented in the manuals particularly the SPI manuals in which it is likely many templates will be distributed. He also would like to see some guide lines as to how high to set this variable depending on how many templates he has distributed.
Rafael Mendonça Braga:
Hello Charles!!
Many Thanks man!! One more doubt now:
The file /opt/OV/bin/OpC/opcinfo doesn't exists on my node that has the problem.
It's normal?
I have to created one only with the Maximum paralel process info?
Thanks!!
Rafael M. Braga
Charles Guiocheau Nov 5, 2004 11:03:18 GMT 10 pts
-------------------------------------------------------------------------------- Oups, i give a wrong path, the correct path is /opt/OV/bin/OpC/install/opcinfo
And the file must exists, at least it contains the name of the HPOM server, the version of the agent components and the installation date/time, these informations are created/updated during the agent installation or update.
Rafael Mendonça Braga
:Thanks Charles!!
Now It's working!!
Sincerely,
Rafael M. Braga
Chimamiwa Nov 19, 2004 06:24:37 GMT
-------------------------------------------------------------------------------- Hi,
I am trying to monitor the following process on Solaris using the standard method described for process monitoring under OVOW.
/SYBASE_SOFT64/BBA-2_0/install/RUN_th_s011_v22
I defined my process to monitor in the procmon_local.cfg file. I am getting a message saying "Number of processes (0) less than min", although the process is up and running.
When I do a "ps", I get the following output on the system:
/bin/sh /SYBASE_SOFT64/BBA-2_0/install/RUN_th_s011_v22
Any ideas why this is not working ?
Thanks in advance
Regards
Godwill
Note: If you are the author of this question and wish to assign points to any of the answers, please login first.For more information on assigning points ,click here
Sort Answers By: Date or Points
Sukru ARSLAN Nov 19, 2004 06:53:01 GMT 5 pts
-------------------------------------------------------------------------------- Hi Chimamiwa,
1. First You should configure your procmon_local.cfg file correctly it is some tricky. For example you must use tabs between the columns.
2. Have a look at online help documentation. There is a detailed explanation for this with Monitoring Processes with the OSSPI title.
3. I think process monitoring is buggy in 7.21 I also met some problems in past. HP has announced a patch OVOW_00133 this might be corrected now
Ramkumar Devanathan Nov 19, 2004 08:03:04 GMT 5 pts
-------------------------------------------------------------------------------- Godwill,
you can install OVOW_00133 as a fix for some defects that exist in OSSPI B.02.53 in general.
you can use the osspi_procmon.pl instead of osspi_procmon.sh too. you may have to modify the policy to call osspi_procmon.pl isnetad of osspi_procmon.sh. the entry in config file should be like this -
/bin/sh<tab>/SYBASE_SOFT64/BBA-2_0/install/RUN_th_s011_v22<tab>x-Y
In any case, I have attached the osspi_procmon.pl - you can use this. uncompress it first.
hth. - ramd.
Ramkumar Devanathan Nov 19, 2004 08:07:38 GMT 5 pts
-------------------------------------------------------------------------------- godwill,
You can use this script crps.sh to generate entries for the procmon_local.cfg file. just run this script on your unix node, and it dumps procmon.cfg entries for all process currently live on the system. you can redirect the relevant ones - using grep - to a cfg file.
sample output - >> [ramd@linux procmon]$ ./crps.sh | grep post /usr/bin/postmaster -i 1 grep post 1 postgres: stats buffer process 1 postgres: stats collector process 1 <<
hth. - ramd.
Chimamiwa Nov 22, 2004 02:22:34 GMT N/A: Question Author
-------------------------------------------------------------------------------- Hi Ramkumar,
Thanks a lot for your script. I have got one question though. When I ran the script I got the following output: ------------------------------------------ /bin/sh /SYBASE_SOFT64/ASE-12_0/install/RUN_be_s0181_v39 1 /bin/sh /SYBASE_SOFT64/ASE-12_0/install/RUN_be_s0181_v39_back 1 grep /SYBASE_SOFT64/ASE-12_0/install/RUN_be_s0181_v39 1 ------------------------------------------ /bin/sh and /SYBASE_SOFT64/.... are seperated by a <TAB>. When I add that to the procmon_local.cfg, I get a message saying process /bin/sh has been added to the process config. I would have expected a message saying process '/bin/sh /SYBASE_SOFT64/ASE-12_0/install/RUN_be_s0181_v39' has been added to the process list.
Should I remove the TAB and replace it with a <SPACE> ? I still seem not to get my process monitored. I should say though that I haven't installed the patch 133 yet. I understand it fixes some process monitoring related issues. I will install it and see whether that helps.
Thanks in advance for your help
Godwill
Ramkumar Devanathan Nov 22, 2004 02:35:07 GMT 5 pts
-------------------------------------------------------------------------------- Godwill, ignore the semantics in the message. that is a bug... ovow_00133 will not fix this however. tabs are expected - not spaces.
However i wish to understand why the process are still not monitored.
please check the trace file /var/opt/OV/osspi/log/osspi.trc for any trace messages.
- ramd.
Chimamiwa Nov 22, 2004 02:55:27 GMT N/A: Question Author
-------------------------------------------------------------------------------- Hi Ramkumar,
I have configured tracing on one of the systems and I will be posting the result shortly.
Thanks
Godwill
Chimamiwa Nov 22, 2004 03:01:54 GMT N/A: Question Author
-------------------------------------------------------------------------------- Hi Ramkumar,
In the osspi.trc file, it says that it is looking for the process /bin/sh. Should I just ignore that as well?
-------------------------------------------- 1/22/2004 08:55:08 OSSPI(osspi_procmon.sh-14188): processing section SybASEProc 11/22/2004 08:55:08 OSSPI(osspi_procmon.sh-14188): looking for process /bin/sh 11/22/2004 08:55:08 OSSPI(osspi_procmon.sh-14188): outside hour/weekday 11/22/2004 08:56:01 OSSPI(osspi_procmon.sh-14339): processing config files 11/22/2004 08:56:01 OSSPI(osspi_procmon.sh-14338): processing config files 11/22/2004 08:56:01 OSSPI(osspi_procmon.sh-14338): processing section inetd 11/22/2004 08:56:01 OSSPI(osspi_procmon.sh-14338): looking for process inetd 11/22/2004 08:56:01 OSSPI(osspi_procmon.sh-14339): processing section syslog 11/22/2004 08:56:01 OSSPI(osspi_procmon.sh-14339): looking for process /usr/sbin/syslogd 11/22/2004 08:56:01 OSSPI(osspi_procmon.sh-14339): found Start token --------------------------------------------
My process group is called SybASEProc. Below find the contents of the procmon_local.cfg : ------------------------------------ [SybASEProc] /bin/sh /SYBASE_SOFT64/ASE-12_0/install/RUN_be_s0181_v39 * 1 -------------------------------------------
Thanks for your help
Regards
Godwill
Ramkumar Devanathan Nov 22, 2004 03:42:28 GMT 5 pts
-------------------------------------------------------------------------------- Godwill, use the perl script that i'd provided not the shell script. call osspi_procmon.pl instead of osspi_procmon.sh in your policy. this should work for you.
- ramd.
Chimamiwa Nov 22, 2004 04:54:33 GMT N/A: Question Author
-------------------------------------------------------------------------------- Hi Ramkumar,
I still get an error message saying that the process is not running although it is running. I am now using the osspi_procmon.pl script instead of the osspi_procmon.sh.
Below please find the output from the osspi.trc
------------------------------------------------ 11/22/2004 10:50:29 OSSPI(osspi_procmon.pl-24441): processing section [SybASEProc] 11/22/2004 10:50:29 OSSPI(osspi_procmon.pl-24441): looking for process details - /bin/sh, args /SYBASE_SOFT64/ASE-12_0/install/RUN_be_s0181_v39, user all 11/22/2004 10:50:29 OSSPI(osspi_procmon.pl-24441): sending opcmon call 0, SybASEProc~all~~/SYBASE_SOFT64/ASE-12_0/install/RUN_be_s0181_v39 11/22/2004 10:51:01 OSSPI(osspi_procmon.sh-24468): processing config files -------------------------------------------
Thanks for your help
Godwill
Chimamiwa Nov 22, 2004 04:55:53 GMT N/A: Question Author
-------------------------------------------------------------------------------- Hi Ramkumar,
Seems like it's showing the process as an argument for /bin/sh.
Regards
Godwill
Chimamiwa Nov 22, 2004 06:29:45 GMT N/A: Question Author
-------------------------------------------------------------------------------- Hi Ramkumar,
Any new findings ? I am still getting an error message that the process is not running although it's actually running.
Any new ideas?
Regards
Godwill
Ramkumar Devanathan Nov 22, 2004 06:34:26 GMT 5 pts
-------------------------------------------------------------------------------- Godwill, kindly please attach the new procmon.cfg files here.
since the process appears in ps listing in this manner -
/bin/sh /SYBASE_SOFT64/BBA-2_0/install/RUN_th_s011_v22
the entry in procmon.cfg needs to be as such, with /bin/sh as process name, and /SYBASE... as the argument.
- ramd.
Chimamiwa Nov 22, 2004 07:26:16 GMT N/A: Question Author
-------------------------------------------------------------------------------- Hi Ramkumar,
Attached please find the procmon_local.cfg where I have configured the process name of the process to be monitored.
Thanks for your help
Godwill
Ramkumar Devanathan Nov 22, 2004 07:37:37 GMT 8 pts
-------------------------------------------------------------------------------- godwill,
Were these entries generated from the script? i doubt it, because the entry generated looked like this -
<process name> <arguments> * 1
(separated by tabs)
which is wrong -
the entry should be
<process name> <arguments> 1
(separated by tabs)
if the process has no parameters, then '*' is present in the second column, and the third column should be a number or left blank.
use the attached procmon.cfg.
- ramd.
Chimamiwa Nov 22, 2004 08:19:26 GMT N/A: Question Author
-------------------------------------------------------------------------------- Hi Ramkumar,
Thanks for your help. Looks like it's now running fine. I have deplyed the policy to 2 nodes, one on which the process is running and another one on which the process is not running. I am getting messages from the node on which the process is not running saying that the process is not running. On the node on which the process is running, I am not getting any message.
However could you please clarify what the difference between the following configurations is and why the first variation will not work? -------------------------------------------- [SybASEProc] /bin/sh<TAB>/SYBASE_SOFT64/ASE-12_0/install/RUN_be_s0181_v39<TAB>*<TAB>1
SybASEProc /bin/sh<TAB>/SYBASE_SOFT64/ASE-12_0/install/RUN_be_s0181_v39<TAB>1 -------------------------------------------
Thanks for the clarification
Regards
Godwill
Chimamiwa Nov 22, 2004 08:25:28 GMT N/A: Question Author
-------------------------------------------------------------------------------- Hi Ramkumar,
Yes, I can confirm that the configuration you gave me is working fine. But I am getting a message which says that the number of processes (2) has exceeded the minimum. The reason for this is that besides the process I want to monitor (/bin/sh /SYBASE_SOFT64/ASE-12_0/install/RUN_be_s0181_v39), there is another process called /bin/sh /SYBASE_SOFT64/ASE-12_0/install/RUN_be_s0181_v39_back, which I do not want to monitor.
How can I make sure I am only monitoring the one process I am interested in ?
Thanks for your help
Regards
Godwill
Ramkumar Devanathan Nov 22, 2004 08:29:54 GMT 10 pts
-------------------------------------------------------------------------------- Godwill,
this entry is just not right -
-------------------------------------------- [SybASEProc] /bin/sh<TAB>/SYBASE_SOFT64/ASE-12_0/install/RUN_be_s0181_v39<TAB>*<TAB>1 --------------------------------------------
This is because the syntax expects that the third column must be either - blank - in which case, the script returns the count of active processes matching name-arg via opcmon call.
- or a number/bound (x..y), in which case, the process count is checked against the number/bound and if found not to match, then it dispatches an opcmsg informing of the same.
As for your problem with process names/arguments matching more than 1 entry in the ps listing, you can use the simple '$' anchor at the end of the argument column, so that an exact match is performed.
use this entry -
/bin/sh<tab>/SYBASE_SOFT64/BBA-2_0/install/RUN_th_s011_v22$<tab>1
(notice '$' at end of second column)
that should help.
- ramd.
Chimamiwa Nov 22, 2004 09:25:54 GMT N/A: Question Author
-------------------------------------------------------------------------------- Hi Ramkumar,
Thanks for the excellent explanation. 10 points for you. Allow me to take this opportunity to ask you for more clarification on the same issue:
If I want to monitor a process which shows up in the process table as follows, should I just configure the procmon.cfg in the same way? ------------------------------------- sybreps 20180 1 0 16:47:08 ? 0:00 sh -c ./RUN_ReplicationServer126_PROD & -------------------------------------- The reason why I am asking this is that I now have got more arguments for the process
Thanks in advance for your help
Regards
Godwill
Ramkumar Devanathan Nov 22, 2004 23:36:12 GMT 5 pts
-------------------------------------------------------------------------------- Godwill,
Use the script crps.sh... that will generate the entry for your process as you please.
it generates an entry with current count of active instances of a process in the third column. for instance if 3 instances of process /bin/abc are running with arguments '-a -m', the entry it generates are -
/bin/abc<tab>-a -m<tab>3
you can modify 3 to your threshold for active process instances of process /bin/abc.
Hth. - ramd.
Chimamiwa Nov 23, 2004 03:27:39 GMT N/A: Question Author
-------------------------------------------------------------------------------- Hi Ramkumar,
Blendend! Thanks for that. It all worked.
Thanks. 10 points to you
Godwill
Chimamiwa Nov 23, 2004 04:38:32 GMT N/A: Question Author
-------------------------------------------------------------------------------- Hi Ramkumar,
Somewhat strange. After a while when this seemed to be working, I am not getting error messages saying that the process is no longer running. I have checked and double-checked using your crsp.sh script and see that the process is actually runnning. I get the following message in the message browser: ------------------------------------------- SybRepMgr: proc=sh arg=-c ./RUN_ReplicationServer126_PROD & : Number of processes (0) less than min ------------------------------------------ Somewhat strange. Attached please find my procmon_local.cfg
Thanks once again for your help
Regards
Godwill
Ramkumar Devanathan Nov 23, 2004 04:44:51 GMT 5 pts
-------------------------------------------------------------------------------- Godwill, i think the issue was a space after the '&' character in the second column in procmon_local.cfg file. I think if you remove the space there, you should be fine. see attached file.
- ramd.
Chimamiwa Nov 23, 2004 05:37:57 GMT N/A: Question Author
-------------------------------------------------------------------------------- Hi Ramkumar,
Thanks for your help. The problem was that the UNIX admins changed the way the process is started. That's why my policy worked for some time and then failed after they had changed the way the process is started.
My monitor was looking for "sh -c RUN_ReplicationServer126_PROD &" because that's how they started the process before the change.
NOw the process runs as follows:
"sh -c RUN_ReplicationServer126_PROD &". That's why my policy says process not running since I have "sh -c ./RUN_ReplicationServer126_PROD & 1" in my procmon_local.cfg.
Since they don't have a standard way of starting the processes, they have suggested to me that I monitor only the process name and not include the path or shell that's used.
E.g. To monitor the following process: "sh -c ./RUN_ReplicationServer126_PROD &", I should only look for the string "RUN_ReplicationServer126_PROD". Similarly to monitor the following process: "/bin/sh /SYBASE_SOFT64/ASE-12_0/install/RUN_be_s0181_v39", I should only look for the process string "RUN_be_s0181_v39" to check whether the process is running.
Another thing is that each of the processes above run under certain users. I would need to take this into consideration as well.
How can I go about doing this using the procmon.cfg?
Thanks in advance for your help
Regards
Godwill
Chimamiwa Nov 23, 2004 05:57:25 GMT N/A: Question Author
-------------------------------------------------------------------------------- Hi Ramkumar,
In the OVOW online documentation, it's mentioned that one can use @user=[<name>[,...]], where <name> is the name of a user running the process. Do you possibly have an example for this.
Thanks in advance
Godwill
Chimamiwa Nov 23, 2004 06:09:31 GMT N/A: Question Author
-------------------------------------------------------------------------------- Hi Ramkumar,
I have done the following modification to my procmon_local.cfg: --------------------------------- [SybRepMgr] RUN_ReplicationServer126_PROD @user=sybreps
-----------------------------------
I am still testing this to see whether it will work fine
Thanks
Godwill
Ramkumar Devanathan Nov 23, 2004 06:17:33 GMT 6 pts
-------------------------------------------------------------------------------- Entry should be -
sh<tab>RUN_ReplicationServer126_PROD<tab>1
godwill, it is always
process pattern<tab>arg pattern<tab>count
Is this very confusing to you?
and the user specification you have made is correct.
- ramd.
Chimamiwa Nov 23, 2004 06:30:16 GMT N/A: Question Author
-------------------------------------------------------------------------------- Hi Ramkumar,
Yes this is a bit confusing I should admit. Ideally what I would like to do is do a "ps -ef" and then "grep" for a particular string.
E.G. To monitor a process which is shown in the process table as follows: -------------------------------------------- guest@be-s0182-c19 $ ps -ef | grep RUN_ReplicationServer126_PROD |grep -v grep sybreps 15945 1 0 11:50:17 pts/15 0:00 sh -c ./RUN_ReplicationServer126_PROD & -------------------------------------------
What I would like my policy to do is check only for the string "RUN_ReplicationServer126_PROD". The reason is that this process sometimes can get started as follows: ------------------------------------------- guest@be-s0182-c19 $ ps -ef | grep RUN_ReplicationServer126_PROD |grep -v grep sybreps 15845 1 0 10:50:17 pts/15 0:00 /bin/sh ./RUN_ReplicationServer126_PROD -------------------------------------------- Or sometimes it gets started as follows:
------------------------------------------- guest@be-s0182-c19 $ ps -ef | grep RUN_ReplicationServer126_PROD |grep -v grep sybreps 13335 1 0 09:10:17 pts/15 0:00 sh -c RUN_ReplicationServer126_PROD & ------------------------------------------- So this is my dilemma. That's why I prefer just to look only for the process name.
Thanks for your help. Hope I have expressed myself well.
Regards
Godwill
Ramkumar Devanathan Nov 23, 2004 06:36:17 GMT 6 pts
-------------------------------------------------------------------------------- godwill,
the process according to you appears in the ps listing in this manner -
>> sybreps 15845 1 0 10:50:17 pts/15 0:00 /bin/sh ./RUN_ReplicationServer126_PROD <<
or
>> sybreps 13335 1 0 09:10:17 pts/15 0:00 sh -c RUN_ReplicationServer126_PROD & <<
In either case, the process name contains the pattern 'sh' and the process argument contains the pattern 'RUN_ReplicationServer126_PROD'. so, you have a match always if your process entry looks like this - this is what I'd posted in my earlier reply too -
sh<tab>RUN_ReplicationServer126_PROD<tab>1
does this work for you or not?
- ramd.
Chimamiwa Nov 23, 2004 06:48:32 GMT N/A: Question Author
-------------------------------------------------------------------------------- Hi Ramkumar,
It seems not to work. I am getting the following error message in the browser: -------------------------------------------- SybRepMgr: proc=sh arg=RUN_ReplicationServer126_PROD: Number of processes (0) less than min ------------------------------------------- My procmon_local.cfg is as follows (with tabs): ------------------------------------------- [SybRepMgr] sh RUN_ReplicationServer126_PROD 1 ------------------------------------------
ps -ef |grep RUN_ReplicationServer126_PROD gives me the following: ----------------------------------------- sybreps 15945 1 0 11:50:17 pts/15 0:00 sh -c ./RUN_ReplicationServer126_PROD & --------------------------------------------
Thanks for your help
Godwill
Ramkumar Devanathan Nov 23, 2004 06:52:04 GMT 3 pts
-------------------------------------------------------------------------------- Godwill, let me see if this works for me. give me some time. I will get back to you tomorrow.
It would be useful if yuo can attach the trace file osspi.trc.
thx. - ramd.
Chimamiwa Nov 23, 2004 06:55:31 GMT N/A: Question Author
-------------------------------------------------------------------------------- Hi Ramkumar,
Attached please find the osspi.trc log file
Thanks for your help
Regards
Godwill
Ramkumar Devanathan Nov 23, 2004 06:58:10 GMT 5 pts
-------------------------------------------------------------------------------- from the entries in the trc file, it looks like you are running osspi_procmon.sh script, not osspi_procmon.pl script -
>> 11/23/2004 12:50:56 OSSPI(osspi_procmon.sh-13457): processing section syslog 11/23/2004 12:50:56 OSSPI(osspi_procmon.sh-13457): looking for process /usr/sbin/syslogd 11/23/2004 12:50:56 OSSPI(osspi_procmon.sh-13457): found Start token 11/23/2004 12:50:57 OSSPI(osspi_procmon.sh-13522): processing section inetd 11/23/2004 12:50:57 OSSPI(osspi_procmon.sh-13522): looking for process inetd 11/23/2004 12:51:56 OSSPI(osspi_procmon.sh-13782): processing config files 11/23/2004 12:51:56 OSSPI(osspi_procmon.sh-13816): processing config files 11/23/2004 12:51:56 OSSPI(osspi_procmon.sh-13782): processing section inetd 11/23/2004 12:51:56 OSSPI(osspi_procmon.sh-13782): looking for process inetd 11/23/2004 12:51:57 OSSPI(osspi_procmon.sh-13895): processing config files 11/23/2004 12:51:57 OSSPI(osspi_procmon.sh-13895): processing section syslog 11/23/2004 12:51:57 OSSPI(osspi_procmon.sh-13895): looking for process /usr/sbin/syslogd 11/23/2004 12:51:57 OSSPI(osspi_procmon.sh-13895): found Start token 11/23/2004 12:52:50 OSSPI(osspi_procmon.sh-14099): processing config files 11/23/2004 12:52:50 OSSPI(osspi_procmon.sh-14099): processing section SybRepMgr 11/23/2004 12:52:50 OSSPI(osspi_procmon.sh-14099): looking for process sh 11/23/2004 12:52:56 OSSPI(osspi_procmon.sh-14231): processing config files 11/23/2004 12:52:56 OSSPI(osspi_procmon.sh-14246): processing config files 11/23/2004 12:52:56 OSSPI(osspi_procmon.sh-14231): processing section syslog 11/23/2004 12:52:56 OSSPI(osspi_procmon.sh-14246): processing section inetd 11/23/2004 12:52:56 OSSPI(osspi_procmon.sh-14231): looking for process /usr/sbin/syslogd 11/23/2004 12:52:56 OSSPI(osspi_procmon.sh-14231): found Start token 11/23/2004 12:52:56 OSSPI(osspi_procmon.sh-14246): looking for process inetd
<< - ramd
Chimamiwa Nov 23, 2004 07:22:55 GMT N/A: Question Author
-------------------------------------------------------------------------------- Hi Ramkumar,
I have tried the perl script at one point but bthe behavior was similar. I will change the policy and run the osspi_procmon.pl and send you the trace file again.
Thanks for the help
Godwill
Chimamiwa Nov 23, 2004 07:28:05 GMT N/A: Question Author
-------------------------------------------------------------------------------- Hi Ramkumar,
I have run the policy using osspi_procmon.pl and this is the output I get for my process in the osspi.trc: ------------------------------------------ 11/23/2004 13:24:10 OSSPI(osspi_procmon.pl-28854): processing config files 11/23/2004 13:24:10 OSSPI(osspi_procmon.pl-28854): processing section [SybRepMgr] 11/23/2004 13:24:10 OSSPI(osspi_procmon.pl-28854): looking for process details - sh, args RUN_ReplicationServer126_PROD, user all 11/23/2004 13:24:10 OSSPI(osspi_procmon.pl-28854): found 0 instances of proc sh ---------------------------------------------
Thanks
Godwill
Ramkumar Devanathan Nov 23, 2004 11:20:10 GMT 10 pts
-------------------------------------------------------------------------------- godwill, it works fine for me with similarly named dummy processes that i ran. request you to open a support call with HP to resolve this.
Hth. - ramd.
Chimamiwa Nov 23, 2004 15:59:13 GMT N/A: Question Author
-------------------------------------------------------------------------------- Thanks for that Ramkumar. I have opened a support call for this because it is really strange. I have not heard from Support yet. In the mean time I have written my own custom shell script which simply does the following:
ps -fu <user> |grep <process-string> | grep -v grep | wc -l and it seems to work fine. It's a shame really that the osspi_procmon.pl/sh seems not to cope with such simple things??
Could you possibly send me the osspi_procmon.pl or osspi_procmon.sh script that you are using for comparison purposes.
Thanks a lot in advance
Godwill
Ramkumar Devanathan Nov 23, 2004 16:01:50 GMT Unassigned
-------------------------------------------------------------------------------- Godwill, my osspi_procmon.pl is same as the one you are using.
- ramd.
Operations for Unix 8 Dec 27, 2006 11:14:20 GMT Unassigned
-------------------------------------------------------------------------------- I'm having the same problem with OSSPI monitoring 4 unix processes. Did you resolve your issue? If so can you help me out?
Thanks
Chrsitian Salinas Mar 26, 2008 15:33:48 GMT Unassigned
-------------------------------------------------------------------------------- HI
How to monitoring proccess linux
"named"
HI add entries into procmon.cfg
[name] named * 1 @start=/etc/init.d/named stop; etc/init.d/named start
NOT Working
tHKS
Society
Groupthink : Two Party System as Polyarchy : Corruption of Regulators : Bureaucracies : Understanding Micromanagers and Control Freaks : Toxic Managers : Harvard Mafia : Diplomatic Communication : Surviving a Bad Performance Review : Insufficient Retirement Funds as Immanent Problem of Neoliberal Regime : PseudoScience : Who Rules America : Neoliberalism : The Iron Law of Oligarchy : Libertarian Philosophy
Quotes
War and Peace : Skeptical Finance : John Kenneth Galbraith :Talleyrand : Oscar Wilde : Otto Von Bismarck : Keynes : George Carlin : Skeptics : Propaganda : SE quotes : Language Design and Programming Quotes : Random IT-related quotes : Somerset Maugham : Marcus Aurelius : Kurt Vonnegut : Eric Hoffer : Winston Churchill : Napoleon Bonaparte : Ambrose Bierce : Bernard Shaw : Mark Twain Quotes
Bulletin:
Vol 25, No.12 (December, 2013) Rational Fools vs. Efficient Crooks The efficient markets hypothesis : Political Skeptic Bulletin, 2013 : Unemployment Bulletin, 2010 : Vol 23, No.10 (October, 2011) An observation about corporate security departments : Slightly Skeptical Euromaydan Chronicles, June 2014 : Greenspan legacy bulletin, 2008 : Vol 25, No.10 (October, 2013) Cryptolocker Trojan (Win32/Crilock.A) : Vol 25, No.08 (August, 2013) Cloud providers as intelligence collection hubs : Financial Humor Bulletin, 2010 : Inequality Bulletin, 2009 : Financial Humor Bulletin, 2008 : Copyleft Problems Bulletin, 2004 : Financial Humor Bulletin, 2011 : Energy Bulletin, 2010 : Malware Protection Bulletin, 2010 : Vol 26, No.1 (January, 2013) Object-Oriented Cult : Political Skeptic Bulletin, 2011 : Vol 23, No.11 (November, 2011) Softpanorama classification of sysadmin horror stories : Vol 25, No.05 (May, 2013) Corporate bullshit as a communication method : Vol 25, No.06 (June, 2013) A Note on the Relationship of Brooks Law and Conway Law
History:
Fifty glorious years (1950-2000): the triumph of the US computer engineering : Donald Knuth : TAoCP and its Influence of Computer Science : Richard Stallman : Linus Torvalds : Larry Wall : John K. Ousterhout : CTSS : Multix OS Unix History : Unix shell history : VI editor : History of pipes concept : Solaris : MS DOS : Programming Languages History : PL/1 : Simula 67 : C : History of GCC development : Scripting Languages : Perl history : OS History : Mail : DNS : SSH : CPU Instruction Sets : SPARC systems 1987-2006 : Norton Commander : Norton Utilities : Norton Ghost : Frontpage history : Malware Defense History : GNU Screen : OSS early history
Classic books:
The Peter Principle : Parkinson Law : 1984 : The Mythical Man-Month : How to Solve It by George Polya : The Art of Computer Programming : The Elements of Programming Style : The Unix Hater’s Handbook : The Jargon file : The True Believer : Programming Pearls : The Good Soldier Svejk : The Power Elite
Most popular humor pages:
Manifest of the Softpanorama IT Slacker Society : Ten Commandments of the IT Slackers Society : Computer Humor Collection : BSD Logo Story : The Cuckoo's Egg : IT Slang : C++ Humor : ARE YOU A BBS ADDICT? : The Perl Purity Test : Object oriented programmers of all nations : Financial Humor : Financial Humor Bulletin, 2008 : Financial Humor Bulletin, 2010 : The Most Comprehensive Collection of Editor-related Humor : Programming Language Humor : Goldman Sachs related humor : Greenspan humor : C Humor : Scripting Humor : Real Programmers Humor : Web Humor : GPL-related Humor : OFM Humor : Politically Incorrect Humor : IDS Humor : "Linux Sucks" Humor : Russian Musical Humor : Best Russian Programmer Humor : Microsoft plans to buy Catholic Church : Richard Stallman Related Humor : Admin Humor : Perl-related Humor : Linus Torvalds Related humor : PseudoScience Related Humor : Networking Humor : Shell Humor : Financial Humor Bulletin, 2011 : Financial Humor Bulletin, 2012 : Financial Humor Bulletin, 2013 : Java Humor : Software Engineering Humor : Sun Solaris Related Humor : Education Humor : IBM Humor : Assembler-related Humor : VIM Humor : Computer Viruses Humor : Bright tomorrow is rescheduled to a day after tomorrow : Classic Computer Humor
The Last but not Least Technology is dominated by two types of people: those who understand what they do not manage and those who manage what they do not understand ~Archibald Putt. Ph.D
Copyright © 1996-2021 by Softpanorama Society. www.softpanorama.org was initially created as a service to the (now defunct) UN Sustainable Development Networking Programme (SDNP) without any remuneration. This document is an industrial compilation designed and created exclusively for educational use and is distributed under the Softpanorama Content License. Original materials copyright belong to respective owners. Quotes are made for educational purposes only in compliance with the fair use doctrine.
FAIR USE NOTICE This site contains copyrighted material the use of which has not always been specifically authorized by the copyright owner. We are making such material available to advance understanding of computer science, IT technology, economic, scientific, and social issues. We believe this constitutes a 'fair use' of any such copyrighted material as provided by section 107 of the US Copyright Law according to which such material can be distributed without profit exclusively for research and educational purposes.
This is a Spartan WHYFF (We Help You For Free) site written by people for whom English is not a native language. Grammar and spelling errors should be expected. The site contain some broken links as it develops like a living tree...
|
|
You can use PayPal to to buy a cup of coffee for authors of this site |
Disclaimer:
The statements, views and opinions presented on this web page are those of the author (or referenced source) and are not endorsed by, nor do they necessarily reflect, the opinions of the Softpanorama society. We do not warrant the correctness of the information provided or its fitness for any purpose. The site uses AdSense so you need to be aware of Google privacy policy. You you do not want to be tracked by Google please disable Javascript for this site. This site is perfectly usable without Javascript.
Last modified: March 12, 2019