|
|
Home | Switchboard | Unix Administration | Red Hat | TCP/IP Networks | Neoliberalism | Toxic Managers |
| (slightly skeptical) Educational society promoting "Back to basics" movement against IT overcomplexity and bastardization of classic Unix | |||||||
Oct 17, 2017 | linux.die.net
Name
perf-stat - Run a command and gather performance counter statistics
Synopsisperf stat [-e <EVENT> | --event=EVENT] [-a] <command> perf stat [-e <EVENT> | --event=EVENT] [-a] - <command> [<options>]DescriptionThis command runs a command and gathers performance counter statistics from it.
Options<command>...
Examples
- Any command you can specify in a shell.
- -e, --event=
- Select the PMU event. Selection can be a symbolic event name (use perf list to list all events) or a raw PMU event (eventsel+umask) in the form of rNNN where NNN is a hexadecimal event descriptor.
- -i, --no-inherit
- child tasks do not inherit counters
- -p, --pid=<pid>
- stat events on existing process id (comma separated list)
- -t, --tid=<tid>
- stat events on existing thread id (comma separated list)
- -a, --all-cpus
- system-wide collection from all CPUs
- -c, --scale
- scale/normalize counter values
- -r, --repeat=<n>
- repeat command and print average + stddev (max: 100)
- -B, --big-num
- print large numbers with thousands' separators according to locale
- -C, --cpu=
- Count only on the list of CPUs provided. Multiple CPUs can be provided as a comma-separated list with no space: 0,1. Ranges of CPUs are specified with -: 0-2. In per-thread mode, this option is ignored. The -a option is still necessary to activate system-wide monitoring. Default is to count on all CPUs.
- -A, --no-aggr
- Do not aggregate counts across all monitored CPUs in system-wide mode (-a). This option is only valid in system-wide mode.
- -n, --null
- null run - don't start any counters
- -v, --verbose
- be more verbose (show counter open errors, etc)
- -x SEP, --field-separator SEP
- print counts using a CSV-style output to make it easy to import directly into spreadsheets. Columns are separated by the string specified in SEP.
- -G name, --cgroup name
- monitor only in the container (cgroup) called "name". This option is available only in per-cpu mode. The cgroup filesystem must be mounted. All threads belonging to container "name" are monitored when they run on the monitored CPUs. Multiple cgroups can be provided. Each cgroup is applied to the corresponding event, i.e., first cgroup to first event, second cgroup to second event and so on. It is possible to provide an empty cgroup (monitor all the time) using, e.g., -G foo,,bar. Cgroups must have corresponding events, i.e., they always refer to events defined earlier on the command line.
- -o file, --output file
- Print the output into the designated file.
- --append
- Append to the output file designated with the -o option. Ignored if -o is not specified.
- --log-fd
- Log output to fd, instead of stderr. Complementary to --output, and mutually exclusive with it. --append may be used here. Examples: 3>results perf stat --log-fd 3 - $cmd 3>>results perf stat --log-fd 3 --append - $cmd
$ perf stat - make -j
See Also Referenced By perf (1), perf-record (1), perf-report (1) perf-record(1) - Linux man page Name
8117.370256 task clock ticks # 11.281 CPU utilization factor 678 context switches # 0.000 M/sec 133 CPU migrations # 0.000 M/sec 235724 pagefaults # 0.029 M/sec 24821162526 CPU cycles # 3057.784 M/sec 18687303457 instructions # 2302.138 M/sec 172158895 cache references # 21.209 M/sec 27075259 cache misses # 3.335 M/secperf-record - Run a command and record its profile into perf.data
Synopsisperf record [-e <EVENT> | --event=EVENT] [-l] [-a] <command> perf record [-e <EVENT> | --event=EVENT] [-l] [-a] - <command> [<options>]DescriptionThis command runs a command and gathers a performance counter profile from it, into perf.data - without displaying anything.
This file can then be inspected later on, using perf report .
Options<command>...
See Also Referenced By perf (1), perf-annotate (1), perf-archive (1), perf-buildid-cache (1), perf-buildid-list (1), perf-diff (1), perf-evlist (1), perf-inject (1), perf-kmem (1), perf-kvm (1), perf-probe (1), perf-sched (1), perf-script (1), perf-timechart (1)
- Any command you can specify in a shell.
- -e, --event=
- Select the PMU event. Selection can be a symbolic event name (use perf list to list all events) or a raw PMU event (eventsel+umask) in the form of rNNN where NNN is a hexadecimal event descriptor.
- --filter=<filter>
- Event filter.
- -a, --all-cpus
- System-wide collection from all CPUs.
- -l
- Scale counter values.
- -p, --pid=
- Record events on existing process ID (comma separated list).
- -t, --tid=
- Record events on existing thread ID (comma separated list).
- -u, --uid=
- Record events in threads owned by uid. Name or number.
- -r, --realtime=
- Collect data with this RT SCHED_FIFO priority.
- -D, --no-delay
- Collect data without buffering.
- -A, --append
- Append to the output file to do incremental profiling.
- -f, --force
- Overwrite existing data file. (deprecated)
- -c, --count=
- Event period to sample.
- -o, --output=
- Output file name.
- -i, --no-inherit
- Child tasks do not inherit counters.
- -F, --freq=
- Profile at this frequency.
- -m, --mmap-pages=
- Number of mmap data pages. Must be a power of two.
- -g, --call-graph
- Do call-graph (stack chain/backtrace) recording.
- -q, --quiet
- Don't print any message, useful for scripting.
- -v, --verbose
- Be more verbose (show counter open errors, etc).
- -s, --stat
- Per thread counts.
- -d, --data
- Sample addresses.
- -T, --timestamp
- Sample timestamps. Use it with perf report -D to see the timestamps, for instance.
- -n, --no-samples
- Don't sample.
- -R, --raw-samples
- Collect raw sample records from all opened counters (default for tracepoint counters).
- -C, --cpu
- Collect samples only on the list of CPUs provided. Multiple CPUs can be provided as a comma-separated list with no space: 0,1. Ranges of CPUs are specified with -: 0-2. In per-thread mode with inheritance mode on (default), samples are captured only when the thread executes on the designated CPUs. Default is to monitor all CPUs.
- -N, --no-buildid-cache
- Do not update the builid cache. This saves some overhead in situations where the information in the perf.data file (which includes buildids) is sufficient.
- -G name,..., --cgroup name,...
- monitor only in the container (cgroup) called "name". This option is available only in per-cpu mode. The cgroup filesystem must be mounted. All threads belonging to container "name" are monitored when they run on the monitored CPUs. Multiple cgroups can be provided. Each cgroup is applied to the corresponding event, i.e., first cgroup to first event, second cgroup to second event and so on. It is possible to provide an empty cgroup (monitor all the time) using, e.g., -G foo,,bar. Cgroups must have corresponding events, i.e., they always refer to events defined earlier on the command line.
- -b, --branch-any
- Enable taken branch stack sampling. Any type of taken branch may be sampled. This is a shortcut for --branch-filter any. See --branch-filter for more infos.
- -j, --branch-filter
- Enable taken branch stack sampling. Each sample captures a series of consecutive taken branches. The number of branches captured with each sample depends on the underlying hardware, the type of branches of interest, and the executed code. It is possible to select the types of branches captured by enabling filters. The following filters are defined:
- Б─╒ any: any type of branches
- Б─╒ any_call: any function call or system call
- Б─╒ any_ret: any function return or system call return
- Б─╒ ind_call: any indirect branch
- Б─╒ u: only when the branch target is at the user level
- Б─╒ k: only when the branch target is in the kernel
- Б─╒ hv: only when the target is at the hypervisor level
- The option requires at least one branch type among any, any_call, any_ret, ind_call. The privilege levels may be ommitted, in which case, the privilege levels of the associated event are applied to the branch filter. Both kernel (k) and hypervisor (hv) privilege levels are subject to permissions. When sampling on multiple events, branch stack sampling is enabled for all the sampling events. The sampled branch type is the same for all events. The various filters must be specified as a comma separated list: --branch-filter any_ret,u,k Note that this feature may not be available on all processors.
|
|
Switchboard | ||||
| Latest | |||||
| Past week | |||||
| Past month | |||||
Oct 17, 2017 | www.tecmint.com
In a day of fierceless competition between companies, it is important that we learn how to use what we have at the best of its capacity. The waste of hardware or software resources, or the lack of ability to know how to use them more efficiently, ends up being a loss that we just can't afford if we want to be at the top of our game.
At the same time, we must be careful to not take our resources to a limit where sustained use will yield irreparable damage.
In this article we will introduce you to a relatively new performance analysis tool and provide tips that you can use to monitor your Linux systems, including hardware and applications. This will help you to ensure that they operate so that you are capable to produce the desired results without wasting resources or your own energy.
Introducing and installing Perf in LinuxAmong others, Linux provides a performance monitoring and analysis tool called conveniently perf . So what distinguishes perf from other well-known tools with which you are already familiar?
The answer is that perf provides access to the Performance Monitoring Unit in the CPU, and thus allows us to have a close look at the behavior of the hardware and its associated events.
In addition, it can also monitor software events, and create reports out of the data that is collected.
You can install perf in RPM-based distributions with:
# yum update && yum install perf     [CentOS / RHEL / Fedora]
# dnf update && dnf install perf     [Fedora 23+ releases]
In Debian and derivatives:
# sudo aptitude update && sudo aptitude install linux-tools-$(uname -r) linux-tools-genericIf
uname -rin the command above returns extra strings besides the actual version ( 3.2.0-23-generic in my case), you may have to type linux-tools-3.2.0-23 instead of using the output of unameIt is also important to note that perf yields incomplete results when run in a guest on top of VirtualBox or VMWare as they do not allow access to hardware counters as other virtualization technologies (such as KVM or XEN ) do.
Additionally, keep in mind that some perf commands may be restricted to root by default, which can be disabled (until the system is rebooted) by doing:
# echo 0 > /proc/sys/kernel/perf_event_paranoidIf you need to disable paranoid mode permanently, update the following setting in /etc/sysctl.conf file.
kernel.perf_event_paranoid = 0SubcommandsOnce you have installed perf , you can refer to its man page for a list of available subcommands (you can think of subcommands as special options that open a specific window into the system). For best and more complete results, use perf either as root or through sudo
Perf listperf list (without options) returns all the symbolic event types (long list). If you want to view the list of events available in a specific category, use perf list followed by the category name ([ hw|sw|cache|tracepoint|pmu|event_glob ]), such as:
Display list of software pre-defined events in Linux:
# perf list sw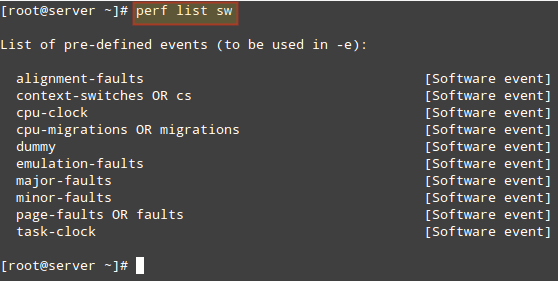
List Software Pre-defined Events in Linux Perf stat
perf stat runs a command and collects Linux performance statistics during the execution of such command. What happens in our system when we run dd
# perf stat dd if=/dev/zero of=test.iso bs=10M count=1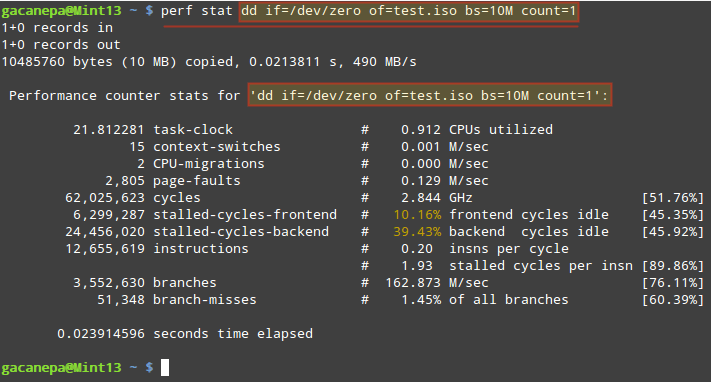
Collects Performance Statistics of Linux Command
The stats shown above indicate, among other things:
- The execution of the dd command took 21.812281 milliseconds of CPU. If we divide this number by the "seconds time elapsed" value below ( 23.914596 milliseconds), it yields 0.912 (CPU utilized).
- While the command was executed, 15 context-switches (also known as process switches) indicate that the CPUs were switched 15 times from one process (or thread) to another.
- CPU migrations is the expected result when in a 2-core CPU the workload is distributed evenly between the number of cores.
During that time ( 21.812281 milliseconds), the total number of CPU cycles that were consumed was 62,025,623 , which divided by 0.021812281 seconds gives 2.843 GHz.- If we divide the number of cycles by the total instructions count we get 4.9 Cycles Per Instruction, which means each instruction took almost 5 CPU cycles to complete (on average). We can blame this (at least in part) on the number of branches and branch-misses (see below), which end up wasting or misusing CPU cycles.
- As the command was executed, a total of 3,552,630 branches were encountered. This is the CPU-level representation of decision points and loops in the code. The more branches, the lower the performance. To compensate for this, all modern CPUs attempt to predict the flow the code will take. 51,348 branch-misses indicate the prediction feature was wrong 1.45% of the time.
The same principle applies to gathering stats (or in other words, profiling) while an application is running. Simply launch the desired application and after a reasonable period of time (which is up to you) close it, and perf will display the stats in the screen. By analyzing those stats you can identify potential problems.
Perf topperf top is similar to top command , in that it displays an almost real-time system profile (also known as live analysis).
With the
-aoption you will display all of the known event types, whereas the-eoption will allow you to choose a specific event category (as returned by perf list ):Will display all cycles event.
perf top -aWill display all cpu-clock related events.
perf top -e cpu-clock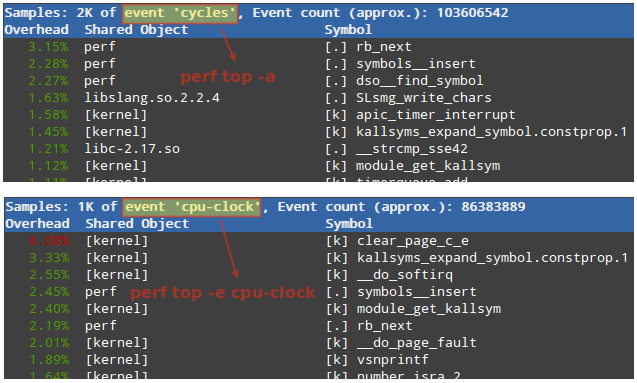
Live Analysis of Linux Performance
The first column in the output above represents the percentage of samples taken since the beginning of the run, grouped by function Symbol and Shared Object. More options are available in man perf-top
Perf recordperf record runs a command and saves the statistical data into a file named perf.data inside the current working directory. It runs similarly to perf stat
Type perf record followed by a command:
# perf record dd if=/dev/null of=test.iso bs=10M count=1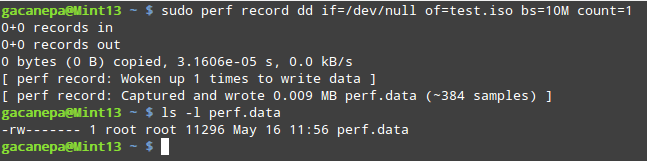
Record Command Statistical Data Perf report
perf report formats the data collected in perf.data above into a performance report:
# sudo perf report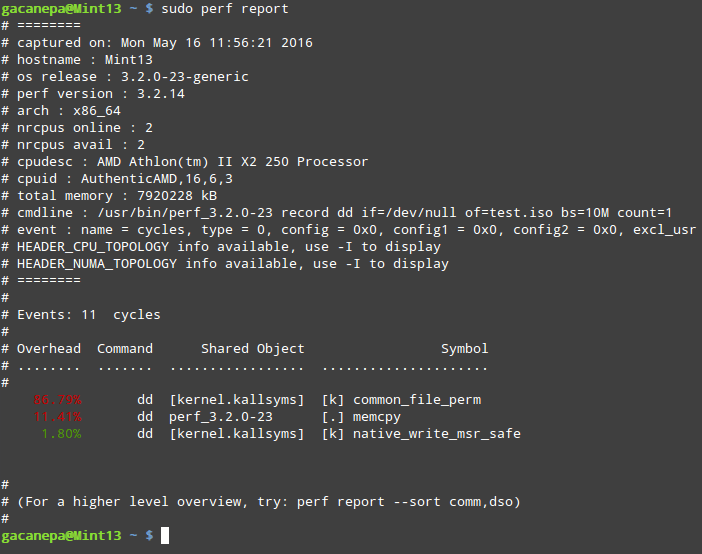
Perf Linux Performance Report
All of the above subcommands have a dedicated man page that can be invoked as:
# man perf-subcommandwhere subcommand is either list , stat top record , or report . These are the most frequently used subcommands; others are listed in the documentation (refer to the Summary section for the link).
SummaryIn this guide we have introduced you to perf , a performance monitoring and analysis tool for Linux. We highly encourage you to become familiar with its documentation which is maintained in https://perf.wiki.kernel.org .
If you find applications that are consuming a high percentage of resources, you may consider modifying the source code, or use other alternatives.
If you have questions about this article or suggestions to improve, we are all ears. Feel free to reach us using the comment form below.
Oct 17, 2017 | linux.die.net
Name
perf-stat - Run a command and gather performance counter statistics
Synopsisperf stat [-e <EVENT> | --event=EVENT] [-a] <command> perf stat [-e <EVENT> | --event=EVENT] [-a] - <command> [<options>]DescriptionThis command runs a command and gathers performance counter statistics from it.
Options<command>...
Examples
- Any command you can specify in a shell.
- -e, --event=
- Select the PMU event. Selection can be a symbolic event name (use perf list to list all events) or a raw PMU event (eventsel+umask) in the form of rNNN where NNN is a hexadecimal event descriptor.
- -i, --no-inherit
- child tasks do not inherit counters
- -p, --pid=<pid>
- stat events on existing process id (comma separated list)
- -t, --tid=<tid>
- stat events on existing thread id (comma separated list)
- -a, --all-cpus
- system-wide collection from all CPUs
- -c, --scale
- scale/normalize counter values
- -r, --repeat=<n>
- repeat command and print average + stddev (max: 100)
- -B, --big-num
- print large numbers with thousands' separators according to locale
- -C, --cpu=
- Count only on the list of CPUs provided. Multiple CPUs can be provided as a comma-separated list with no space: 0,1. Ranges of CPUs are specified with -: 0-2. In per-thread mode, this option is ignored. The -a option is still necessary to activate system-wide monitoring. Default is to count on all CPUs.
- -A, --no-aggr
- Do not aggregate counts across all monitored CPUs in system-wide mode (-a). This option is only valid in system-wide mode.
- -n, --null
- null run - don't start any counters
- -v, --verbose
- be more verbose (show counter open errors, etc)
- -x SEP, --field-separator SEP
- print counts using a CSV-style output to make it easy to import directly into spreadsheets. Columns are separated by the string specified in SEP.
- -G name, --cgroup name
- monitor only in the container (cgroup) called "name". This option is available only in per-cpu mode. The cgroup filesystem must be mounted. All threads belonging to container "name" are monitored when they run on the monitored CPUs. Multiple cgroups can be provided. Each cgroup is applied to the corresponding event, i.e., first cgroup to first event, second cgroup to second event and so on. It is possible to provide an empty cgroup (monitor all the time) using, e.g., -G foo,,bar. Cgroups must have corresponding events, i.e., they always refer to events defined earlier on the command line.
- -o file, --output file
- Print the output into the designated file.
- --append
- Append to the output file designated with the -o option. Ignored if -o is not specified.
- --log-fd
- Log output to fd, instead of stderr. Complementary to --output, and mutually exclusive with it. --append may be used here. Examples: 3>results perf stat --log-fd 3 - $cmd 3>>results perf stat --log-fd 3 --append - $cmd
$ perf stat - make -j
See Also Referenced By perf (1), perf-record (1), perf-report (1) perf-record(1) - Linux man page Name
8117.370256 task clock ticks # 11.281 CPU utilization factor 678 context switches # 0.000 M/sec 133 CPU migrations # 0.000 M/sec 235724 pagefaults # 0.029 M/sec 24821162526 CPU cycles # 3057.784 M/sec 18687303457 instructions # 2302.138 M/sec 172158895 cache references # 21.209 M/sec 27075259 cache misses # 3.335 M/secperf-record - Run a command and record its profile into perf.data
Synopsisperf record [-e <EVENT> | --event=EVENT] [-l] [-a] <command> perf record [-e <EVENT> | --event=EVENT] [-l] [-a] - <command> [<options>]DescriptionThis command runs a command and gathers a performance counter profile from it, into perf.data - without displaying anything.
This file can then be inspected later on, using perf report .
Options<command>...
See Also Referenced By perf (1), perf-annotate (1), perf-archive (1), perf-buildid-cache (1), perf-buildid-list (1), perf-diff (1), perf-evlist (1), perf-inject (1), perf-kmem (1), perf-kvm (1), perf-probe (1), perf-sched (1), perf-script (1), perf-timechart (1)
- Any command you can specify in a shell.
- -e, --event=
- Select the PMU event. Selection can be a symbolic event name (use perf list to list all events) or a raw PMU event (eventsel+umask) in the form of rNNN where NNN is a hexadecimal event descriptor.
- --filter=<filter>
- Event filter.
- -a, --all-cpus
- System-wide collection from all CPUs.
- -l
- Scale counter values.
- -p, --pid=
- Record events on existing process ID (comma separated list).
- -t, --tid=
- Record events on existing thread ID (comma separated list).
- -u, --uid=
- Record events in threads owned by uid. Name or number.
- -r, --realtime=
- Collect data with this RT SCHED_FIFO priority.
- -D, --no-delay
- Collect data without buffering.
- -A, --append
- Append to the output file to do incremental profiling.
- -f, --force
- Overwrite existing data file. (deprecated)
- -c, --count=
- Event period to sample.
- -o, --output=
- Output file name.
- -i, --no-inherit
- Child tasks do not inherit counters.
- -F, --freq=
- Profile at this frequency.
- -m, --mmap-pages=
- Number of mmap data pages. Must be a power of two.
- -g, --call-graph
- Do call-graph (stack chain/backtrace) recording.
- -q, --quiet
- Don't print any message, useful for scripting.
- -v, --verbose
- Be more verbose (show counter open errors, etc).
- -s, --stat
- Per thread counts.
- -d, --data
- Sample addresses.
- -T, --timestamp
- Sample timestamps. Use it with perf report -D to see the timestamps, for instance.
- -n, --no-samples
- Don't sample.
- -R, --raw-samples
- Collect raw sample records from all opened counters (default for tracepoint counters).
- -C, --cpu
- Collect samples only on the list of CPUs provided. Multiple CPUs can be provided as a comma-separated list with no space: 0,1. Ranges of CPUs are specified with -: 0-2. In per-thread mode with inheritance mode on (default), samples are captured only when the thread executes on the designated CPUs. Default is to monitor all CPUs.
- -N, --no-buildid-cache
- Do not update the builid cache. This saves some overhead in situations where the information in the perf.data file (which includes buildids) is sufficient.
- -G name,..., --cgroup name,...
- monitor only in the container (cgroup) called "name". This option is available only in per-cpu mode. The cgroup filesystem must be mounted. All threads belonging to container "name" are monitored when they run on the monitored CPUs. Multiple cgroups can be provided. Each cgroup is applied to the corresponding event, i.e., first cgroup to first event, second cgroup to second event and so on. It is possible to provide an empty cgroup (monitor all the time) using, e.g., -G foo,,bar. Cgroups must have corresponding events, i.e., they always refer to events defined earlier on the command line.
- -b, --branch-any
- Enable taken branch stack sampling. Any type of taken branch may be sampled. This is a shortcut for --branch-filter any. See --branch-filter for more infos.
- -j, --branch-filter
- Enable taken branch stack sampling. Each sample captures a series of consecutive taken branches. The number of branches captured with each sample depends on the underlying hardware, the type of branches of interest, and the executed code. It is possible to select the types of branches captured by enabling filters. The following filters are defined:
- Б─╒ any: any type of branches
- Б─╒ any_call: any function call or system call
- Б─╒ any_ret: any function return or system call return
- Б─╒ ind_call: any indirect branch
- Б─╒ u: only when the branch target is at the user level
- Б─╒ k: only when the branch target is in the kernel
- Б─╒ hv: only when the target is at the hypervisor level
- The option requires at least one branch type among any, any_call, any_ret, ind_call. The privilege levels may be ommitted, in which case, the privilege levels of the associated event are applied to the branch filter. Both kernel (k) and hypervisor (hv) privilege levels are subject to permissions. When sampling on multiple events, branch stack sampling is enabled for all the sampling events. The sampled branch type is the same for all events. The various filters must be specified as a comma separated list: --branch-filter any_ret,u,k Note that this feature may not be available on all processors.
Oct 14, 2017 | www.collabora.com
Posted on 21/03/2017 by Gabriel Krisman Bertazi
Dynamic profilers are tools to collect data statistics about applications while they are running, with minimal intrusion on the application being observed.
The kind of data that can be collected by profilers varies deeply, depending on the requirements of the user. For instance, one may be interested in the amount of memory used by a specific application, or maybe the number of cycles the program executed, or even how long the CPU was stuck waiting for data to be fetched from the disks. All this information is valuable when tracking performance issues, allowing the programmer to identify bottlenecks in the code, or even to learn how to tune an application to a specific environment or workload.
In fact, maximizing performance or even understanding what is slowing down your application is a real challenge on modern computer systems. A modern CPU carries so many hardware techniques to optimize performance for the most common usage case, that if an application doesn't intentionally exploit them, or worse, if it accidentally lies in the special uncommon case, it may end up experiencing terrible results without doing anything apparently wrong.
Let's take a quite non-obvious way of how things can go wrong, as an example.
Forcing branch mispredictionsBased on the example from here .
The code below is a good example of how non-obvious performance assessment can be. In this function, the first for loop initializes a vector of size n with random values ranging from 0 to N. We can assume the values are well distributed enough for the vector elements to be completely unsorted.
The second part of the code has a for loop nested inside another one. The outer loop, going from 0 to K, is actually a measurement trick. By executing the inner loop many times, it stresses out the performance issues in that part of the code. In this case, it helps to reduce any external factor that may affect our measurement.
The inner loop is where things get interesting. This loop crawls over the vector and decides whether the value should be accumulated in another variable, depending on whether the element is higher than N/2 or not. This is done using an if clause, which gets compiled into a conditional branch instruction, which modifies the execution flow depending on the calculated value of the condition, in this case, if vec[i] >= N/2, it will enter the if leg, otherwise it will skip it entirely.
long rand_partsum(int n)
{
  int i,k;
  long sum = 0;
  int *vec = malloc(n * sizeof(int));

  for (i = 0; i < n; i++)
    vec[i] = rand()%n;

  for (k = 0; k < 1000000; k++)
    for (i = 0; i < n; i++)
      if (vec[i] > n/2)
        sum += vec[i];

  return sum;
}
When executing the code above on an Intel Core i7-5500U, with a vector size of 5000 elements (N=5000), it takes an average of 29.97 seconds. Can we do any better?One may notice that this vector is unsorted, since each element comes from a call to rand(). What if we sorted the vector before executing the second for loop? For the sake of the example, let's say we add a call to the glibc implementation of QuickSort right after the initialization loop.
A naive guess would suggest that the algorithm got worse, because we just added a new sorting step, thus raising the complexity of the entire code. One should assume this would result on a higher execution time.
But, in fact, when executing the sorted version in the same machine, the average execution time drops to 13.20 seconds, which is a reduction of 56% in execution time. Why does adding a new step actually reduces the execution time? The fact is that pre-sorting the vector in this case, allows the cpu to do a much better job at internally optimizing the code during execution. In this case, the issue observed was a high number of branch mispredictions, which were triggered by the conditional branch that implements the if clause.
Modern CPUs have quite deep pipelines, meaning that the instruction being fetched on any given cycle is always a few instructions down the road than the instruction actually executed on that cycle. When there is a conditional branch along the way, there are two possible paths that can be followed, and the prefetch unit has no idea which one it should choose, until all the actual condition for that instruction is calculated.
The obvious choice for the Prefetch unit on such cases is to stall and wait until the execution unit decides the correct path to follow, but stalling the pipeline like this is very costly. Instead, a speculative approach can be taken by a unit called Branch Predictor, which tries to guess which path should be taken. After the condition is calculated, the CPU verifies the guessed path: if it got the prediction right, in other words, if a branch prediction hit occurs, the execution just continues without much performance impact, but if it got it wrong, the processor needs to flush the entire pipeline, go back, and restart executing the correct path. The later is called a branch prediction miss, and is also a costly operation.
In systems with a branch predictor, like any modern CPU, the predictor is usually based on the history of the particular branches. If a conditional branch usually goes a specific way, the next time it appears, the predictor will assume it will take the same route.
Back to our example code, that if condition inside the for loop does not have any specific pattern. Since the vector elements are completely random, sometimes it will enter the if leg, sometimes it will skip it entirely. That is a very hard situation for the branch predictor, who keeps guessing wrong and triggering flushes in the pipeline, which keeps delaying the application.
In the sorted version, instead, it is very easy to guess whether it should enter the if leg or not. For the first part of the vector, where the elements are mostly < N/2, the if leg will always be skipped, while for the second part, it will always enter the if leg. The branch predictor is capable of learning this pattern after a few iterations, and is able to do much better guesses about the flow, reducing the number of branch misses, thus increasing the overall performance.
Well, pointing specific issues like this is usually hard, even for a simple code like the example above. How could we be sure that the the program is hitting enough branch mispredictions to affect performance? In fact, there are always many things that could be the cause of slowness, even for a slightly more complex program.
Perf_events is an interface in the Linux kernel and a userspace tool to sample hardware and software performance counters. It allows, among many other things, to query the CPU register for the statistics of the branch predictor, i.e. the number of prediction hits and misses of a given application.
The userspace tool, known as the perf command, is available in the usual channels of common distros. In Debian, for instance, you can install it with:
We'll dig deeper into the perf tool later on another post, but for now, let's use the, perf record and perf annotate commands, which allow tracing the program and annotating the source code with the time spent on each instruction, and the perf stat command, which allows to run a program and display statistics about it:
At first, we can instruct perf to instrument the program and trace its execution:
The perf record will execute the program passed as parameter and collect performance information into a new perf.data file. This file can then be passed to other perf commands. In this case, we pass it to the perf annotate command, which crawls over each address in the program and prints the number of samples that was collected while the program was executing each instruction. Instructions with a higher number of samples indicates that the program spent more time in that region, indicating that it is hot code, and a good part of the program to try to optimize. Notice that, for modern processors, the exact position is an estimation, so this information must be used with care. As a rule of thumb, one should be looking for hot regions, instead of single hot instructions.Below is the output of perf annotate, when analyzing the function above. The output is truncated to display only the interesting parts.
[krisman@dilma bm]$ perf annotate

        :
        :      int rand_partsum()
        :      {
   0.00 :        74e:   push   %rbp
   0.00 :        74f:   mov    %rsp,%rbp
   0.00 :        752:   push   %rbx
   0.00 :        753:   sub    $0x38,%rsp
   0.00 :        757:   mov    %rsp,%rax
   0.00 :        75a:   mov    %rax,%rbx

   [...]

   0.00 :        7ce:   mov    $0x0,%edi
   0.00 :        7d3:   callq  5d0 <time@plt>
   0.00 :        7d8:   mov    %eax,%edi
   0.00 :        7da:   callq  5c0 <srand@plt>
        :              for (i = 0; i < n; i++)
   0.00 :        7df:   movl   $0x0,-0x14(%rbp)
   0.00 :        7e6:   jmp    804 <main+0xb6>
        :                      vec[i] = rand()%n;
   0.00 :        7e8:   callq  5e0 <rand@plt>
   0.00 :        7ed:   cltd
   0.00 :        7ee:   idivl  -0x24(%rbp)
   0.00 :        7f1:   mov    %edx,%ecx
   0.00 :        7f3:   mov    -0x38(%rbp),%rax
   0.00 :        7f7:   mov    -0x14(%rbp),%edx
   0.00 :        7fa:   movslq %edx,%rdx
   0.00 :        7fd:   mov    %ecx,(%rax,%rdx,4)
        :              for (i = 0; i < n; i++)
   0.00 :        800:   addl   $0x1,-0x14(%rbp)
   0.00 :        804:   mov    -0x14(%rbp),%eax
   0.00 :        807:   cmp    -0x24(%rbp),%eax
   0.00 :        80a:   jl     7e8 <main+0x9a>

   [...]

         :              for (k = 0; k < 1000000; k++)
    0.00 :        80c:   movl   $0x0,-0x18(%rbp)
    0.00 :        813:   jmp    85e <main+0x110>
         :                      for (i = 0; i < n; i++)
    0.01 :        815:   movl   $0x0,-0x14(%rbp)
    0.00 :        81c:   jmp    852 <main+0x104>
         :                              if (vec[i] > n/2)
    0.20 :        81e:   mov    -0x38(%rbp),%rax
    6.47 :        822:   mov    -0x14(%rbp),%edx
    1.94 :        825:   movslq %edx,%rdx
   26.86 :        828:   mov    (%rax,%rdx,4),%edx
    0.08 :        82b:   mov    -0x24(%rbp),%eax
    1.46 :        82e:   mov    %eax,%ecx
    0.62 :        830:   shr    $0x1f,%ecx
    3.82 :        833:   add    %ecx,%eax
    0.06 :        835:   sar    %eax
    0.70 :        837:   cmp    %eax,%edx
    0.42 :        839:   jle    84e <main+0x100>
         :                                      sum += vec[i];
    9.15 :        83b:   mov    -0x38(%rbp),%rax
    5.91 :        83f:   mov    -0x14(%rbp),%edx
    0.26 :        842:   movslq %edx,%rdx
    5.87 :        845:   mov    (%rax,%rdx,4),%eax
    2.09 :        848:   cltq
    9.31 :        84a:   add    %rax,-0x20(%rbp)
         :                      for (i = 0; i < n; i++)
   16.66 :        84e:   addl   $0x1,-0x14(%rbp)
    6.46 :        852:   mov    -0x14(%rbp),%eax
    0.00 :        855:   cmp    -0x24(%rbp),%eax
    1.63 :        858:   jl     81e <main+0xd0>
         :              for (k = 0; k < 1000000; k++)

   [...]
The first thing to notice is that the perf command tries to interleave C code with the Assembly code. This feature requires compiling the test program with -g3 to include debug information.
The number before the ':' is the percentage of samples collected while the program was executing each instruction. Once again, this is not an exact information, so you should be looking for hot regions, and not specific instructions.
The first and second hunk are the function prologue, which was executed only once, and the vector initialization. According to the profiling data, there is little point in attempting to optimize them, because the execution practically didn't spend any time on it. The third hunk is the second loop, where it spent almost all the execution time. Since that loop is where most of our samples where collected, we can assume that it is a hot region, which we can try to optimize. Also, notice that most of the samples were collected around that if leg. This is another indication that we should look into that specific code.
To find out what might be causing the slowness, we can use the perf stat command, which prints a bunch of performance counters information for the entire program. Let's take a look at its output.
[krisman@dilma bm]$ perf stat ./branch-miss.unsorted

 Performance counter stats for './branch-miss.unsorted:

    29876.773720  task-clock (msec) #    1.000 CPUs utilized
              25  context-switches  #    0.001 K/sec
               0  cpu-migrations    #    0.000 K/sec
              49  page-faults       #    0.002 K/sec
  86,685,961,134  cycles            #    2.901 GHz
  90,235,794,558  instructions      #    1.04  insn per cycle
  10,007,460,614  branches          #  334.958 M/sec
   1,605,231,778  branch-misses     #   16.04% of all branches

   29.878469405 seconds time elapsed
Perf stat will dynamically profile the program passed in the command line and report back a number of statistics about the entire execution. In this case, let's look at the 3 last lines in the output. The first one gives the rate of instructions executed per CPU cycle; the second line, the total number of branches executed; and the third, the percentage of those branches that resulted in a branch miss and pipeline flush.Perf is even nice enough to put important or unexpected results in red. In this case, the last line, Branch-Misses, was unexpectedly high, thus it was displayed in red in this test.
And now, let's profile the pre-sorted version. Look at the number of branch misses:
[krisman@dilma bm]$ perf stat ./branch-miss.sorted

 Performance counter stats for './branch-miss.sorted:

    14003.066457  task-clock (msec) #    0.999 CPUs utilized
             175  context-switches  #    0.012 K/sec
               4  cpu-migrations    #    0.000 K/sec
              56  page-faults       #    0.004 K/sec
  40,178,067,584  cycles            #    2.869 GHz
  89,689,982,680  instructions      #    2.23  insn per cycle
  10,006,420,927  branches          #  714.588 M/sec
       2,275,488  branch-misses     #    0.02% of all branches

  14.020689833 seconds time elapsed
It went down from over 16% to just 0.02% of the total branches! This is very impressive and is likely to explain the reduction in execution time. Another interesting value is the number of instructions per cycle, which more than doubled. This happens because, once we reduced the number of stalls, we make better use of the pipeline, obtaining a better instruction throughput. Wrapping upAs demonstrated by the example above, figuring out the root cause of a program slowness is not always easy. In fact, it gets more complicated every time a new processor comes out with a bunch of shiny new optimizations.
Despite being a short example code, the branch misprediction case is still quite non-trivial for anyone not familiar with how the branch prediction mechanism works. In fact, if we just look at the algorithm, we could have concluded that adding a sort algorithm would just add more overhead to the algorithm. Thus, this example gives us a high-level view of how helpful profiling tools really are. By using just one of the several features provided by the perf tool, we were able to draw major conclusions about the program being examined.
Comments (10)Performance analysis in Linux (continued)
Alan:
sum += n[i];
Apr 03, 2017 at 11:46 AM
should be
sum += vec[i];
![]()
Krisman:
Thanks Alan. That's correct, I've fixed it now.
Apr 03, 2017 at 01:47 PM![]()
Arvin :
Thank you for the excellent write-up, Krisman. For those following along, I was able to grab perf for my current kernel on Ubuntu with the following command: sudo apt install linux-tools-`uname -r`
Apr 03, 2017 at 06:08 PMI was amazed at how well the -O3 compiler option was over -O2 and below with the unsorted code (-O2, -O1, and without were pretty much the same interestingly enough).
Is this essentially doing under-the-hood what the sorted code is doing? Or is the compiler using other tricks to drastically improve performance here? Thanks again!
![]()
krisman:
The compiler is likely not sorting the vector, because it can't be sure such transformation would be correct or even helpful. But, which optimization it actually applies when increasing the optimization level depends on the compiler you have and which exact version you used. It may try, for instance, unrolling the loop
Apr 03, 2017 at 08:03 PM
to use more prediction slots, though I don't think it would make a difference here.A higher optimization level could also eliminate that outer loop, should it conclude it is useless for calculating the overall sum. To find out what happened in your
case, you might wish to dump the binary with a tool like objdump and checkout the generated assembly for clues.gcc -O3 main.c -o branch-miss
objdump -D branch-miss | lessIn my system, when compiling with -O3, gcc was able to optimize that inner loop with vector instructions, which eliminated most of the branch misses.
In the second perf stat you shared, you can see that the result was similar, it drastically reduced the number of branch misses, resulting in an increase of the instructions per cycle rate.
Arvin:
Interesting, thanks! I'll keep playing with it. I was also curious how clang compared. Same number of branch misses, but many more instructions! Notable increase in execution time.
Apr 03, 2017 at 10:17 PMAll in all, this was fun and I learned something new today :)
Anon:
The optimisation change that flattens the results is explained in the most popular stack overflow answer ever: http://stackoverflow.com/a/11227902
Apr 06, 2017 at 07:50 AMThomas:
Nice post, thanks for sharing.
Apr 03, 2017 at 06:39 PM
The return type of rand_partsum() should be long though to match the variable sum.
krisman:
Thanks! fixed that as well.
Apr 03, 2017 at 08:05 PM![]()
Solerman Kaplon:
how does the perf annotate looks like in the sort version? I'm curious how the cpu would understand that the data is sorted, never heard of such a thing
Apr 03, 2017 at 08:56 PM
![]()
krisman:
Hi Solerman,
Apr 04, 2017 at 01:42 AMIt's not that the CPU understands the data is sorted, it doesn't. Instead, we use the knowledge acquired with perf to assemble the data in a specific way to explore the characteristics of the processor.
In this case, we prepared the data in a way that made the conditional branch taken by the 'if' clause predictable for a history-based branch predictor, like the ones in modern cpus. By sorting the data, we ensure the first part of the array will always skip the 'if' leg, while the second part will always enter the 'if' leg. There might still be branch misses, when entering the vector and when switching from the first part of the vector to the second, for instance. But those branch misses are
negligible since, by puting some order in the data, we ensured the vast majority of iterations won't trigger mispredictions.The expectation for the perf annotation of the optimized version would be a more even distribution of samples along the program code. If we only have this function alone in our program, it's likely that most samples will still be in the nested loops since that is, by far, the hottest path in our simple program. But
even then, the optimized version may still have a slightly better distribution of samples, since we don't waste too much time stalled on that conditional branch. In the article example, perf annotate allowed us to isolate the region that made the most sense trying to optimize, which are always the parts where the execution
spends most time.06/10/2017
In this post, I will show one more example of how easy it is to disrupt performance of a modern CPU, and also run a quick discussion on
XDC 2017 - Links to recorded presentations (videos)23/09/2017
Many thanks to Google for recording all the XDC2017 talks. To make them easier to watch, here are direct links to each talk recorded at
DebConf 17: Flatpak and Debian17/08/2017
Last week, I attended DebConf 17 in Montréal, returning to DebConf for the first time in 10 years (last time was DebConf 7 in Edinburgh).
Android: NXP i.MX6 on Etnaviv Update24/07/2017
More progress is being made in the area of i.MX6, etnaviv and Android. Since the last post a lot work has gone into upstreaming and stabilizing
vkmark: more than a Vulkan benchmark18/07/2017
Ever since Vulkan was announced a few years ago, the idea of creating a Vulkan benchmarking tool in the spirit of glmark2 had been floating
Quick hack: Performance debugging Linux graphics on Mesa29/06/2017
Debugging graphics performance in a simple and high-level manner is possible for all Gallium based Mesa drivers using GALLIUM_HUD, a feature About Collabora
Whether writing a line of code or shaping a longer-term strategic software development plan, we'll help you navigate the ever-evolving world of Open Source.
Google matched content |
Society
Groupthink : Two Party System as Polyarchy : Corruption of Regulators : Bureaucracies : Understanding Micromanagers and Control Freaks : Toxic Managers : Harvard Mafia : Diplomatic Communication : Surviving a Bad Performance Review : Insufficient Retirement Funds as Immanent Problem of Neoliberal Regime : PseudoScience : Who Rules America : Neoliberalism : The Iron Law of Oligarchy : Libertarian Philosophy
Quotes
War and Peace : Skeptical Finance : John Kenneth Galbraith :Talleyrand : Oscar Wilde : Otto Von Bismarck : Keynes : George Carlin : Skeptics : Propaganda : SE quotes : Language Design and Programming Quotes : Random IT-related quotes : Somerset Maugham : Marcus Aurelius : Kurt Vonnegut : Eric Hoffer : Winston Churchill : Napoleon Bonaparte : Ambrose Bierce : Bernard Shaw : Mark Twain Quotes
Bulletin:
Vol 25, No.12 (December, 2013) Rational Fools vs. Efficient Crooks The efficient markets hypothesis : Political Skeptic Bulletin, 2013 : Unemployment Bulletin, 2010 : Vol 23, No.10 (October, 2011) An observation about corporate security departments : Slightly Skeptical Euromaydan Chronicles, June 2014 : Greenspan legacy bulletin, 2008 : Vol 25, No.10 (October, 2013) Cryptolocker Trojan (Win32/Crilock.A) : Vol 25, No.08 (August, 2013) Cloud providers as intelligence collection hubs : Financial Humor Bulletin, 2010 : Inequality Bulletin, 2009 : Financial Humor Bulletin, 2008 : Copyleft Problems Bulletin, 2004 : Financial Humor Bulletin, 2011 : Energy Bulletin, 2010 : Malware Protection Bulletin, 2010 : Vol 26, No.1 (January, 2013) Object-Oriented Cult : Political Skeptic Bulletin, 2011 : Vol 23, No.11 (November, 2011) Softpanorama classification of sysadmin horror stories : Vol 25, No.05 (May, 2013) Corporate bullshit as a communication method : Vol 25, No.06 (June, 2013) A Note on the Relationship of Brooks Law and Conway Law
History:
Fifty glorious years (1950-2000): the triumph of the US computer engineering : Donald Knuth : TAoCP and its Influence of Computer Science : Richard Stallman : Linus Torvalds : Larry Wall : John K. Ousterhout : CTSS : Multix OS Unix History : Unix shell history : VI editor : History of pipes concept : Solaris : MS DOS : Programming Languages History : PL/1 : Simula 67 : C : History of GCC development : Scripting Languages : Perl history : OS History : Mail : DNS : SSH : CPU Instruction Sets : SPARC systems 1987-2006 : Norton Commander : Norton Utilities : Norton Ghost : Frontpage history : Malware Defense History : GNU Screen : OSS early history
Classic books:
The Peter Principle : Parkinson Law : 1984 : The Mythical Man-Month : How to Solve It by George Polya : The Art of Computer Programming : The Elements of Programming Style : The Unix Hater’s Handbook : The Jargon file : The True Believer : Programming Pearls : The Good Soldier Svejk : The Power Elite
Most popular humor pages:
Manifest of the Softpanorama IT Slacker Society : Ten Commandments of the IT Slackers Society : Computer Humor Collection : BSD Logo Story : The Cuckoo's Egg : IT Slang : C++ Humor : ARE YOU A BBS ADDICT? : The Perl Purity Test : Object oriented programmers of all nations : Financial Humor : Financial Humor Bulletin, 2008 : Financial Humor Bulletin, 2010 : The Most Comprehensive Collection of Editor-related Humor : Programming Language Humor : Goldman Sachs related humor : Greenspan humor : C Humor : Scripting Humor : Real Programmers Humor : Web Humor : GPL-related Humor : OFM Humor : Politically Incorrect Humor : IDS Humor : "Linux Sucks" Humor : Russian Musical Humor : Best Russian Programmer Humor : Microsoft plans to buy Catholic Church : Richard Stallman Related Humor : Admin Humor : Perl-related Humor : Linus Torvalds Related humor : PseudoScience Related Humor : Networking Humor : Shell Humor : Financial Humor Bulletin, 2011 : Financial Humor Bulletin, 2012 : Financial Humor Bulletin, 2013 : Java Humor : Software Engineering Humor : Sun Solaris Related Humor : Education Humor : IBM Humor : Assembler-related Humor : VIM Humor : Computer Viruses Humor : Bright tomorrow is rescheduled to a day after tomorrow : Classic Computer Humor
The Last but not Least Technology is dominated by two types of people: those who understand what they do not manage and those who manage what they do not understand ~Archibald Putt. Ph.D
Copyright © 1996-2021 by Softpanorama Society. www.softpanorama.org was initially created as a service to the (now defunct) UN Sustainable Development Networking Programme (SDNP) without any remuneration. This document is an industrial compilation designed and created exclusively for educational use and is distributed under the Softpanorama Content License. Original materials copyright belong to respective owners. Quotes are made for educational purposes only in compliance with the fair use doctrine.
FAIR USE NOTICE This site contains copyrighted material the use of which has not always been specifically authorized by the copyright owner. We are making such material available to advance understanding of computer science, IT technology, economic, scientific, and social issues. We believe this constitutes a 'fair use' of any such copyrighted material as provided by section 107 of the US Copyright Law according to which such material can be distributed without profit exclusively for research and educational purposes.
This is a Spartan WHYFF (We Help You For Free) site written by people for whom English is not a native language. Grammar and spelling errors should be expected. The site contain some broken links as it develops like a living tree...
|
|
You can use PayPal to to buy a cup of coffee for authors of this site |
Disclaimer:
The statements, views and opinions presented on this web page are those of the author (or referenced source) and are not endorsed by, nor do they necessarily reflect, the opinions of the Softpanorama society. We do not warrant the correctness of the information provided or its fitness for any purpose. The site uses AdSense so you need to be aware of Google privacy policy. You you do not want to be tracked by Google please disable Javascript for this site. This site is perfectly usable without Javascript.
Last modified: December, 26, 2017