|
|
Home | Switchboard | Unix Administration | Red Hat | TCP/IP Networks | Neoliberalism | Toxic Managers |
| (slightly skeptical) Educational society promoting "Back to basics" movement against IT overcomplexity and bastardization of classic Unix | |||||||
| Jan | Feb | Mar | Apr | May | June | July | Aug | Sep | Oct | Nov | Dec |
|
|
|
|
Yahoo! Finance
Investing in a 401(k) plan allows you to defer paying income tax on the money you save for retirement, helps automate your decision to save for retirement by having the money withheld from your paycheck and often allows workers to get valuable employer contributions. However, investing in a 401(k) plan isn't always worth it, especially if your plan has high fees, poor investment choices and no employer contributions. Here's how to tell if your employer is providing a subpar 401(k) plan:
No immediate eligibility. Ideally, you should start saving in a 401(k) plan with your first paycheck, but many employers won't let you. Only 54 percent of 401(k) plans offer immediate eligibility, according to a recent Vanguard analysis of 2,000 401(k) plans with 3 million participants. And 16 percent of 401(k) plans require workers to be with the company for an entire year before they are able to put their money in the plan. "It's sort of a legacy of when record keeping was more manual," says Jean Young, a senior research analyst for the Vanguard Center for Retirement Research. "You want to make sure that somebody is going to be with your organization before you enroll them."
[Read: 10 Trendy 401(k) Plan Perks.]
No employer contributions. Most Vanguard 401(k) plans (91 percent) offer an employer contribution. The best 401(k) plans immediately provide employer contributions to workers, but the majority of 401(k) plans impose a waiting period before new employees are eligible for a match or other company contributions. Many 401(k) plans require between one and six months (27 percent) or even an entire year of service (28 percent) before employees become eligible for a 401(k) match.
A very small match. The maximum possible match employees can get is a median of 3 percent of pay among all Vanguard 401(k) plans. The bottom quarter (24 percent) of 401(k) plans offer a maximum possible employer match of less than 3 percent. The top 15 percent of plans provide employer matches worth 6 percent or more of pay.
A match that is difficult to take advantage of. Employer contributions vary considerably by employer, with Vanguard alone administering 401(k)s with more than 200 different match formulas. Almost half (48 percent) of 401(k) plans require employees to contribute 6 percent of their pay to the 401(k) plan to capture the maximum possible 401(k) match. Other employers require workers to save between 3 and 5 percent of pay (37 percent) or at least 7 percent (11 percent) to get the entire match offered.
The exact match formula plays a role in how easy it is for employees to actually take advantage of company 401(k) contributions. The most common 401(k) match is 50 cents for each dollar contributed up to 6 percent of pay, and 24 percent of 401(k) plans use this match formula. Another 14 percent of 401(k) plans offer a multi-tier match formula such as $1 for each dollar saved on the first 3 percent of pay and 50 cents for every dollar contributed on the next 2 percent of pay. And 7 percent of plans cap the maximum amount of employer contributions workers can get.
Match formulas have the biggest impact on workers who can only afford to save a small amount. Consider a worker who is able to save 3 percent of her salary in a 401(k) plan. If her employer matches 50 cents for each dollar contributed up to 6 percent of pay, she would get 1.5 percent of her pay as a 401(k) match instead of the maximum possible match of 3 percent. If her employer instead matched dollar for dollar the first 3 percent of pay, she would be able to take advantage of the entire match offered with the same maximum potential cost to her company.
[Read: 10 Things You Should Know About Your 401(k) Plan.]
No nonmatching contributions. Some employers contribute to a 401(k) plan on behalf of employees without them having to save anything on their own, contributing a median of 4.2 percent of pay. The most generous 401(k) plans (16 percent) provide employer contributions worth 10 percent or more of worker salaries.
Long vesting schedule. Employees who leave a job before they are vested in the 401(k) plan could forfeit some or all of their employer's contributions. Only 44 percent of 401(k) plans offer immediate vesting, which means you will get to keep all of your employer's contributions whenever you leave the company. Some 401(k)s have cliff vesting schedules in which you don't get to keep any of your employer's 401(k) contributions until you have been employed by the company for a specific number of years. "If you are likely to change jobs a lot because of the nature of your career, and the company has a generous match but that is subject to a three- or five-year cliff vesting schedule, it's not likely to benefit you," says David Loeper, author of "Stop the Retirement Rip-off: How to Avoid Hidden Fees and Keep More of Your Money." Other employers have graded vesting schedules in which you get to keep a gradually increasing proportion of your employer's contributions based on your years of service - typically getting to keep the entire 401(k) match only after five or six years of service. "The employer doesn't want to invest in the employee and then have the employee up and take off," says Christopher Carosa, a retirement plan consultant and chief contributing editor of FiduciaryNews.com. "From the employee's standpoint, it's better to have immediate vesting."
Poor investment choices. The average Vanguard 401(k) plan offered 27 investment options in 2012, up from 16 in 2003, many of which were recently added target-date funds. "If you have more than 20 options it's probably not going to be a user-friendly plan," Carosa says. "It's going to put too much of the burden of deciding what to invest in on the employee." However, almost half of Vanguard 401(k) plans now offer at least four low-cost index funds that invest in U.S. equities, international equities, bonds and cash, up from a quarter in 2004. "The index core is going to have the lowest cost typically, and costs have been demonstrated to be very important in terms of predicting future outcomes," Young says.
[Read: 10 Secrets of Successful Retirement Savers.]
High fees. Most 401(k) plans charge a variety of fees ranging from record-keeping costs to expense ratios on each investment option. You want to make sure that the expenses aren't excessively high. "An easy to remember rule of thumb is to look and see who is selling the fund to the plan. If the fund is being sold by a broker or an insurance company that is working in a non-fiduciary capacity there is a good chance that you will have these excess fees," Carosa says. "You want to make sure that none of the options in the plan have 12b-1 fees or revenue sharing."
401(k) plans are now required to give all investors information explaining the fees associated with each investment option in the plan, due to new U.S. Department of Labor rules. Make sure you look at these quarterly and annual 401(k) statements, and keep costs in mind when making investment decisions. "The fee is 100 percent certain; the return is not guaranteed," Loeper says. He recommends aiming to pay no more than 75 basis points for most investments, and less than 20 basis points for index funds. "If you are paying more than three-quarters of a point," he says, "somebody is making excess profits or is gambling with your money."
whenever the average price of a gallon of gasoline in the U.S. has risen above $3.80 during the past three years, a stock market decline has always followed.
#4 New home prices just experienced their largest two month drop since Lehman Brothers collapsed.
#5 During the last financial crisis, the mortgage delinquency rate rose dramatically. It is starting to happen again.
#6 Prior to the financial crisis of 2008, there was a spike in the number of adjustable rate mortgages. It is happening again.
#7 Just before the last financial crisis, unemployment claims started skyrocketing. Well, initial claims for unemployment benefits are rising again. Once we hit the 400,000 level, we will officially be in the danger zone.
#8 Continuing claims for unemployment benefits just spiked to the highest level since early 2009.
#9 The yield on 10 year Treasuries is now up to 2.60 percent. We also saw the yield on 10 year U.S. Treasuries rise significantly during the first half of 2008.
#10 According to Zero Hedge, "whenever the annual change in core capex, also known as Non-Defense Capital Goods excluding Aircraft shipments goes negative, the US has traditionally entered a recession". Guess what? It is rapidly heading toward negative territory again.
#11 Average hourly compensation in the United States experienced its largest drop since 2009 during the first quarter of 2013.
#12 In the month of June, spending at restaurants fell by the most that we have seen since February 2008.
#13 Just before the last financial crisis, corporate earnings were very disappointing. Now it is happening again.
#14 Margin debt spiked just before the dot.com bubble burst, it spiked just before the financial crash of 2008, and now it is spiking again.
#15 During 2008, the price of gold fell substantially. Now it is happening again.
#16 Global business confidence is now the lowest that it has been since the last recession.
#17 Back in 2008, the U.S. national debt was rapidly rising to unsustainable levels. We are in much, much worse shape today.
#18 Prior to the last financial crisis, Federal Reserve Chairman Ben Bernanke assured the American people that home prices would not decline and that there would not be a recession. We all know what happened. Now he is once again promising that everything is going to be just fine.
"Minsky moment" -- a sudden fall in asset values bloated by credit.
Blackhalo
Cinco-X wrote:
Telegraphing your punches is almost always a bad idea.
The market is now the Fed's adversary? I think Ben's practice of giving the market at least 6 months notice, is one of the smarter things he does.
"Is the explanation as to why markets fell - a drop of 2% or worse is something that has happened literally 1000s of times previously - accurate? Was the 675th worst one day (2.34%) Dow selloff in history all about the Fed's taper of their bond purchases?"
Employers have long hoped that simpler 401(k) plans would entice more workers to save. But for more-savvy investors, that may not be good news.Many companies have pruned the number of investment options in their plans to keep workers from feeling overwhelmed by too much choice. General Motors Corp. and Delphi Corp., for instance, recently cut these options by nearly half. Meanwhile, other companies have loaded up their plans with a slew of target-date funds -- one-stop shopping for retirement savers -- while shrinking the variety of other funds.
But simple isn't always better. In paring choices, companies may be reducing workers' ability to diversify their assets, leaving them exposed to the downdrafts that sometimes roil stocks and bonds simultaneously.
|
|
Switchboard | ||||
| Latest | |||||
| Past week | |||||
| Past month | |||||
| 2014 | 2013 | 2012 | 2011 | 2010 | 2009 | 2008 | 2007 | 2006 |
"The US economy desperately needs less of our bloated, unproductive and increasingly parasitic banking system … The banking system has become an agent of destruction for the gross domestic product and of impoverishment for the middle class." David Stockman, |
|
| Government by organized money is just as dangerous as Government by organized mob.
FDR, 1936 "The trouble with capitalism is capitalists; they're too damn greedy." Herbert Hoover |
Employers have long hoped that simpler 401(k) plans would entice more workers to save. But for more-savvy investors, that may not be good news.Many companies have pruned the number of investment options in their plans to keep workers from feeling overwhelmed by too much choice. General Motors Corp. and Delphi Corp., for instance, recently cut these options by nearly half. Meanwhile, other companies have loaded up their plans with a slew of target-date funds -- one-stop shopping for retirement savers -- while shrinking the variety of other funds.
But simple isn't always better. In paring choices, companies may be reducing workers' ability to diversify their assets, leaving them exposed to the downdrafts that sometimes roil stocks and bonds simultaneously.
WSJ.com
Conventional wisdom usually advises older investors and retirees to balance a portfolio of bonds, stocks and annuities to squeeze the most from their savings during the third stage of life.
But recent events on Wall Street and in Washington, including a booming stock market and Federal Reserve warnings about "tapering" its easy-money policy, suggest those investors may need to junk conventional wisdom and think again.
... ... ...
Stocks may be too expensive, while bonds are likely to fall as the Fed pulls back and interest rates rise.
The best asset for many investors right now may simply be cash-money-market funds or short-term certificates of deposit. That's especially true for retirees, who rely on their low-risk investments for both income and capital preservation.
But rising stock prices produce risks as well as gains. At current levels, U.S. stocks offer a paltry dividend yield of just about 2.1%-meaning a retiree investing $100,000 in the S&P 500 will earn just $2,100 a year in dividends.
Stock prices are now at very high levels compared with average corporate earnings for the preceding decade, or compared with the replacement cost of corporate assets-two indicators that many economists note have in the past been very good predictors of stock-market returns. When shares have been this expensive on such measures in the past, they have usually turned out to be a poor investment.
The interest rates on bonds have picked up from the historic lows seen earlier this year, but they remain very low by long-term standards.
The 10-year Treasury note offers a yield of just 2.5%, and the Barclays index of corporate bonds isn't much better at 3.2%. Inflation-protected Treasury bonds are so expensive they offer a guaranteed loss of purchasing power for the next seven years.
The picture is little better for immediate annuities, insurance products that allow retirees to convert a lump sum into a guaranteed income stream for life. According to Hersh Stern, an industry expert and the head of ImmediateAnnuities.com, a comparison website, payout rates on annuities remain little improved on the record lows seen a few months ago.
Thomas Burke
Good job of telling the truth....the bond-equity conundrum makes things very challenging....I hold more cash today, both % and $$, than I have in years....taking a buy-on-weakness and DCA approach, on top of flight-to-quality and "don't fight the tape".
The above notwithstanding, the recent bail-out of bonds, coupled with the huge inflow to stock mutual funds, suggest some contrarian thinking might be in order.
Time for some additions to foreign, European, and emerging markets?
Irvine Mcquarrie
Holding individual T-Notes/Bonds is never a bad idea. As long as they're held to maturity, they can't "fall in value." You'll get 100% of your investment back. Holding T-Note/Bond mutual funds is another matter entirely, since whenever you need that money it could be worth less than what you paid in, much less.
Frank Dickof
Cash may be king......but your retirement kitty will get eaten up as it is earning ZERO return. Retirees need to take a long ball view of their funds. Split it into 3 buckets .....
1. Money you need in the next five years (cash or short term bond ladder maturing 1 to 5 years),
2. Money you need 5-10 years down the road (ETF's with about 75% bonds/25% stock balance),
3. Money needed greater than 10 years (ETF's almost all in stocks). For the last bucket you can dollar cost average into it over a year or so to smooth out the effects of the market. Rebalance as the years go by.
Gerard Muller
I don't think you've understood what this article was about.
The formulation you describe was just fine when bonds were providing historical returns and equities weren't being inflated artificially by an, admittedly, transient Fed policy. But as it is, if someone were to follow your prescription today they would be buying bonds whose current pathetic returns would be driven even lower when QE ends and equities whose value would also drop to an unsupported level. In other words they would likely lose their wealth big time.
The author's analysis is correct as things stand today. We are poised to soon see a return to un-stimulated economic times. What those times will look like is something that retirees should find more attractive than the bucket formulation you prescribe now, if they don't they'll at least have most of their, admittedly somewhat eroded, wealth intact.
James Drake
The Japanese experience of prolonged cheap money may well be our experience. In which case, planning to spend the principal and die broke a suitable option.
Michael H Mitchell
"if you assume a 5% return and 3% inflation " Key word there is ASSUME!!! If your assumption is wrong, and it could well be if the Fed bungles this unprecedented monetary expansion, 70's type inflation will kill you.
john boyer:
As a general rule of life I have said the longer you wait to make a decision the better. It gives me more time to wait for facts and information to come to me. We know for an almost certainty that bonds will fall. I am not so certain for stocks as they are not so monolithic as the bond market unless you go for an index fund or mutual fund. Having a pile of cash lets me sleep at night while I contemplate my next move. I have more control over my expenses so I know how quickly I will be bleeding out my cash. Investment decisions will be made but not just now. Though from almost any measure I could retire now I continue to work for a modest income as I know I may need it some day. Continuing to work does not cost me anything other than the chance to be simply idle. As has been posited by Mr. Taleb of Black Swan fame and Antifragile it is all about the cheapest option. Right now staying in cash seems to be the cheapest option for the highest return.
whenever the average price of a gallon of gasoline in the U.S. has risen above $3.80 during the past three years, a stock market decline has always followed.
#4 New home prices just experienced their largest two month drop since Lehman Brothers collapsed.
#5 During the last financial crisis, the mortgage delinquency rate rose dramatically. It is starting to happen again.
#6 Prior to the financial crisis of 2008, there was a spike in the number of adjustable rate mortgages. It is happening again.
#7 Just before the last financial crisis, unemployment claims started skyrocketing. Well, initial claims for unemployment benefits are rising again. Once we hit the 400,000 level, we will officially be in the danger zone.
#8 Continuing claims for unemployment benefits just spiked to the highest level since early 2009.
#9 The yield on 10 year Treasuries is now up to 2.60 percent. We also saw the yield on 10 year U.S. Treasuries rise significantly during the first half of 2008.
#10 According to Zero Hedge, "whenever the annual change in core capex, also known as Non-Defense Capital Goods excluding Aircraft shipments goes negative, the US has traditionally entered a recession". Guess what? It is rapidly heading toward negative territory again.
#11 Average hourly compensation in the United States experienced its largest drop since 2009 during the first quarter of 2013.
#12 In the month of June, spending at restaurants fell by the most that we have seen since February 2008.
#13 Just before the last financial crisis, corporate earnings were very disappointing. Now it is happening again.
#14 Margin debt spiked just before the dot.com bubble burst, it spiked just before the financial crash of 2008, and now it is spiking again.
#15 During 2008, the price of gold fell substantially. Now it is happening again.
#16 Global business confidence is now the lowest that it has been since the last recession.
#17 Back in 2008, the U.S. national debt was rapidly rising to unsustainable levels. We are in much, much worse shape today.
#18 Prior to the last financial crisis, Federal Reserve Chairman Ben Bernanke assured the American people that home prices would not decline and that there would not be a recession. We all know what happened. Now he is once again promising that everything is going to be just fine.
WSJ.com
Conventional wisdom usually advises older investors and retirees to balance a portfolio of bonds, stocks and annuities to squeeze the most from their savings during the third stage of life.
But recent events on Wall Street and in Washington, including a booming stock market and Federal Reserve warnings about "tapering" its easy-money policy, suggest those investors may need to junk conventional wisdom and think again.
... ... ...
Stocks may be too expensive, while bonds are likely to fall as the Fed pulls back and interest rates rise.
The best asset for many investors right now may simply be cash-money-market funds or short-term certificates of deposit. That's especially true for retirees, who rely on their low-risk investments for both income and capital preservation.
But rising stock prices produce risks as well as gains. At current levels, U.S. stocks offer a paltry dividend yield of just about 2.1%-meaning a retiree investing $100,000 in the S&P 500 will earn just $2,100 a year in dividends.
Stock prices are now at very high levels compared with average corporate earnings for the preceding decade, or compared with the replacement cost of corporate assets-two indicators that many economists note have in the past been very good predictors of stock-market returns. When shares have been this expensive on such measures in the past, they have usually turned out to be a poor investment.
The interest rates on bonds have picked up from the historic lows seen earlier this year, but they remain very low by long-term standards.
The 10-year Treasury note offers a yield of just 2.5%, and the Barclays index of corporate bonds isn't much better at 3.2%. Inflation-protected Treasury bonds are so expensive they offer a guaranteed loss of purchasing power for the next seven years.
The picture is little better for immediate annuities, insurance products that allow retirees to convert a lump sum into a guaranteed income stream for life. According to Hersh Stern, an industry expert and the head of ImmediateAnnuities.com, a comparison website, payout rates on annuities remain little improved on the record lows seen a few months ago.
Thomas Burke
Good job of telling the truth....the bond-equity conundrum makes things very challenging....I hold more cash today, both % and $$, than I have in years....taking a buy-on-weakness and DCA approach, on top of flight-to-quality and "don't fight the tape".
The above notwithstanding, the recent bail-out of bonds, coupled with the huge inflow to stock mutual funds, suggest some contrarian thinking might be in order.
Time for some additions to foreign, European, and emerging markets?
Irvine Mcquarrie
Holding individual T-Notes/Bonds is never a bad idea. As long as they're held to maturity, they can't "fall in value." You'll get 100% of your investment back. Holding T-Note/Bond mutual funds is another matter entirely, since whenever you need that money it could be worth less than what you paid in, much less.
Frank Dickof
Cash may be king......but your retirement kitty will get eaten up as it is earning ZERO return. Retirees need to take a long ball view of their funds. Split it into 3 buckets .....
1. Money you need in the next five years (cash or short term bond ladder maturing 1 to 5 years),
2. Money you need 5-10 years down the road (ETF's with about 75% bonds/25% stock balance),
3. Money needed greater than 10 years (ETF's almost all in stocks). For the last bucket you can dollar cost average into it over a year or so to smooth out the effects of the market. Rebalance as the years go by.
Gerard Muller
I don't think you've understood what this article was about.
The formulation you describe was just fine when bonds were providing historical returns and equities weren't being inflated artificially by an, admittedly, transient Fed policy. But as it is, if someone were to follow your prescription today they would be buying bonds whose current pathetic returns would be driven even lower when QE ends and equities whose value would also drop to an unsupported level. In other words they would likely lose their wealth big time.
The author's analysis is correct as things stand today. We are poised to soon see a return to un-stimulated economic times. What those times will look like is something that retirees should find more attractive than the bucket formulation you prescribe now, if they don't they'll at least have most of their, admittedly somewhat eroded, wealth intact.
James Drake
The Japanese experience of prolonged cheap money may well be our experience. In which case, planning to spend the principal and die broke a suitable option.
Michael H Mitchell
"if you assume a 5% return and 3% inflation " Key word there is ASSUME!!! If your assumption is wrong, and it could well be if the Fed bungles this unprecedented monetary expansion, 70's type inflation will kill you.
john boyer:
As a general rule of life I have said the longer you wait to make a decision the better. It gives me more time to wait for facts and information to come to me. We know for an almost certainty that bonds will fall. I am not so certain for stocks as they are not so monolithic as the bond market unless you go for an index fund or mutual fund. Having a pile of cash lets me sleep at night while I contemplate my next move. I have more control over my expenses so I know how quickly I will be bleeding out my cash. Investment decisions will be made but not just now. Though from almost any measure I could retire now I continue to work for a modest income as I know I may need it some day. Continuing to work does not cost me anything other than the chance to be simply idle. As has been posited by Mr. Taleb of Black Swan fame and Antifragile it is all about the cheapest option. Right now staying in cash seems to be the cheapest option for the highest return.
Jul 25, 2013 | WSJ.com
"A positive correlation between treasury yields and equities implies that bonds would act as a hedge for equities and can justify higher allocation to Treasuries in spite of their lower expected returns," Barclays's Maneesh Deshpande, Rohit Bhatia, Ashish Goyal and Arnab Sen wrote in a research note. But with that correlation gone, Treasurys are no longer a viable hedge.
So the Barclays analysts there have asked "What gives?"
They note that some have explained this shifting relationship by saying it's a function of investor expectations about the outlook for Federal Reserve policy, others, a flight to safety dynamic.
But Barclays suggests another reason. "The most credible explanation is simply that the interest rate equity correlation is systematically inversely related to the level of interest rates."
In other words, when interest rates are exceptionally low stocks and bonds are likely to be positively correlated. In high rate environments, stocks should be negatively correlated with interest rates.
Here's the key takeaway:
During low interest rate periods, risks to the equity market are more from deflationary pressures than from inflationary pressures. Any rise in interest rates would be considered good news by the equity market as it would reflect higher expected inflation (and thus lower deflationary risk) in the future. Thus, in a low rate environment, equities should be positively correlated with interest rates. In contrast, during high interest rate periods, a bigger concern for the market is a further increase in inflation. In this environment, any rise in interest rates would likely reflect higher inflationary expectations in the future and consequently be taken negatively by the equity markets, as higher inflation makes longterm planning more difficult and also raises the spectre of stagflation. Hence in high interest rate regimes, equities should exhibit negative correlation with interest rates.
Another factor, they note, can be unexpected moves by the Fed. "In the short term, surprises in Fed policy can actually lead to lower correlation," four strategists wrote in the note.
"Correlation is expected to be low or negative in periods when the Fed appears more dovish or hawkish than the market expects," they wrote. "These periods of low correlation are usually short in nature as the market quickly resets to the Fed's new stance."
The Barclays strategists don't see the near-zero correlation lasting long. "We believe correlation is likely to become positive going forward once the uncertainty over the Fed policy is removed," they wrote.
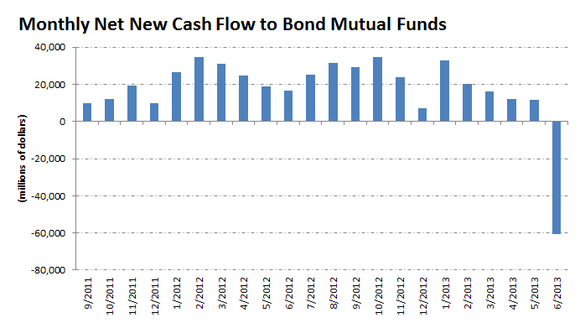
By Morgan Housel | More Articles | Save For Later

July 9, 2013 | Comments (5)Take a look at this chart. It shows the monthly flows to bond mutual funds over the last two years. See if you can spot the outlier:
Source: ICI.
Suddenly, nobody wants bonds.
That's understandable. Interest rates are rising, and for the first time in years, bonds are losing money. The PIMCO Total Return Fund is down 5.6% since April. The Vanguard Long Term Corporate Bond ETF (NASDAQ: VCLT ) is off nearly 10% in the last three months. The popular iShares Barclays 20 Year Treasury Bond ETF has lost more than 11% in the last 90 days.
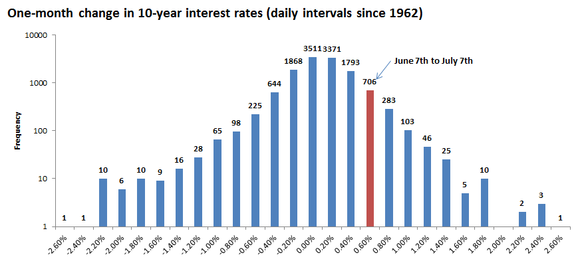
But what's interesting -- maybe scary -- to think about is that the rise in interest rates over the last month isn't that large, historically. Interest rates on 10-year Treasury bonds have increased by about 60 basis points in the last month, according to data from the Federal Reserve. In percentage terms, that's a lot. But interest rates are so low right now that percentage gains can be deceptive -- a doubling of interest rates from last summer's lows would mean a gain of only a little more than one percentage point.
In absolute terms, the rise in interest rates over the last month isn't that impressive:
Source: Federal Reserve, author's calculations.
If bond investors have panicked at what has been a pretty mild rise in interest rates, what will they do when rates really start to rise?
It won't be pretty. My guess is there will be a few more outliers on that first chart.
On July 09, 2013, at 5:22 PM, SkepikI wrote:
"But what's interesting -- maybe scary -- to think about is that the rise in interest rates over the last month isn't that large,"
Scary indeed Morgan. Thank you for writing this article destined to be consigned to obscurity and ignored by those who need it most. It saves me from my own nagging urge to write one.
And if you readers think THAT'S scary, think about this: rates were so low and still are so low, the mild decline in prices have completely wiped out the interest earnings for the last 6 or 8 months! You Bond owners and fund investors are NOT being paid for the fearsome risks you are running from oppressed interest rates and artificially inflated bond prices.
What ought to be stark terror of inevitable return to normalcy is significantly absent for Bond investors. Just consider this thought experiment: What happens to the price of your bond funds with duration near 10 (as many long term are like Vanguard) when interest rates adjust up by a mere 1%? Price down 10%...lost every bit of interest earned in the past, what 4 years? UGLY! (simulate panic here)
And that's only a 1% change. How much do YOU think interest rates are depressed by?
Report this Comment On July 10, 2013, at 3:30 PM, StockGamingCom wrote:
Bonds seem over-sold. However, in the long run, there's a higher probability that interest rates will go up than down. Therefore, one can play the bounce but the long term viability is a big question mark.
Report this Comment On July 10, 2013, at 10:53 PM, KKoleto wrote:
I had always read to go with intermediate bond funds. Maybe that "set it and forget it" approach is a mistake. What I can't get past is when equities tanked a few years back I just stiffened my lip and waited it out, doing some shopping along the way.
So why am I so nervous with these bond funds going South? Anyway, I am now looking at building a short bond ladder with the thought that rates will rise over time.
Funny, my first mortgage in 1970 was for 7.9. I was told I'd never see rates that low again!
Report this Comment On July 12, 2013, at 11:36 AM, Grimsyke wrote:
I'm new to making comments and perhaps I am in the group of people that the government feels do not understand basic finances but I read today that the government announced it is going to continue their economic stimulus for the next while and the news says the stock markets soared on this good news.
According to my understanding, their "stimulus" is done by spending $85 Billion a month to buy their own debt issues and they are doing this with extra money that they are printing. That is a Trillion dollars a year and they have been doing this for a few years now. Maybe I'm wrong but that seems like a recipe for massive inflation and increases in interest rates if I ever saw one. This seems crystal clear to me.
What I don't understand is why the media and experts are raving that this is a good thing and celebrating??
Report this Comment On July 13, 2013, at 8:20 PM, Zeppelin6880 wrote:
If you've recently bought bonds (i.e. in the last year or so), yes you've taken a hit. If you've had bonds since 2007 like myself you are still up HUGE when taking into account capital gains due to decreasing interest rates. So a one month rise in interest rates does not concern me, and the Fool should know this best as they advocate for a long-term investing approach.
Also, people have been saying for years rates have nowhere to go but up. They've been wrong. I still think the 1.4% or so the 10 yr Treasury hit will again be breached once Europe blows up this year or next (not literally, but financially, just in case the NSA is reading this). The European crisis is anything but over. Greece, Portugal, Italy, Spain, et al are just a precursor to what will occur when investors realize FRANCE is the real risk. Once that situation boils over again money will come across the Atlantic again driving down our rates here. You could see a 1% 10 yr Treasury, which 5 or 6 years ago would have been an impossible thought.
Just a warning, but interest rates can stay low and remain there much longer than seems possible. Just look at Japan. Many a money manager's career has been ruined by betting on a rise in Japanese interest rates.
Cash may be best right now, as the risk/reward ratio for both stocks and bonds seems bad. Stocks are priced at a premium when looking at Shiller P/E (CAPE, cyclically adjusted P/E). Once corporate profit margins revert to the mean (and they ALWAYS have), stocks will get hammered. When this will happen is anyone's guess, but you've been warned.
Stay in short-term bond funds so you can re-invest at higher yields as they rise. Buy gold/silver (5-10% of your portfolio) as insurance.
At these all-time-high prices, just how much riskier stocks are than alternatives like bonds, cash or gold depends largely on how you define "risk." William Bernstein, an investment manager at Efficient Frontier Advisors in Eastford, Conn., and the author of several books on investing and and financial history, says risk takes two basic forms-and understanding the difference can help investors figure out what they should be afraid of.
What Mr. Bernstein calls "shallow risk" is a temporary drop in an asset's market price; decades ago, the great investment analyst Benjamin Graham referred to such an interim decline as "quotational loss."
Shallow risk is as inevitable as weather. You can't invest in anything other than cash without being hit by sharp falls in price.
"Shallow" doesn't mean that the losses can't cut deep or last long-only that they aren't permanent. "Deep risk," on the other hand, is an irretrievable real loss of capital, meaning that after inflation you won't recover for decades-if ever.
BigW wrote:
The world is not quite as simple as this makes it sound. If I buy stock in an individual company and that company makes bad decisions or is overwhelmed by events beyond its control, then I will lose money. I won't magically get that money back later because investing in the stock market represents "shallow risk". Even a broad index fund is subject to the decisions made by the companies it contains. There is no magic here – the best remedy to risk is diversification. Understand that you aren't going to make perfect decisions with imperfect knowledge of the future. Some things will work out, some things won't. But no single or even group of decisions you make will sink you. Before making any investment – I always ask one question – what happens to me if I never see a DIME of the money again? When the answer to that question becomes something like – I won't be able to retire, I will lose my house, then that means it is ALWAYS a bad investment, no matter how attractive it may appear at the time.
12:37 pm July 27, 2013
James Bucholtz wrote:There is nothing new in this book. The author has simply taken old concepts and wrapped them in a new outer coat. Seriously you can summarize the article as simply saying that at times downturns are mild and at others they are persistent and severe. What would have been useful would be a way to predict which was which however predicting the future state of a non linear dynamical system is impossible.
11:53 am July 27, 2013
Ray Zemon wrote:One must remember, ex post you know the state you were in, but ex ante you only know a subjective probability distribution of future states.
In late 2008, there was a real possibility of a "deep risk" state (deflation). I believe that's why the market dropped as much as it did and, as the likelihood of a "deep risk" state declined, came back so quickly,10:24 am July 27, 2013
Lee Zehrer wrote:I would think time would be a factor in evaluating risk?
Or are we actually talking about volatility?
7:50 pm July 26, 2013
Anonymous wrote:BUY BUY BUY BUY BUY BUY BUY BUY BUY BUY BUY BUY BUY BUY BUY BUY BUY BUY BUY BUY BUY BUY BUY BUY BUY BUY BUY BUY BUY BUY BUY BUY BUY BUY BUY BUY BUY BUY BUY BUY BUY BUY BUY BUY BUY BUY BUY BUY BUY BUY BUY BUY BUY BUY BUY BUY BUY BUY BUY BUY BUY BUY BUY BUY BUY BUY BUY BUY BUY BUY BUY BUY BUY BUY BUY BUY BUY BUY BUY BUY BUY BUY BUY BUY BUY BUY BUY BUY BUY BUY BUY BUY BUY BUY BUY BUY BUY BUY BUY BUY BUY BUY BUY BUY BUY BUY BUY BUY BUY BUY BUY BUY BUY BUY BUY BUY BUY BUY BUY BUY BUY BUY BUY BUY BUY BUY BUY BUY BUY BUY BUY BUY BUY BUY BUY BUY BUY BUY BUY BUY BUY BUY BUY BUY BUY BUY BUY BUY BUY BUY BUY BUY BUY BUY BUY BUY BUY BUY BUY BUY BUY BUY BUY BUY BUY BUY BUY BUY BUY BUY BUY BUY BUY BUY BUY BUY BUY BUY BUY BUY BUY BUY BUY BUY BUY BUY BUY BUY BUY BUY BUY BUY.
Thanks,
Wall Street
arthur_dent
for those who think QE and financial repression have not been a fantastic bonanza and giveaway to corporate America, you might want to read this, from Reuters,
Analysis: How much is Fed aid to U.S. corporate profits worth?
just keep repeating to yourself, the Fed is doing it to create jobs and Janet Yellin will create even more jobs.
blinkered )
arthur_dent wrote:
for those who think QE and financial repression have not been a fantastic bonanza and giveaway to corporate America, you might want to read this, from Reuters,
As much as I abhor artificially low rates and their unintended consequences, I can tell you at my fortune 500 company, there has been no austerity because of the robust profits so there is a little truth to the jobs benefit. Is that the best way to help jobs? I sure hope not.
July 24, 2013
Tim Duy:
save_the_rustbelt said...Shock and Awe(ful), by Tim Duy: Yesterday's hot story from Ezra Klein that Larry Summers was the lead candidate for the top spot at the Federal Reserve was greeted with shock and awe(ful). I wish I could say that I was surprised, but at the end of last month I tweeted:
I often think we have prematurely declared Janet Yellen the front runner. We forget that politics will be in play. http://t.co/ghIPnl0kjj
My concerns were only reinforced when news broke last week of the campaign against current Vice Chair Janet Yellen. From Ezra Klein:
The favored parlor game of the political-economic complex right now is guessing who will replace Ben Bernanke as chairman of the Federal Reserve. The clear front-runner is Federal Reserve Vice Chairman Janet Yellen. But she's by no means a sure thing.
One important reason she's not - and I don't know another way to say this - is sexism, as evidenced by the whispering campaign that's emerged against her.
Yesterday, Klein declared Summers the front-runner:
People dismissed Summers's chances a month or two ago, but he's increasingly viewed as the leading candidate today - and opinions on this, for reasons I don't fully understand (though I suspect have to do with a bunch of elite trial balloons going up at the same time), have really hardened in the last 72 hours.
Klein lists a variety of reasons in favor of Summers, most important of which I think is that President Obama and his staff know and like Summers, while Yellen is a virtual unknown in White House circles. This is also the message of Washington Post reporter Zachary Goldfarb's tweet yesterday:
Larry Summers visited White House 14 times in past 2yrs. Janet Yellen visited once, records show. pic.twitter.com/ufFuVbrH7V
- Zachary A. Goldfarb (@Goldfarb) July 23, 2013Reaction was swift and fierce from some quarters of the blogosphere. Cardiff Garcia begins with a defense of Summers:
...Some of the mistakes of his past, such as his role in deregulating derivatives (the Brooksley Born episode) or the Harvard interest rate blowup, don't really tell us much about his capacity to guide macroeconomic stabilisation policy.
His more recent mistakes, specifically his failure to better advise Obama on the stimulus (should have been bigger) and housing policy (should have done more for people in foreclosure and underwater homeowners), included political considerations that are hard to untangle from his actual views.
before launching into his reasons for supporting Yellen, beginning with the most important:
The simplest reason is that she is more conventionally qualified for the job, boasting a much longer entry in her CV as a monetary policymaker.
Like him or hate him, Summers lacks Yellen's depth of exposure to monetary policy. If relative experience with monetary policy is a requirement for the job, Yellen clearly has the upper hand. Felix Salmon, not exactly a fan of Summers to begin with, sums up the situation:
...if Obama picks Summers, it won't be on the merits; instead, it will be on the grounds that Obama likes Summers, and is in awe of his intelligence. (Summers is, to put it mildly, not good at charming those he considers to be his inferiors, but he's surprisingly excellent at cultivating people with real power.)
Salmon then launches into an attack on Summers:
What's more, the move would be a calculated snub to bien pensant opinion. Never mind the utter shambles that Summers made of Harvard, or the way he treated Cornell West, or his tone-deaf speech about women's aptitude, or the pollution memo, or the Shleifer affair, or the way he shut down Brooksley Born at the CFTC, or his role in repealing Glass-Steagal, or his generally toxic combination of ego and temper - so long as POTUS likes Larry, and/or so long as Summers is good at working key Obama advisors like Geithner, Lew, and Rubin, that's all that matters.
Evidently, Salmon holds a grudge a bit longer than Garcia. Now, if only President Obama would shift his focus from Summers and Yellen to Ben Stein, then we would see some real fireworks from Salmon.
Mark Thoma has a more succint reaction:
Larry Summers is the Front-Runner? WTF?
Perhaps not all is lost. Back to Klein:
That's not to say Summers is anywhere near a sure thing. His confirmation would be far tougher than Yellen's, as Republicans will make him answer for the stimulus and the bailouts, and progressive Democrats have a list of grievances going back to financial deregulation in the Clinton-era. There's also the simple fact that appointing Yellen would break a significant glass ceiling - and do so in an administration that hasn't always been great about appointing women to top economic positions. And Summers continues to be a polarizing figure: Those who like him love him, but those who don't like him really don't like him.
That said, one gets the feeling that this is not a sudden decision. Instead it is one that has been building for weeks, at least since June 29, when I began to get nervous about the assumption of Yellen as a front-runner. I suspect that if the position has hardened within the White House as Klein suggests, it is because Obama has made his choice and it is time for everyone to get on board.
I have to say that if Yellen is not the pick, I will be disappointed. I think she the best qualified candidate for the job, and agree with the pro-Yellen arguments of Garcia, Salmon, and Bill McBride. I am very concerned about Summer's disposition to be a de-regulator, especially after we see that the Federal Reserve, in its infinite wisdom, gave permission for investment banks to openly manipulate commodity markets. Does anyone see Summers pushing back at that kind of regulation, or getting on board? I don't think that he is the kind of person to take the words of Adam Smith to heart:
The interest of the dealers, however, in any particular branch of trade or manufactures, is always in some respects different from, and even opposite to, that of the public. To widen the market and to narrow the competition, is always the interest of the dealers. To widen the market may frequently be agreeable enough to the interest of the public; but to narrow the competition must always be against it, and can serve only to enable the dealers, by raising their profits above what they naturally would be, to levy, for their own benefit, an absurd tax upon the rest of their fellow-citizens. The proposal of any new law or regulation of commerce which comes from this order ought always to be listened to with great precaution, and ought never to be adopted till after having been long and carefully examined, not only with the most scrupulous, but with the most suspicious attention. It comes from an order of men whose interest is never exactly the same with that of the public, who have generally an interest to deceive and even to oppress the public, and who accordingly have, upon many occasions, both deceived and oppressed it.
Bottom Line: Nothing is certain until the announcement is made and the Senate takes its turn, but it is looking like the White House is pushing to make Larry Summers the next Federal Reserve Chairman. The curse of the Vice Chair would then live on.
Just give the job to Robert Rubin and cut out Larry the middle man.
anne said...
I am very concerned about Summer's disposition to be a de-regulator, especially after we see that the Federal Reserve, in its infinite wisdom, gave permission for investment banks to openly manipulate commodity markets....
-- Tim Duy
[ http://www.nytimes.com/2013/07/21/business/a-shuffle-of-aluminum-but-to-banks-pure-gold.html
July 20, 2013
A Shuffle of Aluminum, but to Banks, Pure Gold
By DAVID KOCIENIEWSKIRegulators have allowed banks to buy companies that trade in commodities, resulting in huge profits for the banks and billions in higher costs for consumers. ]
anne said in reply to anne...Any Federal Reserve executive could have argued against this policy, but to my knowledge no executive including Janet Yellen so much as discussed the policy publicly.
Mark A. Sadowski said in reply to anne...
Yellen last spoke about commodity prices in April 2011. She did not specifically address that policy.
http://www.federalreserve.gov/newsevents/speech/yellen20110411a.htm
beezer said...
Darryl FKA Ron said in reply to beezer...Nice Adam Smith quote. Smith has a bunch of these sprinkled throughout the Wealth of Nations. Conservatives, of course, don't remember them very often.
That was a great Adam Smith quote. I got me interested WoN, where I had not been before. Sounds like Smith would have disagreed with Schumpeter on consolidating firms into monopoly rent seeking behemoths.
pgl said...
It could be worse. Had Romney won last year - the discussion would be whether it would be Glenn Hubbard or John Taylor.
Mark A. Sadowski said in reply to pgl...
Peter K. said in reply to Mark A. Sadowski...Romney also had Greg Mankiw on his short list:
The difference is that all three potential Republican nomineees actually believe monetary policy is effective unlike Summers.
And Mankiw has written about NGDP targeting in the past:
http://www.nber.org/chapters/c8329.pdf
So it's possible he would have pursued a more expansionary rules based policy.
So if you think putting someone who believes monetary policy is ineffective in charge of the nation's monetary policy (what I would call the James G. Watts candidate) is better than candidates who believe it is effective but two of whom are hawks and one who is essentially a dove, then you are right but I'm not so sure.
I usually agree with you but you're wrong about Mankiw. He would have pursued a Republican policy, probably overly tight. He has written a lot of nonsense over the past 4 years all in the service of Team Republican. He's a loyal soldier.
Mark A. Sadowski said in reply to Peter K....
"He would have pursued a Republican policy, probably overly tight."
Under a Republican President? Don't be so sure.
don said in reply to Mark A. Sadowski...
pgl said in reply to Mark A. Sadowski...I was at an NBER conference where Greg presented an argument for eliminating the inheritance tax. He presented a model in which bequest was the motive for amassing wealth. I asked him how is analysis squared with quotes by two other authors: Keynes, who said something like "As I look about me, I see English industry is a little stupid - too much dominated by third generation men" and Adam Smith, who said the purpose of amassing wealth was neither consumption nor bequests, but "the parade of riches." I wonder if Greg really believes that the inheritance tax is inferior to the income tax.
On the other hand, if Greg followed his dictates for monetary policy, with explicit future inflation targeting, it might have been more effective than the current QE policy.
Mark A. Sadowski said in reply to pgl...I think most Keynesians would tell you that monetary policy is very effective under normal conditions but when we are in a liquidity trap fiscal policy becomes the more effective tool. Bernanke believes that. Yellin believes that. Summers believes that. Summers has been screaming for fiscal stimulus true but so has Bernanke. OK, Congress refuses to listen. Maybe Yellin puts more faith in QE and all that but how's that been working of late? Larry Summers is not a 1950's fiscalist. OK?
"I think most Keynesians would tell you that monetary policy is very effective under normal conditions but when we are in a liquidity trap fiscal policy becomes the more effective tool. Bernanke believes that."
How does one define "more" in this context.
"Bernanke believes that. Yellin believes that. Summers believes that. Summers has been screaming for fiscal stimulus true but so has Bernanke."
Bernanke and Yellen have both correctly noted that fiscal policy has been a huge economic drag. But both still strongly believe that monetary policy is highly effective at the zero lower bound. Take Yellen's speech on monetary policy from April 2012:
http://www.federalreserve.gov/newsevents/speech/yellen20120411a.htm
Or Bernanke's speech at Jackson Hole from last year:
http://www.federalreserve.gov/newsevents/speech/bernanke20120831a.htm
Nobody currently in the Board of Governors of the Federal Reserve really believes in the "liquidity trap". Nor would I want anyone who believes that monetary policy is totally impotent to be placed in charge of the nation's monetary policy.
Reply Wednesday, July 24, 2013 at 01:05 PM
Mark A. Sadowski said in reply to pgl...
"Maybe Yellin puts more faith in QE and all that but how's that been working of late?"
Well enough.
The big four advanced currency areas that are currently at or near the zero lower bound in policy interest rates are the U.S., the eurozone, Japan and the U.K.
One proxy for the amount of QE done is monetary base expansion. This isn't perfect of course since it also measures other policy responses such as "credit easing". The ECB has done credit easing but no QE for example. But let's not make things too complicated for the moment.
As of May the BOE's monetary base is up by 348% since August 2008, the Federal Reserve's up by 260%, the BOJ's up by 75% and the ECB's up by 48%:
http://thefaintofheart.files.wordpress.com/2013/06/sadowski3_1.png
Since aggregate demand (AD) is the appropriate measure of the effectiveness of macroeconomic policies whose ultimate purpose is in fact to stimulate AD, perhaps we should look at the relative AD performance of the four large advanced currency areas since the Great Recession. But before we do that, we should take a look at the other main policy tool for stimulating AD, namely fiscal policy.
In my opinion the most objective way of measuring fiscal policy stance is the change in the general government cyclically adjusted balance, particularly the cyclically adjusted primary balance (CAPB). The cyclically adjusted balance takes into account any changes in the general government budget balance due to the business cycle. Thus changes in the cyclically adjusted balance are mostly due to discretionary fiscal policy, and consequently may be taken as a proxy for the degree of fiscal stimulus. The CAPB goes a step further, factoring out changes in net interest on government debt and thus ensuring that practically all of the changes in fiscal balance are discretionary in nature. The following is a graph of the changes in CAPB by currency area over the calendar years 2009-13. All data comes from the April 2013 IMF Fiscal Monitor.
http://thefaintofheart.files.wordpress.com/2013/06/sadowski3_10.png
The first thing you should note is that Japan has had the most expansionary fiscal policy every year without exception. And although all of the currency zones adopted a much less expansionary fiscal policy stance in 2010, it was the U.K. that took the lead in fiscal consolidation, having the most contractionary fiscal policy in both 2010 and 2011. The U.S. has had the most contractionary fiscal policy starting with calendar year 2012.
Now, let's take a look at relative AD performance. To be technical, AD is nominal GDP (NGDP) when inventory levels are static (i.e. nominal Final Sales of Domestic Product). Thus for all intents and purposes AD is virtually identical to NGDP. The following is a graph of the NGDP of the four big advanced currency areas with NGDP indexed to 100 in 2008Q2, that is, before large scale monetary base expansion started in September 2008.
http://thefaintofheart.files.wordpress.com/2013/06/sadowski3_11.png
Note that the U.K. led in relative NGDP growth from 2009Q3 through 2011Q3 with the sole exception of 2011Q2. The U.K. also led in relative monetary base growth from June 2009 through January 2011. And as previously noted the U.K. had the most contractionary fiscal policy in 2010 and 2011.
The U.S. has led in relative NGDP growth since 2011Q4. The U.S. also led in relative monetary base growth from February 2011 through January 2012. And as previously noted the U.S. has had the most contractionary fiscal policy starting with calendar year 2012.
Japan has ranked last in relative NGDP growth throughout. Japan has also ranked last in relative monetary base growth with the exception of March through August 2011 and since April 2013. And as previously noted Japan has had the most expansionary fiscal policy throughout.
Bloix said in reply to pgl..."It could be worse." The motto of the Obama administration.
kharris said...This is at least in part an outgrowth of the Republican war on women. If women voters had anywhere else to go, snubbing a well qualified woman for an arguably less well qualified guy would be stupid politics. As it is, the White House can turn its thoughts to political considerations other than women's votes in making this choice. In this way, the Republican war on women may succeed, producing a major casualty.
Zero Hedge
The secular low in bond yields has yet to be recorded. This assessment for a continuing pattern of lower yields in the quarters ahead is clearly a minority view, as the recent selling of all types of bond products attest. The rise in long term yields over the last several months was accelerated by the recent Federal Reserve announcement that it would be "tapering" its purchases of Treasury and mortgage-backed securities. This has convinced many bond market participants that the low in long rates is in the past. The Treasury bond market's short term fluctuations are a function of many factors, but its primary and most fundamental determinate is attitudes toward current and future inflation. From that perspective, the outlook for long term Treasury yields to fall is most favorable in light of:a) diminished inflation pressures;
b) slowing GDP growth;
c) weakening consumer fundamentals; and
d) anti-growth monetary and fiscal policies.
InflationSustained higher inflation is, and has always been, a prerequisite for sustained increases in long term interest rates. Inflation's role in determining the level of long term rates was quantified by Irving Fisher 83 years ago (Theory of Interest, 1930) with the Fisher equation. It states that long term rates are the sum of inflation expectations and the real rate. This proposition has been reconfirmed in numerous sophisticated statistical studies and can also be empirically observed by comparing the Treasury bond yield to the inflation rate (Chart 1). On an annual basis, the Treasury bond yield and the inflation rate have moved in the same direction in 80% of the years since 1954.
Additional factors restraining inflation are the appreciation of the dollar and the decline in commodity prices. The dollar is currently up 14% from its 2011 lows. A rise in the value of the dollar causes a "collapsing umbrella" effect on prices. A higher dollar leads to reduced prices of imports, which have been deflating at a 1% rate (ex-fuel) over the past year. When importers cut prices, domestic producers are forced to follow. Commodity prices have dropped more than 20% from their peak in 2011. This drop in commodity prices has also contributed to lower rates inflation.
Sustained higher inflation is not currently evident, and the forces that create inflation are absent. Thus, a period of sustained higher long term rates is improbable.
GDP
GDP growth, whether if measured in nominal or real terms, is the slowest of any expansion since 1948. From the first quarter of 2012 through the first quarter of 2013, nominal GDP grew at 3.3%. This is below the level of every entry point of economic contraction since 1948 (Chart 3). Real GDP shows a similar pattern. For the past four quarters real economic growth was just 1.6%, which was even less than the 1.8% growth rate in the 2000s and dramatically less than the 3.8% average growth rate in the past 223 years. These results demonstrate chronic long term economic underperformance.
Over the past year, the Treasury bond yield rose as the nominal growth in GDP slowed. The difference between the Treasury bond yield and the nominal GDP growth rate (Chart 4) is important in two respects. First, when the bond yield rises more rapidly than the GDP growth rate, monetary conditions are a restraint on economic growth. This condition occurred prior to all the recessions since the 1950s, as indicated in the chart. This condition also signaled the growth recessions in 1962 and 1966-67. Second, the nominal GDP growth rate represents the yield on the total economy, a return that embodies greater risk than a 30 year Treasury bond. Thus, the differential is a barometer of cyclical value for investors in Treasury bonds versus more risky assets.
On two occasions in the 1990s the Treasury bond/GDP differential rose sharply. Neither a quasi- nor outright recession ensued, but in both cases bonds turned in a stellar performance over the next year or longer. This economic indicator simultaneously casts doubt on the prevailing pessimism on Treasury bonds and the optimism over U.S. economic growth.
Consumer
Consumers have not yet healed from the great recession. Their income and employment situations have languished. Based on the standard of living, as measured by the real median household income, this entire recovery has bypassed the consumer sector. The standard of living has contracted regularly in recessions, but this is the first time deep into an expansion that it has continued to erode. The current standard of living is unchanged from 1995 (Chart 5).
In spite of job gains in the first half of 2013, the downward pressure on the standard of living actually intensified. Approximately three quarters of the increases in jobs were in four of the lowest paying industries – retail trade; the temporary help services component of professional and business services; hospitality and leisure; and the nursing and residential care facilities component of the medical category. These increases may reflect efforts of firms to minimize the increase in health care costs associated with full time employment under the Affordable Care Act. Part time jobs averaged increases of 93,000 per month in the first half of 2013, while full time jobs averaged increases of only 22,000 per month. Full time employment as a percentage of the adult population is currently 47%, which is near the lows of the last three decades.
Historically, when taxes are increased, the initial response of households results in a lower saving rate rather than an immediate reduction in spending. For some consumers, recognition of the tax changes in their income is a problem, particularly for those whose earnings are dependent on commissions, bonuses or seasonal work. This explains the sharp drop in the personal saving rate to 2.7% in the first five months of this year, a level at or below the entry points of all the economic contractions since 1929. The 2013 slump in the saving rate is a precursor of the painful adjustments that lie ahead, and an additional restraint on economic growth. (Note: In late July the Bureau of Economic Analysis is expected to release a benchmark revision to the National Income and Product Accounts. As a result of the revision the personal saving rate may be raised by up to 1.5%. This is due to the change in consumer ownership of defined benefit pension plans. This revision will no t change the trend of the saving rate, nor will this higher figure indicate a source of funds for immediate spending since consumers will only receive such pension benefits when they retire.)
The drop in the saving rate in 2013 also serves to explain why the primary drain from higher taxes occurs with a lag after the taxes take effect. Based on various academic studies there is a two or three quarter lag in curtailed spending after the tax increase. Thus, the main drag on growth will fall in the third and fourth quarters of this year, with negative residual influences persisting through the end of 2015. Approximately $140 billion of the tax increase constitutes what might be termed a reduction in permanent income, or its equivalent life cycle income. In addition to working with a lag, over a three year period this portion will carry a negative multiplier of between two and three.
Monetary & Fiscal
Astronomical sums of money have been expended by both monetary and fiscal authorities since the crisis. With the benefit of hindsight it is clear their efforts have not aided economic growth, but rather the balance of their actions has been counter productive. The Fed has maintained the Fed Funds rate at near-zero levels, and it has tried to lower longer term rates through a series of quantitative easings. The effect of each of the quantitative easings was the opposite of the Fed's intentions. During every period of balance sheet expansion long rates rose, yet when securities purchases were discontinued yields fell (Chart 6). The Fed cannot control long rates because long rates are affected by inflation expectations, not by supply and demand in the market place. This is extremely counter intuitive. With more buying, one would assume that prices would rise and thus yields would fall, but the opposite occurred. Why? When the Fed buys, it appears that the existing owners of Treasuries (now amounting to $9.5 trillion) decide that the Fed's actions are inflationary and sell their holdings, raising interest rates. When the Fed stops this program, inflation expectations fall creating a demand for Treasuries, bringing rates back down. The Fed's quantitative policies have been counter productive to growth as interest rates have risen during each period of quantitative easing. During QE1 and QE2, commodity prices rose, the dollar fell and inflation rose temporarily. Wages, however, did not respond. Thus, the higher interest rates during all QEs and the fall in the real wage income during QE 1 & 2 served to worsen the income and wealth divide. This means many more households were hurt, rather than helped, by the Fed's efforts.
In terms of government spending, fiscal policy has not, and will not, have a major affect on economic growth. The increased spending immediately following the financial crisis did little to encourage the economy to grow faster. Likewise, the decrease in spending associated with the "sequester" will unlikely be a drag on growth after the initial and lagged effects are fully exhausted. The research on government spending multipliers suggests that the multiplier on spending is very close to zero.
The impact of tax changes is not nearly as harmless. It has been argued that an expired "temporary payroll tax cut" would not effect spending as the initial increase in income was not seen as permanent. The facts seem to counter this opinion. The average monthly year-over-year growth rate of real personal income less transfer payments for 2011 was 3.4%, and in 2012 it was 2.2%. This year, with the payroll tax change in effect, the average is 1.8% through May. The slower income has resulted in a slowdown in spending. Like income, real personal consumption expenditures has trended lower, with average monthly year-over-year growth rates of 2.5% for 2011, 1.9% for 2012 and 1.8% through May of this year. This trend is expected to continue for some time.
A Final Consideration Favoring Bonds
In the aftermath of the debt induced panic years of 1873 and 1929 in the U.S. and 1989 in Japan, the long term government bond yield dropped to 2% between 13 and 14 years after the panic. The U.S. Treasury bond yield is tracking those previous experiences (Chart 7). Thus, the historical record also suggests that the secular low in long term rates is in the future.
Similar Articles You Might Enjoy:
- 2012 Year In Review - Free Markets, Rule of Law, And Other Urban Legends
- Van Hoisington: "Has The Recession Really Ended?"
- Weekly Bull/Bear Recap
- David Stockman: "The Capital Markets Are Simply A Branch Casino Of The Central Bank"
- The Sell-Side Take On The Tepid GDP Growth
07/22/2013 | Zero Hedge
"It's hard to make the case that [US stocks are up 17% on a 2.5% earnings rise]based on fundamentals alone - it's money in motion," is how BofA's CIO Hans Olsen describes the unreality occurring in US asset markets currently. He noted in last week's interview with CNBC that Bernanke's experimentation has created asset-inflation "that would make the stock market bubble of 2000 look like a day at the beach. It's really quite remarkable." Critically, as many have noted, he notes "let the market start to price things based on fundamentals again rather than money printing. The sooner we get back to a market pricing, the more sustainable it becomes."
What is ironic is that Olsen is overweight stocks in spite of all this - but like everyone else in the status quo - is hoping Bernanke keeps the house of cards from collapsing. Olsen appears to be among the very few career bankers willing to tell the truth - the fear being, of course (as we showed here) that it would mean their "skills" are completely meaningless.
Zero Hedge
"Today's markets have a vulnerability that has not existed through most of history. Today's valuations only make sense in light of low expected cash rates. Remove that expectation, and pretty much every asset across the board is vulnerable to a fall in price, as the rising real discount rate plays no favorites. There is no asset class you can hold that would be expected to do well if the real discount rate rises from here.
Under normal circumstances, a rising real discount rate would probably come on the back of rising inflation or stronger than expected growth, which are diversifiable risks in a portfolio. But May's shock to the real discount rate came not because inflation was unexpectedly high or because growth will be so strong as to lift earnings expectations for equities and other owners of real assets, but because the Fed signaled that there was likely to be an end to financial repression in the next few years. And because financial repression has pushed up the prices of assets across the board and around the world, there is unlikely to be a safe harbor from the fallout, other than cash itself." - GMO
Bloomberg
Pacific Investment Management Co.'s Bill Gross said he expects the Federal Reserve won't tighten monetary policy until 2016 at the earliest.
"So bonds come out of their coffin & it's not even Halloween," Gross, who manages Pimco's $268 billion Total Return Fund, said in the posting on Twitter. "Bernanke says follow policy rate & we agree."
... ... ...
The Fed chairman was "relatively dovish" in his outlook on the U.S. economy and monetary policy, according to Mohamed El-Erian, Pimco's chief executive officer. Markets "took the tapering too far" and 10-year Treasury yields may drop to 2.2 percent this year, El-Erian, who is also co-chief investment officer with Pimco founder Gross, said in a July 17 interview.
... ... ...
Gross also added to holdings of mortgage securities in June, the fund's second-largest holdings. The proportion rose to 36 percent last month, from 34 percent in May.
Calculated Risk
robj wrote:
MBS market is very solid
$40 billion/month, rain or shine. Price irrelevant. Solid ponzi.
friar john
High-profile bond fund manager Jeffrey Gundlach has scooped up agency mortgage-backed securities in recent days as many other investors rushed for the exits.
Gundlach, the founder of investment firm DoubleLine Capital and co-manager of the $39.4 billion DoubleLine Total Return Bond Fund, told The Wall Street Journal Tuesday that the recent big selloff, which sent bond yields much higher, represents a buying opportunity.
"We have been buying modestly in recent days and will probably increase exposure when the market settles down," said Gundlach. "A few months ago if you bought MBS, you got a yield of 1%. Now you can buy agency MBS of 4%."
I wouldn't call the MBS market solid from the above article. Sounds like he is hunting for yield.
1 currency now -yogi wrote:
$40 billion/month, rain or shine. Price irrelevant. Solid ponzi.
QE tide goes in; QE tide could go out.
friar john wrote:
Gundlach. "A few months ago if you bought MBS, you got a yield of 1%. Now you can buy agency MBS of 4%."
I wouldn't call the MBS market solid from the above article. Sounds like he is hunting for yield.
Grundlach has done alright for himself and his investors, but past returns may not be predictive. Everyone is hunting for yield, obviously.
He's not the most attractive personality, but he and Bill the Grocer are probably two of the best.
"Solid" was not the best wordchoice, as you suggest. Precisely because of the sell-off Grundlach finds the pricing more attractive, just like the S&P was a bargain 4 years ago. But MBS are not that compelling a value, to be sure, value is relative. Buying after a haircut is always a better value.
Econbrowser
Macroeconomic Advisers estimates second quarter growth at around 0.6% SAAR. [0] Is it because of the sequester and the ending of the payroll tax rate reduction? In part, Jeff Frankel thinks so; see also [1]. Macroeconomic Advisers had predicted something over a 1% reduction in growth rate (SAAR) relative to baseline in the second quarter [2]
Ricardo
Brian,
Menzie is correct. Sequester is not a Republican idea but was an Obama administration plan. The Republicans, as the stupid party, simply signed on.
anonymous
If you're looking for someone to blame for the sequester then blame all of Washington. It does not fall solely on Obama, nor Republicans or Democrats. The blame falls on all of them. Talking about how the sequester is a bad idea is not a partisan debate because it's passage was not partisan either. To be more specific it passed with half of the house Democratics support and about three quarters of Republican house support. In the Senate 45 Democrats supported the measure and 2/3rds of Republicans supported the measure. Boehner said of the sequester that he got 98% of what he wanted, and Obama signed it into law. It's not reasonable to blame this on either party alone.
June 30, 2013 | Econbrowser
Steven Kopits
So let's assume then that China falls into outright recession, the sort of debt crisis we used to associated with emerging (rather than mature) economies. That's my current working assumption. In response, let's suppose the Chinese, to support their financial system, sell, say, $1 trillion of US govt bonds to cover domestic banking losses.
Were this to happen, it would seem that the price of Treasuries would fall, and the interest rate would rise.
Steve
Is that right? How might it play out?
There are a few oddities with the recent move in 10 year rates:
1. It has been associated with declining inflation expectations, not rising ones. 2. The negative impact on emerging market equities and bonds has been outsized relative to most people's expectations. 3. Currency value changes have been strangely small (excepting the yen).
I like the China theory, as it explains these oddities better than the standard explanation that investors suddenly reinterpreted the timing of the Fed's future actions.
Yahoo
Investors listen up: The Fed has NOT decided to reduce its asset purchases later this year, as many were expecting.
In prepared remarks to Congress Wednesday, Fed Chairman Ben Bernanke said the central bank's "asset purchases are by no means on a preset course," dispelling expectations many have held since late May when Bernanke, in another appearance before Congress, said the Fed could decide in the "next few meetings" to taper its bond buys.
Related: Ignore Feldstein, The Fed Should Taper in 2014: Dean Baker
At the same time Bernanke employed the stereotypical balanced approach of economists that's often made fun of:
"On the one hand, if economic conditions were to improve faster than expected, and inflation appeared to be rising decisively back toward our objective, the pace of asset purchases could be reduced somewhat more quickly," said Bernanke. "On the other hand, if the outlook for employment were to become relatively less favorable, if inflation did not appear to be moving back toward 2 percent, or if financial conditions... were judged to be insufficiently accommodative... the current pace of purchases could be maintained longer."
And the winner is: the same pace of asset purchases, says Yelena Shulyatyeva, U.S. economist at BNP Paribas. Bernanke's latest message "is really dovish," she tells The Daily Ticker.
Related: Fed Statement Could Lead to "Amateur Hour" in the Markets
"The Fed is watching the data very closely," Shulyatyeva says, and the data is shaping up to show "slower growth in the second quarter--much slower than the FOMC anticipated."
Indeed, June housing starts fell almost 10 percent to a 10-month low and June retail sales rose 0.4%--half the increase economists had expected--although other economic data suggest the recovery is continuing.
Related: Weak Retail Sales Means Fed Tapering Later vs. Sooner
Shulyatyeva herself says second quarter GDP will likely grow by less than 1%, which means second half growth would have to soar to 3% in order to reach the Fed's annual forecast. And that, says Shulyatyeva is "not possible." She expects the Fed will lower its growth forecast rather than taper its bond purchases anytime soon. Watch the video above to see her demystify how the Fed analyzes the economy and sets strategy.
Firemane wrote on Thu, 7/18/2013 - 6:44 am (in reply to...) Mook wrote:
Four words: Not in labor force.
Except the number of people COVERED by unemployment is steadily marching upward.
2011 – Q1 - 125,560,066
2011 – Q2 – 125,572,661
2011 – Q3 -- 125,807,389
2011 – Q4 -- 126,188,7332012 – Q1 - 126,579,970
2012 – Q2 - 127,048,587
2012 – Q3 - 127,495,952
2012 – Q4 - 128,066,0822013 – Q1 - 128,613,913 -- +547,831
2013 – Q2 - 129,204,324 -- +590,411
2013 - Q3 - 129,827,178 -- +622,854
July 11, 2013 | Economist's View
anne said in reply to anne...
So it's not fear, it's despair: there's nothing to invest in, so why not keep stuff under your mattress?
-- Paul Krugman
[ I find this comment completely ridiculous and have no possible idea what Krugman could have been thinking when we have just passed through a 30 year profound bull market in bonds and are in the midst of a powerful bull market in stocks that began in 2009 and has been and is supported by Federal Reserve policy.
The idea of a person who has been fortunate enough to be able to save holding cash these last years is ridiculous and would have proven harmful to any conservative investor. ]
kievite said in reply to anne...
> are in the midst of a powerful bull market in stocks
Quality of earnings is very low.
kievite:
It might well be that 7% unemployment rate is just a smoke screen for actions that are required for completely different reason then health of US economy or labor market.
The third unstated mandate of FED is maintaining the dollar role as the world reserve currency. This role is now under attack:
- Currency swaps which allow USD avoidance became really popular even among stanch US allies (including UK and Australia)
- Settlements in Yuan increased from 0% in 2009 to 12% now.
anne said in reply to kievite...
The bull market in stocks has been running since March 2009, and the S&P index is up over 100% since then and up over 20% in the last year. Earnings may be high or low, relative to stock prices, but the gains made in stock prices have been profound and the Federal Reserve is pushing stocks policy-wise.
The point is that holding cash as opposed to say a conservative balanced stock and bond index fund has been a completely ridiculous choice and Paul Krugman really was careless or just wrong about investment opportunities.
kievite said in reply to anne...
Earnings are mainly achieved by cost cutting and layoffs.
My point is that this is a typical speculative market driven by HFT. It reflects nothing but power of HFT which is 80% of trades. That means that another gold story can happen, but this time with stocks.
As for FED "pushing stocks policy-wise" remember how they pushed home ownership.
anne said in reply to kievite...
Speculation is not investment, and it is fairly simple, as the American experience through bull and bear markets has shown, for an individual to build a conservative investment portfolio that will serve for decades. Seriously, read John Bogle who is superb and in no way interested in selling anything.
Mark A. Sadowski said in reply to kievite...
"Quality of earnings is very low."
I'm not sure if the proportion of stocks that are classified as low earnings quality is unusually high this recovery but historically high quality stocks perform better in down markets and low quality stocks perform better in up markets.
The S&P 500 rates stocks on "earnings quality" and maintains a high and a low quality stock index. You can find a copy of their report "Is High Quality Always Better?" here:
http://papers.ssrn.com/sol3/papers.cfm?abstract_id=1668756
And you can find the performance data concerning their quality indicies here:
http://us.spindices.com/indices/strategy/sp-500-high-quality-rankings-index
The S&P 500 is up 145% since its low in March 2009 and is up 24% in the past year. The S&P 500 High Quality index is up 166% since its low and is up 26% in the past year. The S&P 500 Low Quality index is up 349% since its low and is up 40% in the past year.
So both the low and high quality stock indicies have outperformed the overall index, and the low quality index has outperformed the high which is normal in an up market.
Nemo
The Fed has drawn a clear distinction between running off the cliff (ending QE) and looking down (raising rates), but market participants are just not listening.
ResistanceIsFeudal
Cinco-X
It's kinda like Ben's backstopping policy against the short traders...
Funniest part is what are commonly called 'strategies' are really just 'tactics'... the real strategy is preventing the game from lasting long enough for strategy to matter.
Sebastian
CR said:
The participation rate was probably one of the factors Fed Chairman Ben Bernanke was referring to yesterday when he said the June unemployment rate of 7.6% "probably understates the weakness of the labor market."
Say what you will about Bernanke and the Fed, but they clearly aren't as clueless (or dishonest) about what's happening in the real economy as they are typically portrayed.
Far from being a cheerleader for how great the economy is doing, Bernanke appears to have a fairly realistic view.
Comrade Troyski
7.5% is back to the worst of the 1990 recession.
Close enough!
Civilian Unemployment Rate (UNRATE) - FRED - St. Louis FedResistanceIsFeudal:
Sebastian wrote:
Far from being a cheerleader for how great the economy is doing, Bernanke appears to have a fairly realistic view.
You don't give away the hand.
Comrade Troyski
Related, one of my favorite FRED graphs:Comrade Troyski:FRED Graph - FRED - St. Louis Fed
maybe 1 person out of 100 understands this history
If we don't want a bubble economy, we've got to punish the bubble blowers.
Instead, we stand aside and let them operate their bubble machines.
Wealth creation and wealth capture are two different things, but we reward them the same in this country, or, worse even, favor the latter.
This is as fatal a flaw as anything found in Marxist-Leninist dogma.
Hedge funds crowd first-time buyers out of housing market | Marketplace.org
Marc Faber, the noted Swiss economist and investor, has voiced his concerns for the U.S. economy numerous times during recent media appearances, stating, "I think somewhere down the line we will have a massive wealth destruction. I would say that well-to-do people may lose up to 50 percent of their total wealth."
When he was asked what sort of odds he put on a global recession happening, the economist famous for his ominous predictions quickly answered . . . "100 percent."
Faber points out that this bleak outlook stems directly from Federal Reserve Chairman Ben Bernanke's policy decisions, and the continuous printing of new money, referred to as "quantitative easing" in the media.
Faber's pessimism is matched by well-respected economist and investor Peter Schiff, the CEO of Euro Pacific Capital. Schiff remarks that the stock market collapse we experienced in 2008 "wasn't the real crash. The real crash is coming."
Schiff didn't stop there. Most alarming is his belief that daily life will get dramatically worse for U.S. citizens.
... ... ...
Trump doesn't hesitate to point out America's unhealthy dependence on China. "When you're not rich, you have to go out and borrow money. We're borrowing from the Chinese and others."
It is this massive debt that worries Trump the most.
"We are going up to $16 trillion [in debt] very soon, and it's going to be a lot higher than that before he gets finished," Trump says, referring to President Barack Obama. "When you have [debt] in the $21-$22 trillion [range], you are talking about a [credit] downgrade no matter how you cut it."
In a recent appearance, Trump went to so far as to say the dollar is "going to hell."
Where Trump, Faber, and Schiff see rising debt, a falling dollar, and a plunging stock market, investment adviser and author Robert Wiedemer sees much more widespread economic destruction.
In a recent interview to talk about his New York Times best-seller Aftershock, Wiedemer says, "The data is clear, 50 percent unemployment, a 90 percent stock market drop, and 100 percent annual inflation… starting in 2013."
Editor's Note: Watch the disturbing interview with Wiedemer.Before you dismiss Wiedemer's claims as impossible or unrealistic, consider this: In 2006, Wiedemer and a team of economists accurately predicted the collapse of the U.S. housing market, equity markets, and consumer spending that almost sank the United States. They published their research in the book America's Bubble Economy.
When the interview host questioned Wiedemer's latest data, the author unapologetically displayed shocking charts backing up his allegations, and then ended his argument with, "You see, the medicine will become the poison."
The interview has become a wake-up call for those unprepared (or unwilling) to acknowledge an ugly truth: The country's financial "rescue" devised in Washington has failed miserably.
The blame lies squarely on those whose job it was to avoid the exact situation we find ourselves in, including Bernanke and former Fed Chairman Alan Greenspan, tasked with preventing financial meltdowns and keeping the nation's economy strong through monetary and credit policies.
Shocking Footage: See the eerie chart that exposes the 'unthinkable.'At one point, Wiedemer even calls out Bernanke, saying that his "money from heaven will be the path to hell."
But it's not just the grim predictions that are causing the sensation in Wiedemer's video interview. Rather, it's his comprehensive.
Zero Hedge
ekm
The way I see this:
The Fed has only mandate and one only: Maintain the USD as a world currency.
Let's see what QE has done in that regard:
1) Currency swaps between different countries and China including anglo allies like UK, Australia, thus USD avoidance
2) Yuan settlement increased from 0% in 2009 to 12% now.
Experiment is over IMO. Reverse shock is coming.
There is one mandatory factor to use a currency: Positive Real Interest Rates
Otherwise, in few years, bye bye USD
fonzannoon
I am halfway there with you ekm. I see yesterday proving two things.
1) Bernanke needs to cut purchases
2) He can't allow rates to rise
That leaves one option. Go ahead and look to cut purchases, and try to hold the bond market hostage with his comments while he does it.
This explains the move (somewhat) in crude oil, which is becoming the defacto bond vigilantee, since Bernanke can somewhat jawbone rates. I don't think a rate hike is coming by any imagination. But this bubble is going to pop somewhere.
Francis Sawyer had an excellent thought on the move in crude on another thread
Cursive
@ekm
Yes, BernanQE has boxed himself into a corner (and admitted as much last night). I'm not so sure about a rate hike to protect the USD. Central Banks love to devalue their currency.
Look at the BOJ. I think the path to protecting the USD will be military action (in addition to the many, many wars Amerika is currently fighting).
thismarketisrigged
serious question here.
why the fuck do they even release ''data'' anymore?
im being as serious as i can be. the only thing that fucking moves this market are words from fed officials, and of course when bernanke speaks.
does it really matter if jobless claims were at 5,000 or at 500,000? the market would be green anyways.
this shit is ridiculious. so predictable, we all knew that asia would be up 2-3 percent last night, followed by europe today, and of course the u.s will be up god knows how much today on words of 1 giant douchebag.
data means nothing, as we all know its simple. he keeps printing, things go up. once he stops, game is over. there is no economy.
yogibear
So far the Fed is the market.
All this talk about the market being more powerful then the central banks has been proven wrong. It just hasn't happened.
I heard countless times the Fed doesn't control the long-term rates. What does the central bank do, to control the 10 year.
fonzannoon
@thismarket
They release data because the algo bots are trained to move off of headlines, and 80% of the market is algo bots.
scatterbrains
He's going to have to print faster than the effects his printing causes oil to rise.. then with $5 gasoline everyone will find jobs.. perfect.
derek_vineyard
ben actually cited under-employment and alluded to the fallacy of the 7.6% reported rate in his to the point dovish statements.
world rates have been rising in tandem wuth the US's threat of end QE, but as we all know the race to de-base is global and the biggest player cannot exit.
i really think the taper-talk was aimed at risk asset prices (like the irrational exuberence attempt a few years pre nasdaq pop), but the actuality of servicing debt at higher rates is not acceptable and the spike in interest rates was so intense and quick the Fed realized they better clearly retract or the crisis we all know is coming would have been fast forwarded
guess the best hope is doing a Japan , but history seldom repeats exactly
Blaming the Fed for poor communication when it is the market's poor understanding of the effects from monetary policy - a crappy model, so to speak - misses the target. The markets have been proven consistently wrong in their assessments since the onset of the financial crisis (even before the crisis, when you consider it was poor pricing of securities that caused the crisis). First they fear inflation from expansionary monetary policy, then they overreact to government debt, and now they believe interest rates will skyrocket... they just aren't working with a very credible economic model. They will therefore pay a price for making trades based on poor predictions/forecasts.
Expect more howling and recriminations - it's very good entertainment.
Mark A. Sadowski said...
"By reading the article one gets the impression that the current volatility is unusual and that it is the fault of the zero interest rate policy of central banks and quantitative easing."
Here is the daily yield changes in percent for the 10-year Treasury Note (1/23/1962-7/09/2013):
http://research.stlouisfed.org/fred2/graph/?graph_id=128310&category_id=0
Now, the large expansion of the Fed balance sheet occured after 9/10/2008, QE1 was announced on 11/25/2008 and concluded on 10/31/2009, QE2 was hinted at on 8/27/2010 and concluded on 6/30/2011, Operation Twist was announced on 9/21/2011, and QE3 was hinted at on 8/31/2012. Using these dates it is possible to divide the dataset of daily 10-year Treasury Note yield changes into eight periods and calculate the standard deviation of daily yield changes for each of the periods:
Period    st.dev.
Precrisis 0.0662
PreQE1----0.1200
QE1-------0.0820
PreQE2----0.0609
QE2-------0.0647
PreMEP----0.0805
MEP-------0.0559
QE3-------0.0417
MEP refers to the Maturity Extension Program (Operation Twist).
It's true that volatility was higher than normal during 9/11/2008-11/24/2008 and during QE1 but it was lower than normal during QE2 and much lower than normal during QE3. And over the period since September 2010 the only period when bond market volatility has been above normal is when there was no QE or MEP at all.
So it seems to me that the primary source of bond market volatility is inflationistas like El-Erian who are doing all they can to encourage talk of tapering QE.
July 9, 2013 | WSJ.com
Not all rate increases are created equal. MarketWatch's Mark Hulbert explains why the recent spike in government bond interest rates may not be a death knell for the bull market.
wait, what? wrote:
rising rates don't matter to the bull market as much as they do to the real economy. as we have seen each of the past 3 years, a butterfly flapping its wings in an unforeseen direction will cause the US to slide into recession.
What Mark should be more concerned about is the size of the Fed's treasury holdings relative to US debt. QE can keep the bull market going, until the Fed is forced to stop the program. Greenspan sees the problem, why can't the FOMC?
07/09/2013 | Zero Hedge
Submitted by PeakProsperity contributing editor Gregor Macdonald
The U.S. economy weakened appreciably in the first quarter of 2013. But what if this weakness persists into the second quarter just completed, and worsens still in the second half of this year? Q1 GDP, as reported on June 26th, was revised lower to just 1.8%. And various indications suggest that Q2 could come in slightly lower still, at 1.6%. Might the U.S. economy be guiding to a long-term GDP of 1.5%? That's the rate identified by such observers as Jeremy Grantham – the rate at which we combine aging demographics, lower fertility rates, high resource costs, and the burdensome legacy of debt.
After a four-year reflationary rally in just about everything, and now with an emerging interest rate shock, the second half of 2013 appears to have more downside risk than upside. Have global stock markets started to discount this possibility?
"Gold (GLD) crashed. Japanese government bonds crashed. Emerging Markets (EEM) crashed. U.S. bonds (^TNX) crashed," Dempsey says, adding that other rate-sensitive sectors like homebuilders (XHB) and utilities (XLU) "are also reacting to spiking interest rates." As these sectors take it on the chin, the broader S&P 500 stands strong, a veritable last man standing if you will.
Despite the S&P 500's resilience, Dempsey notes larger issues do remain. The world's top two central banks are being less accommodative, with the Fed hinting that bond purchases may taper, as well as what Dempsey describes as outright "tightening" by the People's Bank of China.
"The last piece that is left here is the S&P 500," and having "not made a new high in well over a month," Dempsey believes the downside risk for the S&P 500 is very high.
And with no signs inflation on the horizon, he says the bond market has taken it upon itself to effectively "price-in five quarter-point rate increases" by pushing the yield on the 10-year Treasury up to 2.7%.
Jul 09, 2013 | Yahoo/CNNMoney
In an update to its World Economic Outlook, the IMF said Tuesday that it now expects world output to expand by just 3.1% in 2013, down from 3.3% in April. In January, it was forecasting growth of 3.5%.
The revision means the global economy will have failed to pick up pace over the past two years, although the IMF expects a slight acceleration in growth in 2014 to 3.8%.
Since its last global report in April, the IMF has cut its 2013 growth forecasts for the U.S. and China to 1.7% and 7.8%, respectively. And it now expects the eurozone economy -- mired in its longest recession -- to shrink by 0.6% this year, double the rate of contraction forecast in April.
July 8, 2013 | Economist's View
Tim Duy:
On That September Tapering, by Tim Duy: Market participants have coalesced around a September start to the tapering of quantitative easing. There are, however, a few notable exceptions, such as Bill McBride at Calculated Risk and the economics team at Bank of America Merrill Lynch, both wary that the data will support such a policy shift That puts me on the opposite side of a bet with Bill, which is something that tends to make me nervous. Kind of like the idea of playing Russian Roulette with five chambers loaded.
That said, I think September is the date to begin tapering, and the data flow would need to turn notably downward to forestall a policy shift at that time. I think it is important to recognize that the Federal Reserve is treating quantitative easing and interest rates as two very separate policies, and each has its own relevant data. From the BAML report cited by Bill:
Although the Fed has attempted to clarify its reaction function, we have become increasingly uncertain. The FOMC has zeroed in on the jobs market and to a lesser extent in reduced downside risks: both argue strongly for near-term tapering. However, the Fed's mandate is to manage the overall economy and the gap between solid jobs and weakness in other growth and inflation indicators has gotten very big ...
Exactly - quantitative easing has always been primarily about the job market and mitigating downside risks, essentially putting a floor under the economy. Indeed, the decision to initiate open-ended quantitative easing was made on the back of a bad jobs report that was subsequently revised substantially upward; I suspect that many policymakers have some buyers remorse, recognizing that without that preliminary data release, they wouldn't be struggling with the tapering issue now.
Likewise, I suspect the conversion of Operation Twist to an outright purchase program was largely about addressing potential downside risks from fiscal policy. Now such risk looks minimal, and consequently the additional asset purchases look unnecessary.
Finally, while there has been weakness in the growth and inflation indicators, it has already been entirely dismissed by policymakers. See my discussion of recent speeches by New York Federal Reserve President William Dudley. Indeed, the solid jobs report for June will only feed their idea that other data should be downplayed with regards to quantitative easing. The same, however, is not true for interest rate policy, hence why the Federal Reserve is more committed to a longer period of near zero interest rates than might have been expected given the improvement in the data they cite as reasons to scale back asset purchases.
More to the point, however, is that they are not entirely comfortable with quantitative easing and want to quickly bring the program to a conclusion. Hence the bar to ending quantitative easing is relative low now. They are more comfortable with zero interest rates, and thus have a relatively high bar for changing interest rates.
In short, to accept a September tapering as a data dependent decision, you need to accept that the data threshold is relatively low and differs from the threshold for interest rate policy. They are two separate policies. Consequently, we don't need to see substantially better data to forestall a September taper, but instead substantially worse data.
BAML raises the possibly more important issue the pace of tapering:
Three scenarios seem plausible. (1) The rest of the economy quickly converges to the employment data and the Fed starts a steady move to the exit in September. (2) The Fed decides reduced downside risks make the case for a one-time dial down in QE, so they taper in September but then pause for an extended period waiting for clear broad-based improvement. In other words, subsequent moves are more data dependent than the first. (3) The Fed decides to wait for broad confirmation in data and doesn't start tapering until December. The third option remains our base case, but clearly we are out of the consensus and September tapering is increasingly possible.
I have already argued against options 1 and 3. Option 2 is still open and fits well with the position outlined by Federal Reserve Governor Jeremy Stein, namely that as we approach the September meeting, weak economic data will be considered less important for the outcome of that meeting relative to subsequent meetings. Barring a substantial negative turn in the data, the Fed will cut the pace of asset purchases in September, but a softer data flow may reduce the magnitude of the cut and the pace of subsequent tapering.
That said, given the communication challenges the Fed faces, my guess is that they will want to avoid Option 2 and will use the upward trend of nonfarm payrolls to do so. If they come in with a small cut in September, they may set the stage for substantial financial market volatility if they then proceed with larger cuts in subsequent meetings. They won't want to be the source of such volatility. Hence why I suspect they are already on a pretty much calendar dependent path - such is the easiest path to manage market expectations. Once they begin, I expect they will trim asset purchases by roughly $15-$20 billion a meeting until they reach zero by the middle of next year.
Bottom Line: The Federal Reserve is having a difficult time convincing market participants that quantitative easing and interest rates represent two separate policy tools. They want to severe the perception that the two are connected - a reduction in the pace of asset purchases thus does not signal a change in the expected lift-off from the zero bound. Understanding that the two policies are different is, I think, key to understanding why the Fed is heading toward a September tapering despite what many view as an overall subpar economic environment.
RW (the other) said...RW (the other) said in reply to RW (the other)..."The Federal Reserve is having a difficult time convincing market participants that quantitative easing and interest rates represent two separate policy tools."
Really appreciate your nuanced assessment of Fed intent but, based on the clear majority of investment analysis I've seen to date, it doesn't make any difference what the Fed says now; i.e., even those who understand that QE and interest rates are separate policy tools will likely consider that fact irrelevant (I know I do).
IOW, whether the expectation is now that liquidity is drying up or that interest rates are going up or both comes to the same thing: sell.
Min said...[lol] but ...
http://www.thereformedbroker.com/2013/07/07/the-world-according-to-investors/kievite said..."The FOMC has zeroed in on the jobs market and to a lesser extent in reduced downside risks: both argue strongly for near-term tapering. "
No comprende. How does the jobs market argue -- strongly or not --, for near-term tapering?
ellen1910 said in reply to kievite...John Wagooner once said "Back in the Goode Olde Days, people spent uncounted hours trying to forecast the future. If they had a cat, they could try felidomancy, which is the art of using cats to predict the future. If they had feet, they could try pedomancy. Nowadays, people indulge in fedomancy, which is the art of predicting interest rates by observing the Federal Reserve Board. It's a difficult practice."
http://www.softpanorama.org/Skeptics/Financial_skeptic/Humor/financial_humor.shtmlJokes aside I think that some additional factors are important. The first is percentage of US foreign debt that is hold by foreigners. Right now it is around 50%. And printing money via quantitative easing was essentially one way to help the US government to pay the interest on this portion of the debt. That's why Putin at one point called Bernanke "a hooligan".
From this point of view current switch to "calendar action" were strange. First it provoke market panic. Second, while existence of "green shoots" in labor market (were good paying jobs are still replaced by McJobs) might be temporary, payment on the debt in a form of issuing new treasuries with higher interest rate is permanent.
My feeling is that unless creation of panic was the real intent this was a blunder and this panic again will cost a lot of money 401K investors who already were fleeced twice during the last 20 years. When Vanguard TIPs fund drops almost 8% for the year without rate change on the horizon and pretty stable inflation, something is really wrong.
kievite said in reply to ellen1910...TIPs compete with standard treasuries (USTs).
Vanguard TIPs duration is 8.5 years and is negative 8.00% ytd. A portfolio composed of 1/3 Vanguard Long-Term treasuries (15.5 years) and 2/3 Vanguard Intermediate treasuries (5.6 years) has an equivalent duration. That composite portfolio is negative 4.983% ytd. Note: The yield spread between the TIPs fund and the composite portfolio is 2.087%.
Can anyone explain why the TIPs experienced much greater losses?
If TIPs behavior was the only problem.
I for example now having trouble to explain current 10 year Treasury notes rate. I think it is reasonable to assume that the USA might never see 3.5% growth again. Let's assume that 2.5% annual growth is a "new normal" like Bill Gross suggested.
http://www.channelnewsasia.com/news/business/international/imf-cuts-us-growth/710564.htmlIt's unclear to me how 2.5% 10 year Treasuries interest rate fits this scenario. With 100% debt to GDP ration and assuming average 10 year duration, it's the same situation as with business which has 6% growth and is getting 6% loan for full net income (actually for a business it has more sense as interest payments are tax deductible).
BTW Goldman Sachs recently predicted 10 year treasuries rate at 3% at the end of the year.
http://finance.yahoo.com/blogs/talking-numbers/pimco-gross-vs-goldman-sachs-180803987.htmlThat means a start of new recession for me.
The level of underemployed workers looks bad on its face but even worse when it's not the government doing the counting.
When the Labor Department released its monthly nonfarm jobs report Friday, it was all sunshine and roses except for one glaring weakness: A big jump in the underemployment rate that includes those who have quit working as well as those who have had to take part-time jobs even though they'd rather work full-time.
That rate, which economists call the U-6, jumped from 13.8 percent in May to 14.3 percent in June-a 3.6 percent increase and indicative that the 195,000 new jobs created in the month weren't exactly of the highest caliber
But what often doesn't get as much attention is the monthly labor count that the experts at Gallup conduct. Play Video'Wake Up and Smell the Taper': Economist Michael Feroli, JPMorgan Bank, explains why he believes June's employment report will likely lead to the Fed slowing its asset-buying program in September.According to the pollster's results, the underemployment situation is even worse.
Gallup reports that 17.2 percent of the workforce is underemployed, a startling number compounded by its divergence from the government's count. While the rate is down from the 20.3 percent peak in March 2010, it has remained maddeningly high over the past three years even as economists tout the strength of the U.S. economic recovery.
From a broader perspective, the Gallup measure actually has increased from its 15.9 percent multi-year low in October 2012.
The potential significance of the recent trough is that it came a month before the Federal Reserve launched the third round of quantitative easing, the $85 billion a month bond-buying program that is supposed to help the central bank achieve its dual objectives of price stability-and full employment.
Amid questions of whether QE3 is about to come to end, and if it has been as effective as its predecessors, the underemployment rate will be one important metric to watch.
Aside from the Gallup numbers, the government's report was discouraging in its own right: A jump from 28.5 percent to 29.3 percent for the percentage of those working part-time for economic reasons in the labor force, and a year-over-year surge of 25.1 percent-1.027 million total-for those "discouraged workers" who have quit searching for jobs.
"It's a big deal. The labor market is far from healthy, so I don't want to minimize the fact" that underemployment is on the rise, said Joe LaVorgna, chief U.S. economist at Deutsche Bank.
... ... ...
"We expect labor market pressure from the spending sequester in Washington to spread from reduced hours to job cuts," Ethan Harris, global economist at Bank of America Merrill Lynch, said in a report for clients.
For now, though, LaVorgna said he is attributing the data point discrepancies to an unusual jobs climate that will out the kinks in the months ahead.
"The labor market is so far from normal that it wouldn't surprise me that all these metrics are not necessarily moving in the same direction," he said. "There's going to be some incongruity between these two series. When things normalize, you would expect these things to rectify themselves."
-By CNBC's Jeff Cox. Follow him @JeffCoxCNBCcom on Twitter.
Jul 08, 2013 | WSJ.com
That HSBC group chief economist Stephen King shares a name with a famous writer of scary stories is a coincidence that he may tire of hearing.
But it's fair to say that with his latest book, When the Money Runs Out: The End of Western Affluence, he is dabbling in the financial equivalent of the horror genre. Perhaps even scarier, his is the stuff of nonfiction.
Mr. King's thesis - outlined in an interview at The Wall Street Journal - is that we in the West are in line for a shock when we discover that the high-growth rates to which we're accustomed aren't coming back. In the U.S., we've been wrongly budgeting for a return to 3.5% average real growth rates that persisted through the second half of the 20th century - an affliction suffered by both policymakers and households that he calls an "optimism bias" - and yet even before the financial crisis destroyed trillions of dollars of wealth the economy was only clocking gains of 2.5% per year.
Forget worrying about the post-crisis onset of a Japan-style "lost decade," Mr. King says. "We have been through a lost decade already."
Among the reasons for this long-term shift to a slower potential growth rate, he cites the exhaustion of a various one-off productivity gains that boosted growth after World War II:
- the entry of women into the workforce;
- the liberalization of world trade;
- a tripling in rates of consumer credit founded on an unsustainable increase in housing prices;
- and education.
These gains are no longer to be had, he says, but policymakers are blind to that fact and so are burdening the economies of the U.S., Europe and Japan with long-term debts.
Mr. King worries that central banks are only exacerbating the problem, feeding the optimism bias by propping up financial markets with aggressive monetary policies such as the "quantitative easing" pursued by the Federal Reserve, the Bank of Japan and the Bank of England. Although QE was appropriate at the height of the crisis in 2008 and 2009, when it helped avoid a repeat of the Great Depression, it now used as means of falsely promising a return to the bygone years of strong growth, he said. As the economist put it, "QE became less of a powerful antibiotic and more of an addictive painkiller."
And whereas central bankers have viewed their accommodative policies as having modest benefits with zero costs, Mr. King finds all sorts of inefficiencies and costs from these actions. Mostly, it comes in the form of income redistribution, he said. For example, lower rates allow large U.S. corporations to borrow cheaply but in an environment of perpetually low growth they distribute the gains to shareholders via buybacks and dividends in lieu of hiring more workers. And because the holders of financial assets who benefit from such transfers tend to be wealthier individuals with a "lower propensity to consume," there's little accompanying jolt to the wider economy from their wealth gains.
This plays out in the disparity between the stock market's multiyear advance and the underperformance of the economy, which Mr. King said reflects "the growing gap between hope and economic reality."
Yahoo! Finance
Think today's bond sell-off is bad?
You ain't seen nothing yet, at least according to what Goldman Sachs says in a bombshell research note making the rounds this morning.
The investment bank says the yield on the ten year treasury will hit 4-percent by 2016. That's bad news for all bond investors, and PIMCO's Bill Gross in particular.
His flagship Total Return Fund posted its worst month in five years in May. And the continued steep sell-off in treasuries sure isn't helping matters.
But the so-called "Bond King" remains undeterred, and in a tweet over the weekend said: "1 to 2 month performance numbers are a blip on a 40-year performance history. PIMCO marches on a long-term path."
Of course, one man's pain can always be another's pleasure, and higher interest rates are attracting investors to the American greenback. The US Dollar Index traded at 84.59 at one point today, its highest in three years. Stocks have also weathered the sell-off as well. The Russell 2000 Index, a measure of small-cap companies, made a new record high today.
So, where are interest rates going next? And how high can rate go before stock investors begin to worry about higher borrowing costs? Richard Ross, Global Technical Strategist at Auerbach Grayson handles the charts while Enis Taner, Global Macro Editor at RiskReversal.com checks the fundamentals. Their answers might surprise you.
To hear Ross and Taner analyze what's next for interest rates, watch the video above.
Silence Dogood
Bill Gross is honest and a straight shooter. Goldman is only looking out for Goldman - they are borderline crooks with all the right connections in DC. I believe Gross.
patriot
Borderline crooks? LOL! Only borderline.
michaels
Funny how everyone is running for the doors dumping their bonds funds, the smart people got out of them late last year.
Pimco has to talk like the capt of the Titanic, dont worry the ship is unsinkable LOL
Mel
Pimco reports on the market, GS tries to create it.
Fillup
These stock guys have been wrong on bonds for the last 10 years. They believe everyone buys bonds from brokers and clip coupons. There is such thing as bond mutual funds that buy and sell bonds every month. When you do it right you can make money as interest rates go down and when they go up.
Brian
Bond mutual funds are impacted by the rise in interest rates in a similar manner as individual bonds are. The only difference is that the change in principal is an average of all of the bonds held in the fund based on the duration etc. I've been in that situation before with bond funds, and it is not pretty.
Maurice
fillup these stock guys are not the same ones that were around 10 years ago.those traders went broke and left the market.I have averaged over 12% per year for the past 5 years in bond mutual funds.old timers consider this format entertainment.not useful news and opinion.it is funny that they never show the track record for these experts.bill has a long history of making money for his customers.G.S.has a history of advising customers to do the oposite of what they are doing.how much has G.S.invested in bond shorts?
Fillup
Brian: Interest rates have moved up really fast and causes pain but right now I think the best thing is to hunker down at get something. I really believe China might be selling some of their treasuries. Thanks for the comment and good luck.
A Yahoo! user
GS is the king of the banksters.... and has hands inside Washington.... Gross may be right but GS controls the game, unfortunately.
January24
Here's why I don't think interest rates are going up: It's for the same reason that interest rates are low right now -- and have been for some time. People do not have the earning ability in order to qualify to borrow money to buy houses and cars.
The supposedly lower unemployment numbers are totally phony. They do not take into account the hundreds of thousands of adults who have stopped looking for jobs. Neither do they take into account the number of older adults who gave up and took early retirement.
And, finally, the government is taking advantage of a true tragedy in order to make the unemployment number look better and this is it: Many people who had full-time jobs have lost those jobs and have had to take two part-time jobs. In a cruel irony, that second part-time job counts as a new job for the purpose of the government's calculation of unemployment numbers.
The prospect of a long-term bear market in bonds is scary. I don't see any particular reason for rates to go much higher over the next year, though. The fed will hold onto the bonds they have. If they tried to sell them it would precipitate a recession.
Aug 23, 2012 | Yahoo
One of the most important stories in the U.S. economy these days is the rise of extreme inequality.
Over the past 30 years, a larger and larger portion of America's income growth has gone to those in the top 10% of incomes, and especially those in the top 1%. This is a major change from the prior 60 years, in which the top 10% and the bottom 90% shared in the income gains.
A stark and startling example of this trend is the fact that, adjusted for inflation, "average hourly earnings" in this country have not increased in 50 years.
A recent Pew study confirms that America's middle class has recently experienced a "lost decade."
Since 2000, the Pew says, "the middle class has shrunk in size, fallen backward in income and wealth, and shed some - but by no means all - of its characteristic faith in the future." Pew cites statistics showing that middle class earnings and net worth have plummeted since the mid-2000s and that about 85% of the middle class say it is harder to maintain their standard of living than it was 10 years ago.
The reason the decline of the middle class is important is not just about fairness. It's about the health of the economy as a whole.
Collectively, the middle class represents enormous buying and spending power, and in the past 60 years this spending power has helped the U.S. economy become the envy of the world.
But now, however, the middle class is increasingly strapped. And the resulting impact on spending is constraining the growth of companies that sell products and services to American consumers.
The causes of this middle-class decline are many, from globalization (jobs being shipped overseas), to the decline of private-sector unions, to the wholesale embrace of a "shareholder value" religion that values profit over everything else that companies produce. But the result of the trend can be seen vividly in two charts.
- First, wages are now at an all-time low as a percent of the economy.
- Second, corporate profits are now at an all-time high.
To truly "fix" the U.S. economy, corporations are going to have to be persuaded to invest more of their excess profits in their employees, both by hiring new employees and paying existing employees more. "Wages" to employees become spending money for those employees, and the spending produces revenue for other companies. If corporations can collectively be persuaded to reinvest more of their profits in their people, in other words, they will help restore their own revenue growth.
Henry Ford famously decided to pay his workers more than he had to to keep them. One result of this was that the workers made enough money to be able to buy Ford's cars, and this made Ford more successful. Another result, which is considered irrelevant in some business circles, is that Ford employees were able to live middle-class lives. This helped not only Ford, but the country.
Our current economic problem is not likely to be solved by the government, which possesses neither the power nor the competence to make it happen. The problem will have to be solved by the private sector. And one important part of that solution is for corporations to share more of their wealth with one very important (and often overlooked) corporate constituency: Their employees.
07/09/2013 | Zero Hedge
Submitted by PeakProsperity contributing editor Gregor Macdonald
The U.S. economy weakened appreciably in the first quarter of 2013. But what if this weakness persists into the second quarter just completed, and worsens still in the second half of this year? Q1 GDP, as reported on June 26th, was revised lower to just 1.8%. And various indications suggest that Q2 could come in slightly lower still, at 1.6%. Might the U.S. economy be guiding to a long-term GDP of 1.5%? That's the rate identified by such observers as Jeremy Grantham – the rate at which we combine aging demographics, lower fertility rates, high resource costs, and the burdensome legacy of debt.
After a four-year reflationary rally in just about everything, and now with an emerging interest rate shock, the second half of 2013 appears to have more downside risk than upside. Have global stock markets started to discount this possibility?
[Jul 09, 2013] Time to Sell? Downside Risks Rising for U.S. Stocks, Says Dempsey
"Gold (GLD) crashed. Japanese government bonds crashed. Emerging Markets (EEM) crashed. U.S. bonds (^TNX) crashed," Dempsey says, adding that other rate-sensitive sectors like homebuilders (XHB) and utilities (XLU) "are also reacting to spiking interest rates." As these sectors take it on the chin, the broader S&P 500 stands strong, a veritable last man standing if you will.
Despite the S&P 500's resilience, Dempsey notes larger issues do remain. The world's top two central banks are being less accommodative, with the Fed hinting that bond purchases may taper, as well as what Dempsey describes as outright "tightening" by the People's Bank of China.
"The last piece that is left here is the S&P 500," and having "not made a new high in well over a month," Dempsey believes the downside risk for the S&P 500 is very high.
And with no signs inflation on the horizon, he says the bond market has taken it upon itself to effectively "price-in five quarter-point rate increases" by pushing the yield on the 10-year Treasury up to 2.7%.
Jul 09, 2013 | Yahoo/CNNMoney
In an update to its World Economic Outlook, the IMF said Tuesday that it now expects world output to expand by just 3.1% in 2013, down from 3.3% in April. In January, it was forecasting growth of 3.5%.
The revision means the global economy will have failed to pick up pace over the past two years, although the IMF expects a slight acceleration in growth in 2014 to 3.8%.
Since its last global report in April, the IMF has cut its 2013 growth forecasts for the U.S. and China to 1.7% and 7.8%, respectively. And it now expects the eurozone economy -- mired in its longest recession -- to shrink by 0.6% this year, double the rate of contraction forecast in April.
July 8, 2013 | Economist's View
Tim Duy:
On That September Tapering, by Tim Duy: Market participants have coalesced around a September start to the tapering of quantitative easing. There are, however, a few notable exceptions, such as Bill McBride at Calculated Risk and the economics team at Bank of America Merrill Lynch, both wary that the data will support such a policy shift That puts me on the opposite side of a bet with Bill, which is something that tends to make me nervous. Kind of like the idea of playing Russian Roulette with five chambers loaded.
That said, I think September is the date to begin tapering, and the data flow would need to turn notably downward to forestall a policy shift at that time. I think it is important to recognize that the Federal Reserve is treating quantitative easing and interest rates as two very separate policies, and each has its own relevant data. From the BAML report cited by Bill:
Although the Fed has attempted to clarify its reaction function, we have become increasingly uncertain. The FOMC has zeroed in on the jobs market and to a lesser extent in reduced downside risks: both argue strongly for near-term tapering. However, the Fed's mandate is to manage the overall economy and the gap between solid jobs and weakness in other growth and inflation indicators has gotten very big ...
Exactly - quantitative easing has always been primarily about the job market and mitigating downside risks, essentially putting a floor under the economy. Indeed, the decision to initiate open-ended quantitative easing was made on the back of a bad jobs report that was subsequently revised substantially upward; I suspect that many policymakers have some buyers remorse, recognizing that without that preliminary data release, they wouldn't be struggling with the tapering issue now.
Likewise, I suspect the conversion of Operation Twist to an outright purchase program was largely about addressing potential downside risks from fiscal policy. Now such risk looks minimal, and consequently the additional asset purchases look unnecessary.
Finally, while there has been weakness in the growth and inflation indicators, it has already been entirely dismissed by policymakers. See my discussion of recent speeches by New York Federal Reserve President William Dudley. Indeed, the solid jobs report for June will only feed their idea that other data should be downplayed with regards to quantitative easing. The same, however, is not true for interest rate policy, hence why the Federal Reserve is more committed to a longer period of near zero interest rates than might have been expected given the improvement in the data they cite as reasons to scale back asset purchases.
More to the point, however, is that they are not entirely comfortable with quantitative easing and want to quickly bring the program to a conclusion. Hence the bar to ending quantitative easing is relative low now. They are more comfortable with zero interest rates, and thus have a relatively high bar for changing interest rates.
In short, to accept a September tapering as a data dependent decision, you need to accept that the data threshold is relatively low and differs from the threshold for interest rate policy. They are two separate policies. Consequently, we don't need to see substantially better data to forestall a September taper, but instead substantially worse data.
BAML raises the possibly more important issue the pace of tapering:
Three scenarios seem plausible. (1) The rest of the economy quickly converges to the employment data and the Fed starts a steady move to the exit in September. (2) The Fed decides reduced downside risks make the case for a one-time dial down in QE, so they taper in September but then pause for an extended period waiting for clear broad-based improvement. In other words, subsequent moves are more data dependent than the first. (3) The Fed decides to wait for broad confirmation in data and doesn't start tapering until December. The third option remains our base case, but clearly we are out of the consensus and September tapering is increasingly possible.
I have already argued against options 1 and 3. Option 2 is still open and fits well with the position outlined by Federal Reserve Governor Jeremy Stein, namely that as we approach the September meeting, weak economic data will be considered less important for the outcome of that meeting relative to subsequent meetings. Barring a substantial negative turn in the data, the Fed will cut the pace of asset purchases in September, but a softer data flow may reduce the magnitude of the cut and the pace of subsequent tapering.
That said, given the communication challenges the Fed faces, my guess is that they will want to avoid Option 2 and will use the upward trend of nonfarm payrolls to do so. If they come in with a small cut in September, they may set the stage for substantial financial market volatility if they then proceed with larger cuts in subsequent meetings. They won't want to be the source of such volatility. Hence why I suspect they are already on a pretty much calendar dependent path - such is the easiest path to manage market expectations. Once they begin, I expect they will trim asset purchases by roughly $15-$20 billion a meeting until they reach zero by the middle of next year.
Bottom Line: The Federal Reserve is having a difficult time convincing market participants that quantitative easing and interest rates represent two separate policy tools. They want to severe the perception that the two are connected - a reduction in the pace of asset purchases thus does not signal a change in the expected lift-off from the zero bound. Understanding that the two policies are different is, I think, key to understanding why the Fed is heading toward a September tapering despite what many view as an overall subpar economic environment.
RW (the other) said...RW (the other) said in reply to RW (the other)..."The Federal Reserve is having a difficult time convincing market participants that quantitative easing and interest rates represent two separate policy tools."
Really appreciate your nuanced assessment of Fed intent but, based on the clear majority of investment analysis I've seen to date, it doesn't make any difference what the Fed says now; i.e., even those who understand that QE and interest rates are separate policy tools will likely consider that fact irrelevant (I know I do).
IOW, whether the expectation is now that liquidity is drying up or that interest rates are going up or both comes to the same thing: sell.
Min said...[lol] but ...
http://www.thereformedbroker.com/2013/07/07/the-world-according-to-investors/kievite said..."The FOMC has zeroed in on the jobs market and to a lesser extent in reduced downside risks: both argue strongly for near-term tapering. "
No comprende. How does the jobs market argue -- strongly or not --, for near-term tapering?
ellen1910 said in reply to kievite...John Wagooner once said "Back in the Goode Olde Days, people spent uncounted hours trying to forecast the future. If they had a cat, they could try felidomancy, which is the art of using cats to predict the future. If they had feet, they could try pedomancy. Nowadays, people indulge in fedomancy, which is the art of predicting interest rates by observing the Federal Reserve Board. It's a difficult practice."
http://www.softpanorama.org/Skeptics/Financial_skeptic/Humor/financial_humor.shtmlJokes aside I think that some additional factors are important. The first is percentage of US foreign debt that is hold by foreigners. Right now it is around 50%. And printing money via quantitative easing was essentially one way to help the US government to pay the interest on this portion of the debt. That's why Putin at one point called Bernanke "a hooligan".
From this point of view current switch to "calendar action" were strange. First it provoke market panic. Second, while existence of "green shoots" in labor market (were good paying jobs are still replaced by McJobs) might be temporary, payment on the debt in a form of issuing new treasuries with higher interest rate is permanent.
My feeling is that unless creation of panic was the real intent this was a blunder and this panic again will cost a lot of money 401K investors who already were fleeced twice during the last 20 years. When Vanguard TIPs fund drops almost 8% for the year without rate change on the horizon and pretty stable inflation, something is really wrong.
kievite said in reply to ellen1910...TIPs compete with standard treasuries (USTs).
Vanguard TIPs duration is 8.5 years and is negative 8.00% ytd. A portfolio composed of 1/3 Vanguard Long-Term treasuries (15.5 years) and 2/3 Vanguard Intermediate treasuries (5.6 years) has an equivalent duration. That composite portfolio is negative 4.983% ytd. Note: The yield spread between the TIPs fund and the composite portfolio is 2.087%.
Can anyone explain why the TIPs experienced much greater losses?
If TIPs behavior was the only problem.
I for example now having trouble to explain current 10 year Treasury notes rate. I think it is reasonable to assume that the USA might never see 3.5% growth again. Let's assume that 2.5% annual growth is a "new normal" like Bill Gross suggested.
http://www.channelnewsasia.com/news/business/international/imf-cuts-us-growth/710564.htmlIt's unclear to me how 2.5% 10 year Treasuries interest rate fits this scenario. With 100% debt to GDP ration and assuming average 10 year duration, it's the same situation as with business which has 6% growth and is getting 6% loan for full net income (actually for a business it has more sense as interest payments are tax deductible).
BTW Goldman Sachs recently predicted 10 year treasuries rate at 3% at the end of the year.
http://finance.yahoo.com/blogs/talking-numbers/pimco-gross-vs-goldman-sachs-180803987.htmlThat means a start of new recession for me.
The level of underemployed workers looks bad on its face but even worse when it's not the government doing the counting.
When the Labor Department released its monthly nonfarm jobs report Friday, it was all sunshine and roses except for one glaring weakness: A big jump in the underemployment rate that includes those who have quit working as well as those who have had to take part-time jobs even though they'd rather work full-time.
That rate, which economists call the U-6, jumped from 13.8 percent in May to 14.3 percent in June-a 3.6 percent increase and indicative that the 195,000 new jobs created in the month weren't exactly of the highest caliber
But what often doesn't get as much attention is the monthly labor count that the experts at Gallup conduct. Play Video'Wake Up and Smell the Taper': Economist Michael Feroli, JPMorgan Bank, explains why he believes June's employment report will likely lead to the Fed slowing its asset-buying program in September.According to the pollster's results, the underemployment situation is even worse.
Gallup reports that 17.2 percent of the workforce is underemployed, a startling number compounded by its divergence from the government's count. While the rate is down from the 20.3 percent peak in March 2010, it has remained maddeningly high over the past three years even as economists tout the strength of the U.S. economic recovery.
From a broader perspective, the Gallup measure actually has increased from its 15.9 percent multi-year low in October 2012.
The potential significance of the recent trough is that it came a month before the Federal Reserve launched the third round of quantitative easing, the $85 billion a month bond-buying program that is supposed to help the central bank achieve its dual objectives of price stability-and full employment.
Amid questions of whether QE3 is about to come to end, and if it has been as effective as its predecessors, the underemployment rate will be one important metric to watch.
Aside from the Gallup numbers, the government's report was discouraging in its own right: A jump from 28.5 percent to 29.3 percent for the percentage of those working part-time for economic reasons in the labor force, and a year-over-year surge of 25.1 percent-1.027 million total-for those "discouraged workers" who have quit searching for jobs.
"It's a big deal. The labor market is far from healthy, so I don't want to minimize the fact" that underemployment is on the rise, said Joe LaVorgna, chief U.S. economist at Deutsche Bank.
... ... ...
"We expect labor market pressure from the spending sequester in Washington to spread from reduced hours to job cuts," Ethan Harris, global economist at Bank of America Merrill Lynch, said in a report for clients.
For now, though, LaVorgna said he is attributing the data point discrepancies to an unusual jobs climate that will out the kinks in the months ahead.
"The labor market is so far from normal that it wouldn't surprise me that all these metrics are not necessarily moving in the same direction," he said. "There's going to be some incongruity between these two series. When things normalize, you would expect these things to rectify themselves."
-By CNBC's Jeff Cox. Follow him @JeffCoxCNBCcom on Twitter.
That HSBC group chief economist Stephen King shares a name with a famous writer of scary stories is a coincidence that he may tire of hearing.
But it's fair to say that with his latest book, When the Money Runs Out: The End of Western Affluence, he is dabbling in the financial equivalent of the horror genre. Perhaps even scarier, his is the stuff of nonfiction.
Mr. King's thesis - outlined in an interview at The Wall Street Journal - is that we in the West are in line for a shock when we discover that the high-growth rates to which we're accustomed aren't coming back. In the U.S., we've been wrongly budgeting for a return to 3.5% average real growth rates that persisted through the second half of the 20th century - an affliction suffered by both policymakers and households that he calls an "optimism bias" - and yet even before the financial crisis destroyed trillions of dollars of wealth the economy was only clocking gains of 2.5% per year.
Forget worrying about the post-crisis onset of a Japan-style "lost decade," Mr. King says. "We have been through a lost decade already."
Among the reasons for this long-term shift to a slower potential growth rate, he cites the exhaustion of a various one-off productivity gains that boosted growth after World War II: the entry of women into the workforce; the liberalization of world trade; a tripling in rates of consumer credit founded on an unsustainable increase in housing prices; and education. These gains are no longer to be had, he says, but policymakers are blind to that fact and so are burdening the economies of the U.S., Europe and Japan with long-term debts.
Mr. King worries that central banks are only exacerbating the problem, feeding the optimism bias by propping up financial markets with aggressive monetary policies such as the "quantitative easing" pursued by the Federal Reserve, the Bank of Japan and the Bank of England. Although QE was appropriate at the height of the crisis in 2008 and 2009, when it helped avoid a repeat of the Great Depression, it now used as means of falsely promising a return to the bygone years of strong growth, he said. As the economist put it, "QE became less of a powerful antibiotic and more of an addictive painkiller."
And whereas central bankers have viewed their accommodative policies as having modest benefits with zero costs, Mr. King finds all sorts of inefficiencies and costs from these actions. Mostly, it comes in the form of income redistribution, he said. For example, lower rates allow large U.S. corporations to borrow cheaply but in an environment of perpetually low growth they distribute the gains to shareholders via buybacks and dividends in lieu of hiring more workers. And because the holders of financial assets who benefit from such transfers tend to be wealthier individuals with a "lower propensity to consume," there's little accompanying jolt to the wider economy from their wealth gains.
This plays out in the disparity between the stock market's multiyear advance and the underperformance of the economy, which Mr. King said reflects "the growing gap between hope and economic reality."
Yahoo! Finance
Think today's bond sell-off is bad?
You ain't seen nothing yet, at least according to what Goldman Sachs says in a bombshell research note making the rounds this morning.
The investment bank says the yield on the ten year treasury will hit 4-percent by 2016. That's bad news for all bond investors, and PIMCO's Bill Gross in particular.
His flagship Total Return Fund posted its worst month in five years in May. And the continued steep sell-off in treasuries sure isn't helping matters.
But the so-called "Bond King" remains undeterred, and in a tweet over the weekend said: "1 to 2 month performance numbers are a blip on a 40-year performance history. PIMCO marches on a long-term path."
Of course, one man's pain can always be another's pleasure, and higher interest rates are attracting investors to the American greenback. The US Dollar Index traded at 84.59 at one point today, its highest in three years. Stocks have also weathered the sell-off as well. The Russell 2000 Index, a measure of small-cap companies, made a new record high today.
So, where are interest rates going next? And how high can rate go before stock investors begin to worry about higher borrowing costs? Richard Ross, Global Technical Strategist at Auerbach Grayson handles the charts while Enis Taner, Global Macro Editor at RiskReversal.com checks the fundamentals. Their answers might surprise you.
To hear Ross and Taner analyze what's next for interest rates, watch the video above.
Silence Dogood
Bill Gross is honest and a straight shooter. Goldman is only looking out for Goldman - they are borderline crooks with all the right connections in DC. I believe Gross.
patriot
Borderline crooks? LOL! Only borderline.
michaels
Funny how everyone is running for the doors dumping their bonds funds, the smart people got out of them late last year.
Pimco has to talk like the capt of the Titanic, dont worry the ship is unsinkable LOL
Mel
Pimco reports on the market, GS tries to create it.
Fillup
These stock guys have been wrong on bonds for the last 10 years. They believe everyone buys bonds from brokers and clip coupons. There is such thing as bond mutual funds that buy and sell bonds every month. When you do it right you can make money as interest rates go down and when they go up.
Brian
Bond mutual funds are impacted by the rise in interest rates in a similar manner as individual bonds are. The only difference is that the change in principal is an average of all of the bonds held in the fund based on the duration etc. I've been in that situation before with bond funds, and it is not pretty.
Maurice
fillup these stock guys are not the same ones that were around 10 years ago.those traders went broke and left the market.I have averaged over 12% per year for the past 5 years in bond mutual funds.old timers consider this format entertainment.not useful news and opinion.it is funny that they never show the track record for these experts.bill has a long history of making money for his customers.G.S.has a history of advising customers to do the oposite of what they are doing.how much has G.S.invested in bond shorts?
Fillup
Brian: Interest rates have moved up really fast and causes pain but right now I think the best thing is to hunker down at get something. I really believe China might be selling some of their treasuries. Thanks for the comment and good luck.
A Yahoo! user
GS is the king of the banksters.... and has hands inside Washington.... Gross may be right but GS controls the game, unfortunately.
January24
Here's why I don't think interest rates are going up: It's for the same reason that interest rates are low right now -- and have been for some time. People do not have the earning ability in order to qualify to borrow money to buy houses and cars.
The supposedly lower unemployment numbers are totally phony. They do not take into account the hundreds of thousands of adults who have stopped looking for jobs. Neither do they take into account the number of older adults who gave up and took early retirement.
And, finally, the government is taking advantage of a true tragedy in order to make the unemployment number look better and this is it: Many people who had full-time jobs have lost those jobs and have had to take two part-time jobs. In a cruel irony, that second part-time job counts as a new job for the purpose of the government's calculation of unemployment numbers.
The prospect of a long-term bear market in bonds is scary. I don't see any particular reason for rates to go much higher over the next year, though. The fed will hold onto the bonds they have. If they tried to sell them it would precipitate a recession.
One of the most important stories in the U.S. economy these days is the rise of extreme inequality.
Over the past 30 years, a larger and larger portion of America's income growth has gone to those in the top 10% of incomes, and especially those in the top 1%. This is a major change from the prior 60 years, in which the top 10% and the bottom 90% shared in the income gains.
A stark and startling example of this trend is the fact that, adjusted for inflation, "average hourly earnings" in this country have not increased in 50 years.
A recent Pew study confirms that America's middle class has recently experienced a "lost decade."
Since 2000, the Pew says, "the middle class has shrunk in size, fallen backward in income and wealth, and shed some - but by no means all - of its characteristic faith in the future." Pew cites statistics showing that middle class earnings and net worth have plummeted since the mid-2000s and that about 85% of the middle class say it is harder to maintain their standard of living than it was 10 years ago.
The reason the decline of the middle class is important is not just about fairness. It's about the health of the economy as a whole.
Collectively, the middle class represents enormous buying and spending power, and in the past 60 years this spending power has helped the U.S. economy become the envy of the world.
[Related: 'Unintended Consequences': Former Bain Exec Sparks Controversy Over Income Inequality]
But now, however, the middle class is increasingly strapped. And the resulting impact on spending is constraining the growth of companies that sell products and services to American consumers.
The causes of this middle-class decline are many, from globalization (jobs being shipped overseas), to the decline of private-sector unions, to the wholesale embrace of a "shareholder value" religion that values profit over everything else that companies produce. But the result of the trend can be seen vividly in two charts.
- First, wages are now at an all-time low as a percent of the economy.
- Second, corporate profits are now at an all-time high.
To truly "fix" the U.S. economy, corporations are going to have to be persuaded to invest more of their excess profits in their employees, both by hiring new employees and paying existing employees more. "Wages" to employees become spending money for those employees, and the spending produces revenue for other companies. If corporations can collectively be persuaded to reinvest more of their profits in their people, in other words, they will help restore their own revenue growth.
[Related: Apple Store Workers Get 25% Raise: Company "Finally Recoginizing Value We Provide," Employee Says]
Henry Ford famously decided to pay his workers more than he had to to keep them. One result of this was that the workers made enough money to be able to buy Ford's cars, and this made Ford more successful. Another result, which is considered irrelevant in some business circles, is that Ford employees were able to live middle-class lives. This helped not only Ford, but the country.
Our current economic problem is not likely to be solved by the government, which possesses neither the power nor the competence to make it happen. The problem will have to be solved by the private sector. And one important part of that solution is for corporations to share more of their wealth with one very important (and often overlooked) corporate constituency: Their employees.
SEE ALSO: Here's How To Fix The Economy--In One Simple Chart.
More from The Daily Ticker
Why Apple's Milestone Is "Not That Amazing"
Facebook Faces Another Blow: Insider Peter Thiel Dumps His Shares
Happy Days May be Here Again: Economist Mark Zandi
Tim Duy:
On That September Tapering, by Tim Duy: Market participants have coalesced around a September start to the tapering of quantitative easing. There are, however, a few notable exceptions, such as Bill McBride at Calculated Risk and the economics team at Bank of America Merrill Lynch, both wary that the data will support such a policy shift That puts me on the opposite side of a bet with Bill, which is something that tends to make me nervous. Kind of like the idea of playing Russian Roulette with five chambers loaded.
That said, I think September is the date to begin tapering, and the data flow would need to turn notably downward to forestall a policy shift at that time.
kievite:
John Wagooner once said"Back in the Goode Olde Days, people spent uncounted hours trying to forecast the future. If they had a cat, they could try felidomancy, which is the art of using cats to predict the future. If they had feet, they could try pedomancy. Nowadays, people indulge in fedomancy, which is the art of predicting interest rates by observing the Federal Reserve Board. It's a difficult practice."
http://www.softpanorama.org/Skeptics/Financial_skeptic/Humor/financial_humor.shtml
Jokes aside I think that some additional factors are important. The first is percentage of US foreign debt that is hold by foreigners. Right now it is around 50%. And printing money via quantitative easing was essentially one way to help the US government to pay the interest on this portion of the debt. That's why Putin at one point called Bernanke "a hooligan".
From this point of view current switch to "calendar action" were strange. First it provoke market panic. Second, while existence of "green shoots" in labor market (were good paying jobs are still replaced by McJobs) might be temporary, payment on the debt in a form of issuing new treasuries with higher interest rate is permanent.
My feeling is that unless creation of panic was the real intent this was a blunder and this panic again will cost a lot of money 401K investors who already were fleeced twice during the last 20 years. When Vanguard TIPs fund drops almost 8% for the year without rate change on the horizon and pretty stable inflation, something is really wrong.
How to change your bond strategyBy Howard Gold
Jun 21, 2013 06:00:35 (ET)If you've kept your ears open, you may have heard a huge rumbling, like the earth shaking or a redwood falling in the forest.
It wasn't a natural disaster but the sound of the bond market cracking, heralding the long-awaited correction -- or end -- of a three-decade-long bull market.
Many have predicted it, and they have been either "early" or wrong. But this time there are signs it's for real.
- Federal Reserve Chairman Ben Bernanke suggested Wednesday the Fed may start unwinding its extraordinary bond buying program later this year, causing stock and bond prices to plunge.
- Some of the hottest, riskiest sectors of the bond market have sold off big lately.
- Investors who have poured money into bond funds for years are now bailing out in earnest.
The selloff in risky assets is the most telling. Last September I named long U.S. Treasurys, Treasury Inflation Protected Securities, and high-yield bonds as the market's three most overvalued assets. I could easily have added emerging-market bonds to that list.
Other beneficiaries of the yield mania -- real estate investment trusts, master limited partnerships, mortgage REITs, and business development corporations -- all have had their clocks cleaned.
Whether this is really the long-awaited end of the bond bull remains to be seen. But investors are acting as if it is, creating a self-fulfilling prophecy.
"Everybody's trying to pre-empt the Fed" by selling early, said bond maven Marilyn Cohen, CEO of Envision Capital Management in Los Angeles. "It's all part of the psychology that the Fed is going to do its evil deed sooner or later."
Last week, investors yanked a record $14.45 billion out of bond funds, EPFR Global reported, topping the previous record $12.53 billion in net outflows set the previous week. High-yield and emerging-market bond funds suffered their second biggest weekly withdrawals on record. This follows five years in which investors poured more than $1 trillion into bond funds.
"People knew it was going to happen, and then when it happens, they freak out," Cohen told me in an interview. She expects bond yields to move up over a long time.
If stocks have a 10-12% correction, said Cohen, yields on the 10-year Treasury note could fall from Thursday's high above 2.4%. But they won't hit 1.379% again, as they did last July. "I think we've seen the lows," she said.
The good news: You still have time to prepare. The key to mitigating the effects of rising rates is to lower the maturity and duration (interest rate sensitivity) of your bond holdings and set up a "ladder" of individual bonds and ETFs that mature over the next several years.
The Vanguard Short-Term Bond ETF and its mutual fund cousin track an index of corporate and government investment-grade bonds with an average maturity and duration of less than three years. The ETF yields 1.5%. (Disclosure: I own the fund.)
As I reported last week, Vanguard is moving assets in some target funds out of longer-dated TIPS and into the Vanguard Short-Term Inflation-Protected Securities Index fund (the ETF version is VTIP .) VTIP's average duration is 2.5 years, vs. a whopping 8.5 years for the traditional TIPS fund. The switch is a no-brainer.
Read Gold's take on whether investors should still buy TIPS in MoneyShow.com.
If you like high-yield bonds but want shorter maturities, the Pimco 0-5 Year High-Yield Corporate Bond ETF , with an average duration of 1.9 years, should do the trick.
For investors close to or in retirement, try a laddered portfolio of bonds or ETFs maturing over each of the next few years.
iShares has just rolled out four investment-grade bond ETFs maturing in 2016, 2018, 2020, and 2023. Splitting some of your bond money between the 2016 and 2018 funds might make sense, but since these are new, you need to do more research.
Among individual bonds, Marilyn Cohen likes AutoNation's 6 ¾% bonds maturing in April 2018, which yield 3.66%. "You want to be in an industry that is thriving, with a company that has a good CEO and profitability over the next few years," and the high-yield AN bonds fit the bill, she said.
She also likes the 6 7/8% June 2018 Arrow Electronics bonds yielding 3.24%. They're at the low end of the investment-grade scale, but in this case, boring is beautiful. "I'm not looking for excitement," said Cohen.
Nor am I -- we've had too many thrills and chills in the markets already. But something tells me the fun is just beginning again, this time in bonds.
Howard R. GoldMarketWatch@howardrgoldMoneyShow San Francisco, .
Economist's View
A Pledge To Be Responsible. by Tim Duy:
Gavyn Davies on the expectations shift:
One possibility is that the shock caused by the policy change has led to deleveraging by investors in panic selling of futures contracts. If so, the impact should reverse itself as the market calms down. But another possibility is that the markets have rationally taken the Fed statements on tapering as a signal that their thinking on monetary policy is changing. This signal of Fed intentions may be more powerful than the other forms of forward guidance they have given about their intentions.
When I read the latest speech by New York Federal Reserve President William Dudley, it seems evident to me that there has indeed been a shift in monetary policy. The key sentence is this:
Taken together, the labor market still cannot be regarded as healthy. Numerous indicators, including the behavior of labor compensation and household assessments of labor market conditions, are all consistent with the view that there remains a great deal of slack in the economy.
The Fed adopted a 7% unemployment trigger for ending quantitative easing despite full recognition that a wide array of labor market indicators reveal a persistently weak and under performing labor market. Moreover, they adopted the trigger in the face of decidedly weak inflation data. Why act to reduce accommodation when the Fed is missing so badly on both sides of its dual mandate?
realpc said...Reserve's policies are not what creates prosperity. The economy improves whenever there is a new invention that everyone wants -- steam boats, trains, bicycles, automobiles, planes, websites, etc.QE and zero interest are snake oil. And terribly damaging to older Americans who saved for retirement. And I think the pain it is creating will be felt for generations to come.
Mark A. Sadowski
Imagine a doctor who was once successful prescribing diet and exercise to a patient that is physically out of shape. The next person comes in with heart disease and he prescribes diet and exercise again. The diet and exercise school of medicine is genuinely shocked when the patient dies of a heart attack.The snake oil approach to the economy is to vigorously apply the same medicine no matter what the nature of the economic ailment.
If the primary problem of the economy were technological stagnation then policies that encourage technological innovation might be an excellent solution. But if the problem of the economy is primarily a lack of aggregate demand then the solution is probably policies that have been successfully applied in the past to generate adequate aggregate demand, such as fiscal and monetary stimulus.
Incidentally, if it was lack of innovation that caused economic depressions, how come the Great Depression is recognized as the most technologically progressive decade of the 20th century?
http://lsb.scu.edu/economics/faculty/afield/AER%20September%202003e.pdf
The Most Technologically Progressive Decade of the Century
Alexander J. Field
September 2003Abstract:
"There is now an emerging consensus that over the course of U.S. economic history, multifactor productivity grew fastest over a broad plateau between 1905 and 1966, and within that period, in the two decades following 1929. This paper argues that the bulk of the achieved productivity levels in 1948 had already been attained before full scale war mobilization in 1942. It was not principally the war that laid the foundation for postwar prosperity. It was technological progress across a broad frontier of the American economy during the 1930s."
Seeking Alpha
Reasons for the bond sell-off to continue
- Market bears say losses are just getting started because yields barely exceed inflation, leaving little relative value in bonds as the global economy improves. Fixed income was there to provide stability and yield, which it did for many years but is no longer the case. With coupons payments/yields on bonds at historic lows, bond investors are seeing little return on their money. Real yields on 10-year Treasuries, after subtracting the annual inflation rate, are just over 1 percent, compared with the 6.4 percent aggregate earnings yield of U.S. stocks, according to data compiled by Bloomberg
- Federal Reserve Chairman Ben S. Bernanke laid out possibilities for reducing the $85 billion in monthly bond purchases supporting the economy. This cut-back in central back spending will push actual and expected interest rates higher and continue to pressure bond price downwards as investors demand higher yields
- Bond funds saw $62 billion of withdrawals as money market mutual fund assets rose by $8 billion during the last month. Investors often retreat to money market mutual funds during times of financial stress, accepting lower yields compared with bonds in exchange for higher liquidity. This is a red flag for the bond market, particularly if the trend continues
Why the current fall in bond prices may only be temporary
- Bond bulls see the higher rates as a buying opportunity and current fall in prices as a temporary pull back driven by market and investor over reactions
- The bond market may receive support from financial institutions, which will need to buy as much as $5.7 trillion in safe assets including government bonds by 2020 to comply with the Dodd-Frank Act
- The impact from a reduction in the Fed's asset purchases is far too overstated. It may intact be healthy because trillions of dollars of stimulus have failed to spur much credit growth and economic activity
- Inflation, according to the Fed's markers, is around 1% and that's far from its "target" of 2% to 2.5%. So the Fed's easing may be less severe and slower than planned, particularly if the economy shows signs of slowing in the later half of the year
Yahoo! Finance
Investing in a 401(k) plan allows you to defer paying income tax on the money you save for retirement, helps automate your decision to save for retirement by having the money withheld from your paycheck and often allows workers to get valuable employer contributions. However, investing in a 401(k) plan isn't always worth it, especially if your plan has high fees, poor investment choices and no employer contributions. Here's how to tell if your employer is providing a subpar 401(k) plan:
No immediate eligibility. Ideally, you should start saving in a 401(k) plan with your first paycheck, but many employers won't let you. Only 54 percent of 401(k) plans offer immediate eligibility, according to a recent Vanguard analysis of 2,000 401(k) plans with 3 million participants. And 16 percent of 401(k) plans require workers to be with the company for an entire year before they are able to put their money in the plan. "It's sort of a legacy of when record keeping was more manual," says Jean Young, a senior research analyst for the Vanguard Center for Retirement Research. "You want to make sure that somebody is going to be with your organization before you enroll them."
[Read: 10 Trendy 401(k) Plan Perks.]
No employer contributions. Most Vanguard 401(k) plans (91 percent) offer an employer contribution. The best 401(k) plans immediately provide employer contributions to workers, but the majority of 401(k) plans impose a waiting period before new employees are eligible for a match or other company contributions. Many 401(k) plans require between one and six months (27 percent) or even an entire year of service (28 percent) before employees become eligible for a 401(k) match.
A very small match. The maximum possible match employees can get is a median of 3 percent of pay among all Vanguard 401(k) plans. The bottom quarter (24 percent) of 401(k) plans offer a maximum possible employer match of less than 3 percent. The top 15 percent of plans provide employer matches worth 6 percent or more of pay.
A match that is difficult to take advantage of. Employer contributions vary considerably by employer, with Vanguard alone administering 401(k)s with more than 200 different match formulas. Almost half (48 percent) of 401(k) plans require employees to contribute 6 percent of their pay to the 401(k) plan to capture the maximum possible 401(k) match. Other employers require workers to save between 3 and 5 percent of pay (37 percent) or at least 7 percent (11 percent) to get the entire match offered.
The exact match formula plays a role in how easy it is for employees to actually take advantage of company 401(k) contributions. The most common 401(k) match is 50 cents for each dollar contributed up to 6 percent of pay, and 24 percent of 401(k) plans use this match formula. Another 14 percent of 401(k) plans offer a multi-tier match formula such as $1 for each dollar saved on the first 3 percent of pay and 50 cents for every dollar contributed on the next 2 percent of pay. And 7 percent of plans cap the maximum amount of employer contributions workers can get.
Match formulas have the biggest impact on workers who can only afford to save a small amount. Consider a worker who is able to save 3 percent of her salary in a 401(k) plan. If her employer matches 50 cents for each dollar contributed up to 6 percent of pay, she would get 1.5 percent of her pay as a 401(k) match instead of the maximum possible match of 3 percent. If her employer instead matched dollar for dollar the first 3 percent of pay, she would be able to take advantage of the entire match offered with the same maximum potential cost to her company.
[Read: 10 Things You Should Know About Your 401(k) Plan.]
No nonmatching contributions. Some employers contribute to a 401(k) plan on behalf of employees without them having to save anything on their own, contributing a median of 4.2 percent of pay. The most generous 401(k) plans (16 percent) provide employer contributions worth 10 percent or more of worker salaries.
Long vesting schedule. Employees who leave a job before they are vested in the 401(k) plan could forfeit some or all of their employer's contributions. Only 44 percent of 401(k) plans offer immediate vesting, which means you will get to keep all of your employer's contributions whenever you leave the company. Some 401(k)s have cliff vesting schedules in which you don't get to keep any of your employer's 401(k) contributions until you have been employed by the company for a specific number of years. "If you are likely to change jobs a lot because of the nature of your career, and the company has a generous match but that is subject to a three- or five-year cliff vesting schedule, it's not likely to benefit you," says David Loeper, author of "Stop the Retirement Rip-off: How to Avoid Hidden Fees and Keep More of Your Money." Other employers have graded vesting schedules in which you get to keep a gradually increasing proportion of your employer's contributions based on your years of service - typically getting to keep the entire 401(k) match only after five or six years of service. "The employer doesn't want to invest in the employee and then have the employee up and take off," says Christopher Carosa, a retirement plan consultant and chief contributing editor of FiduciaryNews.com. "From the employee's standpoint, it's better to have immediate vesting."
Poor investment choices. The average Vanguard 401(k) plan offered 27 investment options in 2012, up from 16 in 2003, many of which were recently added target-date funds. "If you have more than 20 options it's probably not going to be a user-friendly plan," Carosa says. "It's going to put too much of the burden of deciding what to invest in on the employee." However, almost half of Vanguard 401(k) plans now offer at least four low-cost index funds that invest in U.S. equities, international equities, bonds and cash, up from a quarter in 2004. "The index core is going to have the lowest cost typically, and costs have been demonstrated to be very important in terms of predicting future outcomes," Young says.
[Read: 10 Secrets of Successful Retirement Savers.]
High fees. Most 401(k) plans charge a variety of fees ranging from record-keeping costs to expense ratios on each investment option. You want to make sure that the expenses aren't excessively high. "An easy to remember rule of thumb is to look and see who is selling the fund to the plan. If the fund is being sold by a broker or an insurance company that is working in a non-fiduciary capacity there is a good chance that you will have these excess fees," Carosa says. "You want to make sure that none of the options in the plan have 12b-1 fees or revenue sharing."
401(k) plans are now required to give all investors information explaining the fees associated with each investment option in the plan, due to new U.S. Department of Labor rules. Make sure you look at these quarterly and annual 401(k) statements, and keep costs in mind when making investment decisions. "The fee is 100 percent certain; the return is not guaranteed," Loeper says. He recommends aiming to pay no more than 75 basis points for most investments, and less than 20 basis points for index funds. "If you are paying more than three-quarters of a point," he says, "somebody is making excess profits or is gambling with your money."
June 28, 2013 |The declines in the prices of bonds and many risk assets since the Fed's policy announcements last week have followed a sharp rise in the market's expected path for US short rates in 2014 and 2015. This seems to have come as surprise to some Fed officials, who thought that their decision to taper the speed of balance sheet expansion in the next 12 months, subject to certain economic conditions, would be seen as entirely separate from their thinking on the path for short rates. Events in the past week have shown that this separation between the balance sheet and short rates has not yet been accepted by the markets.
The FOMC under Chairman Bernanke has worked very hard on its forward policy guidance, so there is probably some frustration that the markets have "misunderstood" the Fed's intentions. Richard Fisher, the President of the Dallas Fed, said that "big money does organise itself somewhat like feral hogs", suggesting that markets were deliberately trying to "break the Fed" by creating enough market turbulence to force the FOMC to continue its asset purchases.
This is dubious logic. Investors who dumped bonds after the FOMC meeting would make money if bond prices fell further. They therefore presumably want the Fed to tighten policy, which is the opposite of what Mr Fisher indicates. Nor is it right to suggest that big money "organises itself" at all; investors act in competition with each other, not in collusion.
Nevertheless, it is possible for market prices to become misaligned with the Fed's intentions on monetary policy, and that may well have happened in the past few days. The key questions are why has it happened, and what can the Fed do about it?
The extent to which short rate expectations have changed is illustrated in the first graph, which shows the path for the federal funds rate built into the futures market, before and after the recent Fed statements.
The graph shows that the Fed's warnings about likely tapering have had the effect of increasing the expected short rate in mid 2016 by about 100 basis points. This implies a fairly dramatic change in the implied probability that the Fed will tighten as early as next year. My colleague Juan Antolin Diaz has built a calculator which allows us to enter various probabilities of Fed tightening by certain dates, and it then produces a probability-weighted path for the short rate over the next few years. You can put in your own probabilities here:
In order to replicate the path which is currently built into the futures market, we need to ascribe a probability of around 30 per cent that the initial Fed tightening will happen in June 2014, and a probability of 35 per cent that it will happen in December 2014. That means that the market is probably pricing in a two-thirds probability that the Fed will tighten before the end of next year. After that, the blue line in the graph assumes that the Fed will tighten by 1.25 percentage points a year, until it reaches a "normal" short rate of 4 per cent in 2019.
These probabilities of early Fed tightening are much higher than they were before Mr Bernanke's recent interventions. The second graph shows the probabilities of initial tightening which are needed to generate the futures path today, and compares them with those collected by the New York Fed in its primary dealer opinion survey in April. The increase in the probability that tightening will start in 2014 is very apparent.
This is what has damaged asset prices, and also alarmed some Fed officials who do not think it is justified by the Fed's forward guidance. So why has it happened?
One possibility is that the shock caused by the policy change has led to deleveraging by investors in panic selling of futures contracts. If so, the impact should reverse itself as the market calms down. But another possibility is that the markets have rationally taken the Fed statements on tapering as a signal that their thinking on monetary policy is changing. This signal of Fed intentions may be more powerful than the other forms of forward guidance they have given about their intentions.
There is evidence that this signalling effect of Fed balance sheet changes might be very powerful. If the Fed is not willing to "put its money where its mouth is" by buying bonds, then the market might take its promises to hold short rates at zero less seriously than before. According to this recent research by the San Francisco Fed, it is possible that a sizeable proportion of the total effect of QE on bond yields came from these signalling effects rather than the portfolio balance effects which have usually been emphasised by the central banks.
The same could now be happening in the opposite direction. This would imply that the Fed will now need to work harder with other forms of signalling to reverse the rise in forward short rates, and get the markets to calm down. We are likely to see this in a series of speeches by dovish FOMC members, but at some point during the year-long process of tapering, the Fed might need to offer different economic thresholds to impact market thinking.
Narayana Kocherlakota, President of the Minneapolis Fed, has made some concrete suggestions this week on economic thresholds. In the present context, his most important suggestion is that the Fed should say that it will not increase the federal funds rate until the unemployment rate has fallen below 5.5 per cent, which would represent a full one percentage point reduction compared to the present 6.5 per cent threshold. This would be subject to the medium term outlook for inflation remaining below 2.5 per cent.
It is not clear that all members of the FOMC, several of whom have clearly become very worried about the reach for yield in the financial system, would be willing to go that far. But if the Fed really does want to get short rate expectations back under control, they may need to think very seriously about Mr Kocherlakota's thresholds.
Zero Hedge
...Immediate analysis of the past 6 weeks' market action would argue that in late April, both the Fed and PIMCO observed that bond markets were approaching a tipping point. Yields were too low, prices too high, both for investors' and the economy's own good. The Fed's Jeremy Stein had written a research paper outlining the risk. I, in fact, had written a March Investment Outlook outlining Governor Stein's paper, and to be fair, PIMCO had been warning of high seas for what seems like an eternity. "Never," I tweeted, "have investors reached so high for so little return. Never have investors stooped so low for so much risk." True enough, history will likely record.
It will also record however, that the risk was not only in narrow credit spreads and emerging market debt/equity markets but at the heart of the credit system itself: U.S. Treasuries. What supposedly old salts like yours truly didn't suspect was that all bonds, and yes, equities too were at risk of heeling over based upon a rather perfect storm, one that forecasters everywhere found difficult to fathom.
The forecast for bad weather as I've mentioned was becoming more rational with every increase in asset prices. If all markets were being artificially supported as PIMCO claimed and the Fed confirmed, then someday, someday that support via quantitative easing would have to be withdrawn. But the dark clouds seemed to be far off on the horizon. Investors worldwide piled on the leverage – not just in high yield or equity space – but in Treasuries as well. If the Fed (and BOJ) were going to keep writing checks at one trillion per year, then these two central banks alone might be buying 70-80% of all developed market future supply. The fear was that there might not be enough for others, not that there was too much leverage.
1) The Fed's forecast of the economy which prompted tapering panic is far too optimistic. If 7% unemployment is tapering's final port of call, we simply think that we're much further away than the Fed's compass would suggest. We argue for structural headwinds – demographic, globalization, and technology influences – that have had and will continue to have dampening effects on domestic and global growth. The Fed, we would argue, is too cyclically oriented, focusing substantially on housing prices and car sales. And speaking of housing, since mortgage rates have risen by 1½% in the last six months and the average monthly check for a new home buyer is up by 20–25% as well, then as I tweeted several weeks ago, "Mr. Chairman are you serious?" Growth will be negatively influenced.
2) Inflation, according to the Fed's own statistics is running close to a 1% pace. The Fed has told us that they "target," " target" 2% and for the next 1–2 years are willing to accept even 2½% until they reverse engines. Fed Governor Bullard of the St. Louis Fed was in our opinion correct where he dissented from the majority decision several weeks ago, citing the distant shores of 2%+ inflation and the seeming inability to even move in that direction.
3) Yields have adjusted by too much. While T.V. and the press focus on 10-year Treasuries at 2.55% as their guiding star, subjective stabs by yours truly or anyone else are difficult day to day. The technicals, as Mohamed has written, can dominate while the fundamentals are flushed to second page priorities. When analyzing the fundamentals though, I like to point to a "North Star" that is as permanent as possible within the context of current market instability. Tapering aside, if the Fed has consistently informed the market that its policy rate – Fed Funds at 25 basis points – will stay there for a substantial period of time even after the end of QE, then to my eye, Fed Funds will not increase until at least mid-2015 and even then subject to a consistently strong economy that produces 2%+ inflation. I wonder if we can get there in this decade to tell you the truth. But the beauty of this North Star Fed Funds sextant is that it can be rather directly observed in futures markets, either for Fed Funds or for Eurodollars, which are a close companion. Right now, Fed Funds futures markets are predicting a 75 basis point yield in 2015, and Eurodollars validating a similar conclusion. That would suggest a mispricing, despite the obvious caveat of professional observers that some of the 75 is a surcharge for potential volatility. In any case, if frontend curves are up to 50 basis points cheap, then intermediate curves – the 10-year Treasury – may be as much as 35 basis points too cheap. They belong in our opinion at 2.20% instead of 2.55%.
... ... ...
Tipping Point Speed Read
1) Yields and risk spreads were far too low two months ago.
2) Global markets were too levered and now they are derisking.
3) The bond market ship is not sinking. Expect low but positive returns in future years.
4) Don't panic. Yell at someone!
June 24, 2013 | RT Op-Edge
Right now all the Fed is threatening to do is, maybe, MAYBE, buy less financial bric-a-brac come the fall. Even then they will still be buying multi-billions of assorted IOUs until summer 2014. The widespread terror in financial markets this week suggests this is tantamount to the Mayan apocalypse.
Incidentally nobody has yet actually suggested the Fed will endeavour to sell the trillions of 'pick & mix' quality/questionable IOUs it has accrued in years of binge buying...that really would provoke a meltdown.
So the Fed-fuelled Bond bubble is about to pop sparking global repercussions. When the Fed gave its charges de facto 'money for nothing' traders scoured the world for enhanced yields, with a lot of cash inflating mini-bubbles in Asian assets. The Fed whisperings have provoked an emerging markets exodus which will be exacerbated by the Chinese simultaneously reining in their credit bubble. This Sino-US credit contraction pincer movement hurts financial assets. More acutely, lack of credit can severely impact the real economy as lending further dries up. The US may be able to muddle through the storm but Europe is already deep in crisis and Asia is further threatened by the China slowdown. With the Fed cash flood eventually tapering to a few isolated drops, interest rates are likely to head upwards.
The actual rise in interest rates is not the only worrying issue: the competence of traders is a worry here too. A generation of financial markets professionals with anywhere up to 15 years' experience have never encountered an environment of rising interest rates. That's why this word "tapering" has led so many traders to suffer a belief-system meltdown as they realized the security of the quantitative easing fairy was just a childish myth.
Meanwhile taxpayers have been left holding a multi-trillion dollar baby (plus ca change...!). The greatest concern is that these trillions of dollars may only have prolonged the economic agony and an inevitable bond market meltdown awaits. Once the punch bowl is finally taken away, markets could be left with a hangover of epic proportions, creating shock waves for global growth. Of course Ben Bernanke will be retired by then earning a crust on the lecture circuit...
June 18, 2013
There's been a lot of discussion of upward movements in long term interest rates. I thought it useful to consider the revisions in expectations, over time, and in context.

Figure 1: Ten year constant maturity Treasury yields (black), and expected ten year yields by vintage. Source: WSJ, June 2013 survey, St. Louis Fed FRED, NBER.Two observations:
- The path of interest rates, while higher than that implied by the December 2012 survey, is lower than the September 2012 path.
- Expected yields as of end 2015 are about the same as than those recorded at the end of the recession.
Posted by Menzie Chinn at June 18, 2013 02:15 PM
westslope
Great chart. Hints at the prowess of the Bernanke Fed. It brought down the entire yield curve but didn't leave 10-year yields stagnating below 2%.
Higher yields will drive increased US federal debt maintenance costs and that is worrying some market participants.
Inflation will stay low, below 2.5% for a long time, many many years as long as labor income stays so low. Low labor income in Europe is really bad. The mechanism I see is that labor has constrained liquidity, which lowers their natural rate of interest and with it inflation. The question I have is whether labor income will go so low that it pulls inflation into negative territory. Every low paid worker becomes a straw on the back of inflation until it breaks and falls into deflation.
A stubbornly high unemployment rate also lowers the natural rate of interest. And if it turns out as some of us say that the natural rate of unemployment has risen to at least 7%, then the natural rate of interest has shifted down even more. That shift won't become apparent to interest rates until the end of the business cycle comes near, and then we will feel another drop in the interest rates.
Inflation goes as the natural rate of interest of labor goes.Steven Kopits
Latest from Sivak. Recommended.
http://deepblue.lib.umich.edu/bitstream/handle/2027.42/98098/102947.pdf
Ricardo
It is instructive to look at the 10 year Treasury rates during previous periods of growth and previous periods of economic stagnation.
The low interest rates of today are unprecedented. The theory is that low interest rates stimulate the economy but what we observe is that since interest rates have been so low our economy has been in stagnation.
But it is also instructive to look at high interest rates such as those during the 1970s and early 1980s. This was also a period of economic stagnation.
What this seems to prove is that Knut Wicksell was essentially correct. When interest rates are held either higher than or lower than the natural rate (for prosperous periods the natural rate appears to be between 3.5% and 4.0%) there is economic dislocation.
That being the case, we see that the FED has pushed us between a rock and a hard place. Higher interest rates will be devastating to our national budget as interest payments would absorb a significant amount of the budget, probably in excess of defense spending, but keeping interest rates at the lower rate continues to create economic stagnation. There just is no good way out this mess that the command economy bureaucrats have put us in.
Spencer
US treasury yields were under 4% from 1924 to 1965.
Yes, this included the depression, but overall it was an era of above trend real GDP growth.
If you want to look at history, maybe you should go a little further back.
Our views are shaped by the 1970s-1980s era, but in the long term this was a historic anomalie.
Edward Lamber
reply to Spencer & Ricardo... IMO, Rates lower than the natural rate lower the cost for creative investment. At higher rates people are not as likely to invest in creative ventures. Higher rates make for a more conservative economy. The US economy is much more conservative in this regard since the 80's. So there is relatively little grass roots innovation going on now. Corporations command. Low rates don't lead to much widespread grass roots ventures. All that kind of investment is happening in emerging countries. Low rates now lead to bubbles. Where is the bubble now? It appears to be in emerging countries. Here is a link to a chart comparing the Fed rate to NGDP in relation to bubbles. http://www.businessinsider.com/analyst-now-that-the-cheap-money-is-coming-to-an-end-we-can-see-where-the-bubbles-are-2013-6
westslope
Comment: US employment rates are high because the structural unemployment is high. A recovering global economy and a return of interest in venture capital markets will offset that structural unemployment to some extent by a US dollar whose value declines as investment capital flows out of the USA pick up.
Question: when will Americans stop viewing Federal Reserve policy through lenses shaped by culture of 'celebrity narcissism'?
Given the mandate of the federal reserve, the Bernanke has done a great job. It is nothing short of miraculous in terms of what this US Fed has accomplished.
Ricardo
I hope I don't ruin your reputation here but I agree with you concerning the lowering of US entrepreneurial activity. I saw an article just yesterday that revealed that innovation in new business in the emerging economies has passed the US.
But I see the next bubble as stock prices. PEs are too high and taxes and regulations are sucking the life out of profits. The stock market can't sustain itself without profits no matter how much money the FED pumps into the economy.
Bruce Carman
Edward: "Inflation goes as the natural rate of interest of labor goes."
Edward is correct:
https://www.box.com/s/655bfqdsxbcgfn0d8m0r
https://www.box.com/s/bqduja958olt3fs9x0m8
https://www.box.com/s/szg9200y60guiogn92bs
The trend rates of nominal after-tax and real wages imply that rates will remain at secular lows, which is consistent with a Long Wave Trough regime.
Wages simply cannot accelerate given public and private debt service, high payroll taxes, offshoring of production and employment, competition from billions of workers in the developing world, and accelerating automation of domestic labor, including increasingly in the services sector hereafter.
Steven, WRT "peak motoring", see the following link for US auto sales and goods-producing employment per capita:
http://research.stlouisfed.org/fredgraph.png?g=jzp
Total vehicle sales per capita:
http://research.stlouisfed.org/fredgraph.png?g=jzy
Autos and light trucks per capita and nonfarm payrolls per capita:
http://research.stlouisfed.org/fredgraph.png?g=jzA
Private employment per capita (back to the level when auto sales per capita peaked and goods-producing employment commenced its secular decline coincident with deindustrialization):
http://research.stlouisfed.org/fredgraph.png?g=jzC
Not coincidentally, US auto sales per capita peaked with the secondary peak for US crude production at the price of oil at $10-$12 and the peak of valued-added goods-producing employment and the onset of deindustrialization and financialization of the economy.
2slugbaits
Ricardo says: taxes and regulations are sucking the life out of profits. The stock market can't sustain itself without profits
The FRED data says:
Corporate After Tax Profits
2008: $643.7B
2009: $1354.9B
2010: $1467.6B
2011: $1566.1B
2012: $1773.7B
But OMG...corporate profits dipped a whopping 1.9% last month and Ricardo flips out. All is lost! And it's all the fault of that commie/pinko/socialist in the White House.
Give us a break.
Menzie Chinn
westslope: I would welcome citation of any econometric analyses which back up your assertion that structural unemployment is high.
Edward Lambert
Bruce: Good charts with the CPI and wage & salary disbursements. I calculate the natural interest rate of labor with the equations of effective demand. http://effectivedemand.typepad.com/ed/2013/06/exchange-rate-between-capital-labor-a-wild-idea.html
I noticed that inflation was following the natural rate for labor and it made sense. Your charts show it too. and your reasoning shows that wages and consequently inflation will stay low. I would also add to your list that there is culture of paying low wages in business now. They have been trained to cut wages as much as possible. Fallacy of composition.
Steven Kopits
What the hell's going on in China?
http://www.zerohedge.com/news/2013-06-19/chinas-red-flags
Steven Kopits
China Panic: Overnight Rate Hits 25% Gordon Chang in Forbes
The overnight repo rate in China has just hit 25%, an indication the credit market is now frozen.
This month, liquidity tightened considerably. Two government bill auctions failed, and several banks defaulted on their interbank obligations. Overnight rates in the last few weeks surged to about 15% but had fallen back, settling in at just north of 7%. The 25% rate indicates credit is becoming unavailable.
Nothing is going right for China at the moment. In the last few hours, the HSBC Flash PMI for June came in at 48.3, down considerably from the 49.2 final reading for May. The country's problems are now starting to feed on themselves.
What the People's Bank of China , the central bank, does in the next few hours could be critical. One wrong move and defaults could roll through the country's banking system and take down struggling enterprises and debt-laden local governments.
Posted by: at June 20, 2013 07:26 AM
Bruce Carman
Steven: "What the hell's going on in China?"
See charts at the following folder:
https://www.box.com/s/mcnwyaoy4h51vn3idenq
Trillions of dollars of US and Japanese FDI since the '90s has resulted in the largest credit and fixed investment bubble in world history in China, far surpassing that of the US during the 1920s, '90s, and '00s, and Japan in the '80s.
https://www.box.com/s/ttohuy8477q04uuqicir
China's GDP in current Yuan terms has been growing at a DOUBLING TIME OF 4-5 YEARS and an implied domestic deflator rate of 8-9%.
https://www.box.com/s/9xsawsd8lg7xpae1y0xu
https://www.box.com/s/0qg903xl96e6b0yw1juc
China has grown in less than one-third the time it took the US to get to $7,000 GDP per capita from a similar starting point as the US. China has reached the "middle-income trap".
The US and Japan built out their industrial economies to $7,000 GDP per capita on the basis of oil priced at $10-$20 (constant dollar), whereas China has attempted to industrialize with oil at 3-10 times this price while growing GDP in Yuan terms at a compounding doubling time of 4-5 years.
China's runaway credit and fixed investment bubble is unprecedented in the history of the world, increasingly dependent upon FDI at 3-4% of GDP with oil imports now exceeding 50% of consumption. China is a runaway credit train heading for a sharp curve at the edge of a debt-deflationary cliff.
A decline in FDI by the US and Japan of as little as 1-1.5% equivalent of GDP in China risks a reverse multiplier effect to investment, production, and exports akin to a Great Depression-like contraction in China's GDP in a relatively short period.
What will be most remarkable is not that China crashes, which is a mathematical certainty, but that it did not occur years sooner. Demographics will exacerbate the deflationary crash in China into the '20s.
Once US supranational firms begin the process of attempting to repatriate US$'s from China's banks via the Fed's book entry custodial swaps of US Treasuries with the PBOC, and by way of the back door through Hong Kong and Singapore banks, the "giant sucking sound" of capital flight from China will be heard around the globe.
As is the historical precedent going back more than two centuries to the late 18th century, I fully expect the Chinese leadership to institute even stricter capital controls on its citizens and foreigners, seize foreigners' assets, and restrict bank withdrawals when bank runs commence.
China will not continue her post-'90s super-exponential growth rate and become a western-like mass-consumer economy with increasing imports of energy, food, and materials. China will crash and grow old before growing rich.
China is a four-letter word, "sell", but it is getting very late in the process to get one's money out, if not already too late.
dilbert dogbert
Ricardo Wrote: "There just is no good way out this mess that the command economy bureaucrats have put us in."
Did Ricardo note the mess that the Financial Industrial Complex put us in? The command economy bureaucrats are commanded by the FIC.
Ricardo
Slug,
Your aggregate analysis lumps FED monetary expansion into your numbers. Real businesses are hurting and no amount of statistical or econometric manipulation will change that. Let's just see what is ahead.
sherparick
I consider that Ricardo is communicating to us from an alternate universe, one without any links to back up his factual assertions.
The U.S. economy has no particular internal reasons to go into a recession right now, although Fiscal drag has made it very vulnerable to external shocks. It now appears about to get one from China and other members of the BRICS, as well as from the economies that rode the commodity bubble up with China (Australia, New Zealand, South Africa, and Canada come to mind). This has been the source of world economic growth since 2009. With it ending, what economic investment led demand will take its place? U.S. Housing? Rising interest rates will nip that in the bud pretty fast.
Troy
I think interest rates will rise in the second half of this year, which means that will be when stocks start to fall.
Bruce Carman
Troy: "I think interest rates will rise in the second half of this year, which means that will be when stocks start to fall."
https://www.box.com/s/lm412emuxx4tpzg9edt5
https://www.box.com/s/ks7i9g4lzj2ezyhvy68h
https://www.box.com/s/qpvvhcy08gd8gv604qwd
https://www.box.com/s/q4538hkpx6np1wrlil83
https://www.box.com/s/b8woajnhu9lql8fucptw
https://www.box.com/s/eoo9gzi7v2ndi6zfm3mf
It's very late in the cycle, margin leverage is excessive, and secular valuations remain at extremes of overvaluation against trend earnings.
We know how this ends . . .
westslope
Menzie: I can't help with an 'econometric analysis' showing higher structural unemployment.
Perhaps you can point out how econometric analysis of structural unemployment has vastly improved over the years. I recall a good number of macroeconomists suggesting that mistaken full employment targets consistently sabotaged attempts at counter-cyclical management during the 1970s and 1980s.
The failures were rather spectacular I thought (though they were excellent, wonderful opportunities for the financially literate to make gobs of money in a rather sorry zero-sum game). The failures inspired Prescott and Kydland's work on time inconsistency and ultimately inspired a number of rich OECD countries to adopt single-mandate monetary policy starting with New Zealand.
Otherwise, I conclude that structural unemployment has increased by the persistence of high unemployment rates since the 2008 mega-financial crisis, increased income disparities among American workers, persistent and what appear to be growing significant educational and skill differences between ethnic groups, on-going efforts to profit-shift/subsidize industry by American states with poor productivity, the long-term trend of market share loss by US auto manufacturers, etc.
The information technology-driven economy seems to having positive benefits for some worker groups and, at least in the near-term, disastrous consequences for other worker groups.

Bondholders in the United States alone would lose more than $1 trillion if yields leap, showing how urgent it is for governments to put their finances in order, the Bank for International Settlements said on Sunday.
"As foreign and domestic banks would be among those experiencing the losses, interest rate increases pose risks to the stability of the financial system if not executed with great care," the BIS said.
"Clear central bank communication well in advance of any moves to tighten will be critical in this regard."
Underlining the BIS's warning, U.S. bond prices slumped after Fed Chairman Ben Bernanke said on Wednesday that the U.S. central bank expected to reduce its pace of bond buying, now $85 billion a month, and cease purchases completely by mid-2014 if the economy continues to improve.
Let's start with the oldest economics joke in the book: "assume there is a housing recovery."
Ok, let's assume that.
So, applying logic, wouldn't consumers be actively buying furniture for their brand new homes, instead of furniture sales not only declining for the past year but posting the first negative print since January 2011, and the Great Financial Crisis before that?
... Because we are confused.And here are some additional thoughts on the issue of the housing recovery via Doug Kass:
I expect last week's "rally" in applications will be short lived relative to history.
Here is why:
Home affordability is overstated today when compared to the last cycle.
The bubble from 2003-2007 was all about "leverage-in-finance", I.e.: popular, exotic loan products of each period, terms, allowable DTI, documentation type, start/qualifying interest rates etc. For example, from 2003 to '05 a 5/1 interest only loan allowed 50% DTI qualifying at interest only payments. From 2006 to '07 Pay Option ARMs allowed 55% DTI at a 1.25% start rate.
This made the "cost" of buying a house HALF of what it is today.
Then when the leverage-in-finance all went away during a short period of time from late-2007 to mid-2008 house prices quickly "reset" to what people could afford to pay on a fundamental basis...30-year fixed mortgages, fully documented, 45% DTI, at a 6% interest rate.
Because 70%+ of homebuyers use mortgage loans -- and the monthly payment trumps the "purchase price" of the house with respect to purchase ability and decisioning -- then it stands to reason that the monthly payment rate of popular loan types of each period relative to house prices would determine whether or not house prices are once again bubbly.
Bottom Line: the popular loan programs during the bubble years -- which allowed for rapid and large house price appreciation -- were not 30-year fixed loans like today. Rather, exotic interest only loans, negative amortizing Pay Option ARMs and high CLTV HELOCs. Thus, comparing the "affordability" of houses using today's 30-year rates and program guidelines vs 30-year rates and guidelines from 2003 to 2007 is apples to oranges.
Based on "cost of ownership" for the 70% who need a mortgage loan to buy, CA houses are more expensive today than from 2003 to 2007. This is why first-timer buyer volume has plunged to 4-year lows recently. And if not for the incremental buyer & price pusher -- the institutional "buy and rent or flip "investor" that routinely pays 10% to 20% over the purchase price / appraised value treating a house like a high-yield bond -- present house prices cannot be supported.
On this basis, back in 2006 a $555k house "cost" as much as a $325k house does today.
June 13 | Bloomberg Video
Michelle Meyer, senior U.S. economist at Bank of America, and Robert Sinche, global strategist at Pierpont Securities Holdings LLC, talk about the outlook for the U.S. economy, markets and Federal Reserve policy. They speak with Scarlet Fu, Tom Keene and Alix Steel on Bloomberg Television's "Surveillance."
June 13 | Bloomberg Video
Bank of Israel Governor Stanley Fischer discusses the U.S. economy, Federal Reserve and Bank of Japan monetary policy, and the shekel.
He talks with Francine Lacqua and Elliott Gotkine on Bloomberg Television's "The Pulse." (Source: Bloomberg)
June 12 | Bloomberg
MD Sass Associates Chairman and CEO Martin Sass discusses bonds with Adam Johnson on Bloomberg Television's "Lunch Money." (Source: Bloomberg)
June 12 | Bloomberg
Gary Shilling, president of A. Gary Shilling & Co. and a Bloomberg View columnist, talks about Federal Reserve policy, the U.S. economy and bond market. He talks with Tom Keene and Sara Eisen on Bloomberg Television's "Surveillance." (Shilling is a Bloomberg View columnist. The opinions expressed are his own. Source: Bloomberg)
Yield for 30 bond will remain low as economy remains weak. People were living in a dream work. They went for yield. They will be world. If people look at the reality they will see disconnect. Emerging market and junk might disappoint.
Amazon.com
Charles Lewis Sizemore, CFA
Shilling is a true contrarian, June 10, 2011
Given the strong rebound in the equity markets since March 2009, "most investors believe that 2008 was simply a bad dream from which they've now awoken," starts Gary Shilling in his newly-released tome on deflation, The Age of Deleveraging. "But the optimists don't seem to realize that the good life and rapid growth that started in the early 1980s was fueled by massive financial leveraging and excessive debt, first in the global financial sector, starting in the 1970s, and later among U.S. consumers. That leverage propelled the dot-come stock bubble in the late 1990s and then the housing bubble."
Dr. Shilling has had a long and wildly successful career as an economic forecaster. Shilling was one of the few voices of reason that foresaw the busting of the Japanese bubble of the late 1980s, and he also correctly forecasted the bursting of the 1990s Internet bubble and the mid-2000s housing and financial sector bubble. I am delighted to find him on "our" side of the inflation/deflation debate.
It can be a bit lonely here in the deflation camp. Despite the fact that official CPI inflation has been tepid at best for the past three years and that retailers still have practically no pricing power, there is widespread belief that high or even hyper inflation is just around the corner due to the Federal Reserve's aggressive quantitative easing.
Essentially, the inflationist camp is making the mistake of believing that the pre-WWII Weimar German Republic is an accurate representation of our own conditions today. Why? Because it is example that is often cited in popular economics books and it is thus fresh on their minds. But a better understanding of history would tell you that 1990s Japan is a far better representation than 1920s Germany. Japan, like America, had a massive real estate and consumer spending bubble fueled by easy credit. Weimar Germany's inflationary spiral was a result of unplayable war reparations. Which would seem a closer parallel to you?
Similarly, the inflationists see confirmation that inflation is "everywhere" when they see prices for fuel and agricultural commodities rising--yet they ignore the fact that food prices have risen primarily due to supply-shock factors (i.e. exceptionally bad harvests in Russia and elsewhere due to extreme weather) and that energy prices are manipulated by both speculators and the OPEC cartel.
They simultaneously ignore the fact that retail prices of services and manufactured goods continue to fall, as do housing prices. Furthermore, the bursting of asset bubbles is virtually always followed by a long period of deflation. Gary Shilling understands this.
Shilling believes that as a result, we have a decade or more of continued deleveraging in front of us, and with it a period of lower than expected growth and deflation.
All About Deflation
On the federal deficit and its implications, Shilling writes,
"With the prospect of huge federal deficits for the next several years, why won't significant inflation follow? After all, excessive government spending is the root of inflation. Still, it's excessive only if the economy is already fully employed, as in wartime. And that's not the case now, nor is it likely in the slow economic growth years ahead. The continuing $1 trillion deficits result from a sluggish economy, which retards revenues and hypes government spending."
Ditto, Gary. Dr. Shilling, though not a demographic expert by any stretch, does understand what demographic trends imply. On the Boomers he writes,
"A saving spree in the next decade will also be encouraged by [Baby Boomer] saving. Those 79 million born between 1946 and 1964 haven't saved much, like most other Americans, and they accounted for about half the total U.S. consumer spending in the 1990s. But they need to save as they look retirement in the teeth... Postwar babies need to save not only to finance retirement but to repay debt.
The Fed's 2007 Survey of Consumer Finance found that 55 percent of households with members aged 55-64 had mortgages on their abodes and 45 percent carried credit card balances."
Yet while he sees the importance of demographics, he also misunderstands them. Shilling falls into the trap that so many others--Dr. Jeremy Siegel and Fed Chairman Ben Bernanke among them--fall into. There is this persistent belief that the retirement of the Boomers will cause a labor shortage that will lead to severe inflation. As Shilling writes,
"When [the Boomers] stop working, the supply of goods and services would fall. In retirement, they might spend less on themselves and on supporting their kids, and they might have lots of greenbacks... Nevertheless, there would not be enough goods and services to go around."
While this argument might make intuitive sense at first, it is fundamentally flawed. Outside of medical care and select few other industries, spending falls on virtually all other consumer items in retirement. Yes, the elderly still have to eat. But they buy little else that contributes meaningfully to inflation.
This is not purely an academic argument. Japan has been struggling with an aging and even declining population for years now. And Japan would love to have an inflation problem. Instead, deflation persists.
You see, supply is not the problem. In the post-industrial information and high-tech economy, supply takes care of itself. Is it expensive to hire a housekeeper? No problem, buy an iRobot Rhoomba to vacuum the carpet while you're at work. Is your tax accountant expensive? No problem, fire him and buy TurboTax.
In the modern economy, automation and technology can make a good deal of human labor obsolete. We bring in migrant labor to harvest crops because migrant labor is cheap. But if the price of migrant labor got high enough, rest assured that California farmers would use robots to pick strawberries. This is not idle conjecture; their counterparts in Japan already do.
Demand will determine if we have inflation or deflation, not supply.
Concluding Remarks
BloombergBloombergIn The Age of Deleveraging, Dr. Shilling has published a very good and very convincing body of work. A world economy dominated by deleveraging is a very different animal than a world economy dominated by an accumulation of debts.
As investors, you have to position your portfolios accordingly and -- I want to be firm on this point -- you have to adopt a tactical approach to investing. Take advantage of rallies when you see them, but be prepared to take profits. In a period of deleveraging, you win by not losing.
Interesting but not a slam dunk argument, December 21, 2010
I have mixed feelings about this book. I suspect that you will either love it or hate it if you have strong predictions of deflation or inflation, respectively. For the rest of us who aren't sure and are reading around, this is a good read but isn't entirely convincing.Let me just start by saying that Shilling points out in a number of places in the book that he is a top-down economist, predicting first the macroeconomic environment with interest rates, and then moving down to their effects on individual sectors. My trouble with this approach is that top-down theories are interesting to read about, as they lay out a framework for thinking about the economy and "what-if" scenarios... but they're known to be unreliable at predicting what will happen. This is probably why Shilling spends so much time at the beginning of the book tooting his own horn about his past predictions. Nonetheless, I hear that he has made a number of gravely inaccurate predictions as well - see for example his book on deflation from the late 90s, I believe. Anyway, past performance, even if perfect, is no guarantee of future results. (As an aside, the top-down, as opposed to the fundamental bottom-up, approach introduces many data points that can significantly skew the end result by compounding small errors along the way.
Consider that many good investors - people who actually intend to make money, as opposed to economists and academics -, like the Buffet clan, continually reiterate that no one can predict the markets, even with perfect economic information.)
Which brings me to my point: it seems to me that the case Shilling lays out isn't as strong as it may seem, even if there is a lot of supporting "evidence. ..." I feel much of this evidence is circumstantial; it's all good in isolation, but taken together it doesn't really give strong proof that the world is in a deflationary mode. Here's how he lays out the book. In general, he devotes much of the book to a history of the market and various economic environments. Now I admit it's a truly fascinating read for economic history buffs. He then launches into a very good conversation about P/E ratio compression.
He makes the common argument, which I entirely buy, that bear markets are often bear because P/Es continually compress more than earnings can grow, putting pressure on the market. Fair enough. He incorporates various comments about interest rate regimes, the earnings yield on bonds vs stocks over the last 30 yrs, and a broad conversation about what that means. He also talks about foreign countries and their economic policies, notably China and the Chinese growth myth. His conclusion, then, due to compressing P/Es and various macroeconomic factors, including low interest rates, is that deflation will rein supreme over the next 10 yrs. He then makes some investment recommendations.
All this data and analysis makes for very interesting reading, but the sum does not necessarily add up to deflation. Possibly, it adds up to a bunch of stagflation, maybe some low growth, and some p/e compression. But he somehow continually ends up with a number of 2-3% deflation per annum over 10 years that seems unjustifed by the large amount of "evidence." Along these lines, he is obsessed with the long bond and is predicting much further appreciation in bonds, stating for example that the 3.x% yield can still go down to 2.x%, for an almost 20% appreciation. However, just recently, and shortly after publication of the book, the yields on the long bond rose substantially after QE2, and there is great argument in the community about what this rise means. He ends the book by issuing some investment recommendations that seem very reasonable given his deflation hypothesis.
As someone who is on the fence and looking for more info with an open mind, this book did not convince me about the future of deflation - not even whether deflation exists now or not. I think I would have liked to have seen some more specific analysis of how QE is working (or not working) and why it's doing what it's doing compared to other inflationary or deflationary periods. But providing me with general scenarios of history and a jump to a conclusion of deflation is, while highly interesting from an academic perspective, not good enough for me to put money on, which is ultimately the point of the book.
All in all, this was an interesting read, a good history, and good theory; but an amalgam of lots of data does not necessarily end in a cogent, well-constructed argument, and it left me questioning his argument.
All this data and analysis makes for very interesting reading, but the sum does not necessarily add up to deflation. Possibly, it adds up to a bunch of stagflation, maybe some low growth, and some p/e compression. But he somehow continually ends up with a number of 2-3% deflation per annum over 10 years that seems unjustified by the large amount of "evidence." Along these lines, he is obsessed with the long bond and is predicting much further appreciation in bonds, stating for example that the 3.x% yield can still go down to 2.x%, for an almost 20% appreciation. However, just recently, and shortly after publication of the book, the yields on the long bond rose substantially after QE2, and there is great argument in the community about what this rise means. He ends the book by issuing some investment recommendations that seem very reasonable given his deflation hypothesis.
As someone who is on the fence and looking for more info with an open mind, this book did not convince me about the future of deflation - not even whether deflation exists now or not. I think I would have liked to have seen some more specific analysis of how QE is working (or not working) and why it's doing what it's doing compared to other inflationary or deflationary periods. But providing me with general scenarios of history and a jump to a conclusion of deflation is, while highly interesting from an academic perspective, not good enough for me to put money on, which is ultimately the point of the book.
All in all, this was an interesting read, a good history, and good theory; but an amalgam of lots of data does not necessarily end in a cogent, well-constructed argument, and it left me questioning his argument.
Specific long term recommendations for 2011 given, December 15, 2010I am not familiar with Schilling but he manages money and writes a newsletter from a quick perusal of his website. However, the book states that he does not yet manage money (but he is already a bit old). The book is really in three parts:
- The first third of the books deals with recommendations the author made to his clients roughly from 1988 to 2008. Clearly the author is a bit full of himself here. That is allowed because he seems to have made some good calls. I suppose the author needs to establish his track record somehow. However, most people wouldn't find this section terribly interesting. At least the author has made a decent job editing the text, which presumably originates from his newsletter. However, the section might be interesting for life-long students that want to understand the author's thought process in more detail. For those a key problem is that he only discusses his successful predictions. Maybe he has loads of predictions that didn't pan out. So while there is value in history, this section is problematic.
- The second third deals with themes that currently preoccupies the author. We are not going to see anything like the bull market which lasted from 1982 to 2000. Instead we'll get deflation. This discussion is quite interesting. However, this is a contrarian viewpoint so I would really have liked more depth and crispness in the arguments. He should also address the contents of his 1998 book called "Deflation", because if he has called "deflation" for over a decade her will lose credibility.
- The final third deals with investment recommendations for the next decade. I'm not terribly impressed by this section. Some of these recommendations are a bit naive, like don't buy antiques because they're illiquid.... Other ideas are clearly more serious, like buy consumer staples stocks. The nagging question is that I don't know if the author still keeps his best ideas exclusive to his newsletter subscribers. I would have liked the author to raise this issue himself.
The language is not very technical at all. I think most people who end up reading my review can easily read the book. Personally I find the book very verbose. He is kind of writing to a not-so-knowledgeable wealthy person. If you have some basic economics courses under your belt, some of the book will feel quite tedious.
Judging the quality of non-fiction is different from judging a novel. I really don't like the verbose style of writing, so style is equivalent to two stars. However, it is really the insights and quality of recommendations that is the important. For problems listed above that is three or four stars. So in conclusion three stars (i.e. useful if you read many books, but certainly not your first choice on the topic).
Oregonian
Old wine in new bottle August 19, 2011
Gary Shilling has been predicting deflation for the better part of two DECADES now. In the 1990s he wrote books predicting that deflation was just round the corner. A dozen inflationary years later, he is still singing the same tune. As they say, even a stopped clock will be right twice a day. He lists out his great calls over the decades. How about listing the not-so-great calls also?
Gary is most likely wrong on his recommendation for investing in Treasurys and bonds, because with interest rates at historic lows, bond prices have nowhere to go but down in the next 10 years. And he is most likely wrong on the US dollar also. Except for short-lived bear-market rallies, the US Treasurys and US Dollar will remain on a long term down trend, as will US stocks until the end of this decade.
That being said, there is some great information in the book, and some great numbers. I do agree with his recommendation to invest in rental properties. Below I quote some of his statements from the "Rent versus Buy" section in Chapter 12.
Over time, houses have sold for about 15 times (annual) rental costs. But that was in the post-World War II years when owners of rental properties expected inflation to enhance their 6.7% return - before the cost of income tax-deductible maintenance and property taxes. When house price appreciation was not expected in the aftermath of the 1930s, the norm for (annual) rentals was 10% of the house's value. In the coming deflationary years, houses and apartments may sell for closer to 10 times (annual) rentals than the 15 times norm, much less than the 20 times in the housing boom days.
Gary's analysis has shown that even with tax deductibility of mortgage interest, renting a single-family house or apartment is cheaper than home ownership, absent price appreciation. One can only imagine how things will be if the mortgage interest deduction is removed (seriously being advocated by politicians in Washington DC).
Here are some of the investments he suggests to avoid in this decade: - Commodities. - Big ticket consumer purchases. - Banks and similar financial institutions. - Credit card and other consumer lenders. - Conventional home builders and suppliers. - Commercial real estate. - Developing country stocks and bonds. - Japan.
Here are some of the investments he suggests to buy in this decade: - Treasurys and other high-quality bonds. - US dollar. - North American energy. - Health care. - Rental apartments. - Income producing securities.
12 of 12 people found the following review helpful 5.0 out of 5 stars Thought-provoking look at where the economy is likely heading April 14, 2011 By SCJ Format:Hardcover|Amazon Verified PurchaseDr. Shilling quotes Mark Twain in Chapter 1: "History doesn't repeat itself, but it does rhyme." He explains that he believes human nature changes slowly, if at all, over time which leads him to be able to make great economic calls. (Some reviewers have been troubled by his description, "great calls." I viewed them as I would a hallway of accolades leading me to a conversation with a wise economic thinker). As Sir John Templeton noted, "The four most dangerous words in investing are, "this time it's different."
So while the majority believe that an increase in the money supply will lend itself to an inflationary challenge, Dr. Shilling believes that money velocity will continue to be muted and the supply of goods, not money, will dictate the direction of prices. He espoused this belief in two of his previous books in the nineties and believes that the global recession of 2007/2008 is the tipping point. To those who disagree, he presents a strong case.
His research indicates that, in general, war is a precursor for inflation because it saps up the excess productive capacity. When the nation(s) are at peace, deflation reigns. While acknowledging that the United States has been in a war of sorts, the War on Terror, he believes that it may wind down before reaching Cold War proportions. If that happens and no other wars rise up in its place, he is confident that capacity will dictate our economic path. Too much of a good thing with too few buyers putting them (the buyers) in command.
And these buyers are not buying like they once were. The savings rate in the US is climbing again for the first time since it began its steady decline in the early eighties. He believes that over the next decade we will again see the savings rate reach double digits here.... That implies a steady increase in the savings rate of about 1 percent per year (it had fallen to 1 percent from 12 percent before it began to reverse course). Incidentally, he notes that we have a long way to go to get back to the debt to after-tax income ratio we had in the early 1980s. We were at 122 percent in 2010 -- almost double where it was back then!
In addition to foretelling a significant rise in the savings rate, he also notes that credit will be much tighter in the years ahead. His logic for this is that the bankers of yesterday's excess will become the bankers of tomorrow's thoughtfulness. There will be no more "no-doc" (liar) loans. Only the best credit risks will be extended the courtesy of borrowing and they will graciously decline since they are reeling from setbacks in the values of their homes and the uncertainty surrounding their investment portfolios. We will become a nation of risk managers!
How important will this turnabout of the American buyer of first and last resort be for the rest of the world? Dr. Shilling points out that just a 1 percent decline in US consumer spending whacks nearly three times that much off of our imports, their exports. With US moms and pops a full one-sixth of global GDP, the rest of the world will feel the change in thinking and spending.
So with exports from around the globe adversely affected, will that open an opportunity for the US to ride the back of a weak dollar and become a stronger exporter? Not according to the good doctor. He actually sees a strong dollar (the best of a bad lot and still no other option for a global reserve currency) and a very limited link between the value of the buck and real imports/exports. On the other hand, his statistical evidence points to a very strong correlation between GDP and imports/exports.
For those that believe deflation is impossible in a fiat currency system, he points to Japan as an outstanding example. Their economic output has been among the top two or three for decades and yet they have experienced a domestic demand problem tied to the deleveraging that began there in 1989. So while we fret about the threat of rising prices, Dr. Shilling believes that we will start to see falling prices in the years ahead. Little by little, the reality of deflation will set in and people will start to expect to pay less in the future and not view today's purchase as a store of value. He points to the likes of Wal-Mart lowering the prices on thousands of items in April 2010 as a US example and Ireland, Spain, and Portugal price declines in 2009 as an international one.
So while the monetarists under the spell of Milton Friedman continue to wax poetically on the dangers of a pumped up money supply, Dr. Shilling continues to croon his tune of money in the vaults doesn't matter. Show me the M2 to reserves (was 70 to 1 in early 2007 but less than 1 to 1 for the $1 trillion in new reserves as of March 2010) and I'll show you a picture of a bunch of fat-cat bankers sitting around the table smoking their stogies and counting their Bennies (Franklins, that is). There's no business like show business as bankers have learned the hard way. Their exotic Italian and British cars have been replaced with Volvos and SUVs as they have gotten back to the business of banking. They now actually read the crash tests before they buy (or loan) now. The next wreck they get into may find Uncle Sam's body shop closed. That's a chance they would rather not take -- especially since Uncle Sam bought into the businesses and will now be lending a hand in deciding what cars little Johnnie and Susie should be driving on the dangerous highways and by-ways of an international economy teetering on the brink of failure.
So with the US consumer pulling back, the banks pulling back, and Uncle Sam pulling back, how are prices going to push ahead? Dr. Shilling concludes that they won't. After reading his book carefully you may not agree but I wouldn't bet on it. Read more › Comment | Was this review helpful to you?Yes No 11 of 11 people found the following review helpful 4.0 out of 5 stars Has a really interesting chapter on the elements of deflation / inflation August 20, 2012 By Gwendally Format:PaperbackI heard Gary Shilling speak at a conference last month and his discussion of demographics was interesting and insightful so I sought out his most recent book: "The Age of Deleveraging: Investment Strategies for a Decade of Slow Growth and Deflation". This book was 500 pages long. Five hundred. I told B. I felt like I was taking a graduate level course in economic forecasting. I'm not even sure how to integrate this book into my body of knowledge, but here's my attempt.
The first 125 pages or so are on the subject of why we should listen to him. Each chapter is about triumphs in prognostication he had over the years, his "Seven Great Calls" when he predicted major economic changes. I found the history to be occasionally interesting and skimmed the chapters looking for what he considered the markers of change. The main thing he appears to do is to really dive down into the STORY that the economic indicators are telling. Look at the big picture: where are the demographics? What is the existing inventory level? What makes SENSE to happen next? I found his methods to be plausible and in line with the way I look at the world, too. Each of the many threads emerges into a tapestry if you stand back and look at the big picture. This is why I read so many threads and go for long walks to let it gel. I'm not Gary Shilling, but I don't have to be if I can listen to people who see the big picture.
The central premise of this book is that Gary Shilling sees slow growth ahead. Period. He stands with Mish Shedlock in the deflation camp (although he never mentioned Mish Shedlock.) Instead, he takes on more esteemed heroes of mine. He pooh poohs Peak Oil (we'll switch to natural gas, he says, and doesn't sound cornucopian when HE says it....) He dismisses Milton Friedman's definition of inflation "as always and everywhere a result of [excess money.]" What is money, asks Shilling? If you have a $10,000 credit line on a credit card - whether you use it or not - isn't that money? American Express cards have no limits on them... what does THAT mean to the money supply? Instead he talks about there being seven varieties of inflation/deflation:
1. Commodity 2. Wage-price 3. Financial asset 4. Tangible asset 5. Currency 6. Inflation by fiat 7. Goods and services.
I have to admit, I really liked having seven dimensions to this issue. It is far more satisfying that Friedman/Martenson/Austrian versions. It fits reality better. It's hard to hold them all in my head at once, and they often move in tandem, but they actually are NOT identical and our current world situation has allowed the effects of different parts to be teased out better. If I ever re-read this book it'll be for Chapter 8: "Chronic Worldwide Deflation". This is where he makes the case that he isn't just some cranky old man moaning about how things were better when he was young (and get off my lawn, kid!)
Chapter 9 talks a bit about what help we can expect from the Fed, IMF and Congress. It's a short chapter. (Synopsis: none.)
Chapter 10 is about the outlook for stocks. The short version there is that he expects very low earnings going forward. He pretty much stayed away from the question of whether to buy index funds or managed portfolios in a confusing way, by saying managed portfolios will do better, except most of the time they don't. He is not a fan of long-term buy and hold and hates asset reallocation strategies, too, thinking it's foolish to sell your winners to buy your losers. Far better to just buy winners low and sell them high. (D'oh, why didn't *I* think of that?) So, all in all, this chapter was pretty worthless to me. (Because every book that says, "first, start by buying a high quality stock cheap right before it goes up" is similarly worthless, although is certainly fine advice.)
Chapter 11 was his explanation of twelve investments to sell or avoid. This is worth elaborating on:
1. Big Ticket consumer purchases (because people will be more austere and expect prices to fall so they'll wait to buy.) 2. Consumer lenders (who are about to find out that "deleveraging" means that they don't get paid back) 3. Conventional home builders (demographics suck) 4. Collectibles (there's a distinct shortage of greater fools) 5. Banks (see #2) 6. Junk securities (did you notice how the lenders fared in #2 and #5) 7. Flailing companies (uh, when WERE those a good idea?) 8. Low tech equipment producers (becoming obsolete and fungible at the same time) 9. Commercial real estate (low growth = high vacancies) 10. Commodities (they're being played by speculators) 11. Chinese and other developing country stock and bonds and 12. Japanese securities.
Japanese securities were because Japan is a stagnant aging population with a serious debt problem whose heroes all die in kabuki plays (or something like that.) But the Chinese and other developing country stocks and bonds was because of currency risk and because the economy is still too dependent on exports to the First World. Until a country develops a sizable middle class that can purchase its own GDP the economy is too tied to ours, he claims, and so you just end up with the currency risk that will eat up any growth. He also thinks that China has been stimulating itself into creating too much capacity that they aren't yet using. In other words, he's expecting deflation there, too.
Instead, he suggests you buy:
- Treasuries and other high-quality bonds. (This guy loves him some long bonds. He had a unique voice on that subject and I should probably reread this section because I find myself really confused how the Long Bond could be a good investment in a 0% world. He appears to be expecting the interest rate to go still lower!)
- Income-producing securities (sort of the opposite to #7 above, I mean, duh.)
- Food and other consumer staples (because they won't be subject to people putting off buying them.)
- Small luxuries (fluffy toilet paper? Watches? Cosmetics?)
- The U.S. dollar (he made the case that no one else has anything better.)
- Investment advisers and financial planners (Wuhoo! He makes a case that we're worth our keep.)
- Factory-built housing and rental apartments (so, buy those REITS but make sure they aren't commercial, merely residential housing. Uh, good luck with that.)
- Health care. (Demographics, government unicorn funding, the thing people want above all else) 9. Productivity enhancers (because everyone wants to run their business without actual people)
- North American energy (because we're massive hogs who care not one whit about climate change and want our air conditioning RIGHT THIS MINUTE without having to negotiate with Iran for oil. Sounds like a solid bet to me.)
The pieces I find myself thinking about in new ways are 30 year treasury bonds (it comes as a surprise to me that someone LIKES those) and that emerging country growth won't be as solid a play as I was thinking. He also gave me some instruction on how to think about the Big Picture, and my brain may be ready for more on that subject after I rest up from reading this book. It was tough going at times, and he occasionally veered into stories about his days meeting with captains of industry or highly placed officials. I guess he's allowed. He's pretty proud of the job he did replumbing the house he bought in 1968 and still lives in. I found myself liking the man, much the way I like Jack Bogle and Bud Hebeler. Overall, recommended, but be prepared to skim some parts.
Gary Shilling is one of the bears December 12, 2010 By Y JIN Format:HardcoverGary Shilling called the 2008 bear market. Like most other bears he just kept calling it, in 2001, 2002, 2003, 2004, 2005, 2006, 2007, and 2008. Boom! They got it. All bears declared victory. But all bears missed the big run up. Now they all missed it again. Reading this book will not make anyone a penny.
06/13/2013
Following the 3 and 10 year auctions in the last two days, today's 30 Year $13 billion reopening completed the trifecta of ugliness, pricing at a surprisingly wide 3.355%, or three whole basis points above the When Issued, which traded at 3.324% at 1pm - the biggest tail in a long time. It was also the highest yield for a 30 Year since March 2012.
The internals were not pretty either - the Bid To Cover coming at 2.47, well below the TTM average of 2.59 but hardly the massive BTC collapse that we saw in yesterday's 10 Year.
And just like yesterday, the Directs ran for the hills taking down just 8.5%, compared to 15.2% in the past year average, Indirects taking 40.2% and 51.3% or so left for the Dealers who will be happy to stock up on some more collateral.
In the process of reaching and stooping, prices on financial assets have soared and central banks have temporarily averted a debt deflation reminiscent of the Great Depression. Their near-zero-based interest rates and QEs that have lowered carry and risk premiums have stabilized real economies, but not returned them to old normal growth rates. History will likely record that these policies were necessary oxygen generators. But the misunderstood after effects of this chemotherapy may also one day find their way into economic annals or even accepted economic theory.
Central banks – including today's superquant, Kuroda, leading the Bank of Japan – seem to believe that higher and higher asset prices produced necessarily by more and more QE check writing will inevitably stimulate real economic growth via the spillover wealth effect into consumption and real investment. That theory requires challenge if only because it doesn't seem to be working very well.
...Granted, some investors may switch from fixed income assets to higher "yielding" stocks, or from domestic to global alternatives, but much of the investment universe is segmented by accounting, demographic or personal risk preferences and only marginal amounts of money appear to shift into what seem to most are slam dunk comparisons, such as Apple stock with a 3% dividend vs. Apple bonds at 1-2% yield levels.
Because of historical and demographic asset market segmentation, then, the Fed and other central banks operative model is highly inefficient. Blood is being transfused into the system, but it lacks necessary oxygen.
In addition, there are several other important coagulants that seem to block the financial system's arteries at zero-bound interest rates and unacceptably narrow "carry" spreads:
- Zero-bound yields deprive savers of their ability to generate income which in turn limits consumption and economic growth.
- Reduced carry via duration extension or spread actually destroys business models and real economic growth. If banks, insurance and investment management companies can no longer generate sufficient "carry" to support employment infrastructures, then personnel layoffs quickly follow. With banks, net interest margins (NIM) are lowered because of "carry" compression, and then nationwide retail branches previously serving as depository magnets are closed one by one. In the U.K. for instance, Britain's four biggest banks will have eliminated 189,000 jobs by the end of this year compared to peak staffing levels, reports Bloomberg News. Investment banking, insurance, indeed the entire financial industry is now similarly threatened, which is leading to layoffs and the obsolescence of real estate office structures as well which housed a surfeit of employees.
- Zombie corporations are allowed to survive. Reminiscent of the zero-bound carry-less Japanese economy over the past few decades, low interest rates, compressed risk spreads, historically low volatility and ultra-liquidity allow marginal corporations to keep on living. Schumpeter would be shocked at this perversion of capitalism, which is allowing profits to be more than "temporary" at zombie institutions. Real growth is stunted in the process.
- When ROIs or carry in the real economy are too low, corporations resort to financial engineering as opposed to R&D and productive investment. This idea is far too complicated for an Investment Outlook footnote – it deserves expansion in future editions – but in the meantime, look at it this way: Apple has hundreds of billions of cash that is not being invested in future production, but returned via dividends and stock buybacks. Apple is not unique as shown in Chart 1. Western corporations seem focused more on returning capital as opposed to investing it. Low ROIs fostered by central bank policies in financial markets seem to have increasingly negative influences on investment and real growth.
- Credit expansion in the private economy is restricted by an expanding Fed balance sheet and the limits on Treasury "repo." Again, too complicated for a sidebar Investment Outlook discussion, but the ability of private credit markets to deliver oxygen to the real economy is being hampered because most new Treasuries wind up in the dungeon of the Fed's balance sheet where they cannot be expanded, lent out and rehypothecated to foster private credit growth. I have previously suggested that the Fed (and other central banks) are where bad bonds go to die. Low yielding Treasuries fit that description and once there, they expire, being no longer available for credit expansion in the private economy.
Well, there is my still incomplete thesis which when summed up would be this: Low yields, low carry, future low expected returns have increasingly negative effects on the real economy. Granted, Chairman Bernanke has frequently admitted as much but cites the hopeful conclusion that once real growth has been restored to "old normal", then the financial markets can return to those historical levels of yields, carry, volatility and liquidity premiums that investors yearn for. Sacrifice now, he lectures investors, in order to prosper later.
Well it's been five years Mr. Chairman and the real economy has not once over a 12-month period of time grown faster than 2.5%. Perhaps, in addition to a fiscally confused Washington, it's your policies that may be now part of the problem rather than the solution. Perhaps the beating heart is pumping anemic, even destructively leukemic blood through the system. Perhaps zero-bound interest rates and quantitative easing programs are becoming as much of the problem as the solution. Perhaps when yields, carry and expected returns on financial and real assets become so low, then risk-taking investors turn inward and more conservative as opposed to outward and more risk seeking. Perhaps financial markets and real economic growth are more at risk than your calm demeanor would convey.
Wounded heart you cannot save … you from yourself. More and more debt cannot cure a debt crisis unless it generates real growth. Your beating heart is now arrhythmic and pumping deoxygenated blood. Investors should look for a pacemaker to follow a less risky, lower returning, but more life sustaining path.
The Wounded Heart Speed Read
- Financial markets require "carry" to pump oxygen to the real economy.
- Carry is compressed – yields, spreads and volatility are near or at historical lows.
- The Fed's QE plan assumes higher asset prices will revigorate growth.
- It doesn't seem to be working.
- Reduce risk/carry related assets.
Jan 2, 2013 | Yahoo! Finance:
The main risk is that if interest rates climb as the economy grows, current bond yields are so low that they offer little cushion. Bond prices decline as interest rates rise.
That's making it more dangerous to embrace higher-yielding assets in a bid for income, as investors have done since the U.S. financial crisis, said managers of some of investment researcher Morningstar Inc.'s highest-ranked bond mutual funds.
Investors nowadays are better off in funds that are less sensitive to rate rises, or in global bonds where currency gains against the U.S. dollar can boost returns, they said.
""The good returns in the bond market are in the rearview mirror," said Ken Volpert, head of Vanguard Group's taxable bond group and co-manager of the Vanguard Total Bond Market Index Fund (VBMFX), which added 4% in 2012. "Investors would be wise to be cautious about reaching for yield" in either lower-rated or longer-term debt, he added.
Fund managers are fairly sanguine on the U.S. economic outlook, so expressed little love for Treasury bonds or anything else considered insurance against a downturn.
Corporate bonds remain attractive, though fund managers suggest shorter-term commitments and to be highly diversified. Taxable-bond mutual funds rose more than 8% in 2012 on average, while comparable exchange-traded funds gained about 7%, according to preliminary Morningstar data.
U.S. dollar-based investors also need to consider debt of countries and companies worldwide. Emerging-markets bond funds were standouts in 2012, rising 18.1% on average. The world bond category gained 7.2%; tiny Chou Income Fund (CHOIX) led this group and all taxable-bond funds in 2012 with a gain of 34.9%. Read more: Be choosy about international stock funds in 2013.
As for high-yield, the category is riskier now that yields on such lower-quality bonds have fallen so much. The average high-yield bond fund soared 14.6% in 2012.
High-yield funds extended gains of the prior three years. But the category's benchmark index's effective yield is now 6.24% - not what many investors would consider particularly high. Read story on junk bond yields, fund outflows.
Also, more investors in all tax brackets should consider municipal bonds, because they offer some of the best values regardless of the outcome of the debate in Washington over taxes. Read more: Muni bonds may be money makers in 2013.
Still, yields remain not much above all-time lows in some sectors, while the gap between benchmark Treasury rates and other securities has already narrowed, reducing the chance for a lot of price appreciation to boost returns. It may be a better rule of thumb now to look at the yield on a security or a fund and consider that to be the likely return.
"We've tried to caution clients about their expectations for bond returns," said Ford O'Neil, co-manager of Fidelity Total Bond Fund (FTBFX), an intermediate-term offering that gained 6.5% in 2012.
Corporate bonds of all maturities returned more than 10% for the year, continuing the group's solid gains of the prior two years, according to an index compiled by Bank of America Merrill Lynch. But the effective yield on the index is now 2.75%.
Treasury bonds of all maturities eked out a 2.3% gain in 2012, according to Bank of America. The effective yield is about 0.94%.
"Expectations now have to be for much more modest returns" of between zero- to 4%, O'Neil said.
Look out for the economic outlook
Even as the U.S. economy is expected to grow around 2% in the coming year, the Federal Reserve has said it will buy Treasury and mortgage-backed securities every month and keep interest rates low for another few years possibly, which will keep U.S. government and MBS rates too thin to be attractive for most funds.
Some managers said the only real purpose of holding Treasurys will be as a buffer against the possibility of notably slower growth or recession. But that's not a consensus view, even considering that less government spending and higher taxes are inevitable - it's only a question of how much.
"Our longer-term, secular view is that we're in a low-rate environment for the rest of our lives," said Michael Collins, senior investment officer at Prudential Fixed Income and co-manager of the Prudential Total Return Bond Fund (PDBAX), which rose 9.6% in 2012.
Long Government bond funds rose 6.2% in 2012. Benchmark rates can and probably will rise, but 10-year Treasury yields (ICAP.SD:10_YEAR) should range from 1.5% to 3.5% for the next five to 10 years, Collins said. The yield on the benchmark bond ended the year at 1.76%. Read: Treasury yields end 2012 at lowest in decades.
"The only reason to own government debt is just in case things get ugly over the next year or so, as an insurance policy," Collins said. "That's a really low probability."
Credit: stay short
Managers still see the sweetest spots within the corporate bond market, but stress that investors can't rely on a broad rally. Moreover, the extra yield investors demand to own debt other than Treasurys - called the "yield spread" - is closer to its long-term average and unlikely to tighten much more.
"Investment-grade returns are going to be much more driven by the general level of interest rates, the coupon, and not a lot of spread tightening," said Matt Eagan, co-manager of Loomis Sayles Investment Grade Bond Fund (LIGRX), which gained 12% in 2012.
Investors also have to watch out for the sensitivity of their fund to changes in interest rates. One factor is the maturity of the bond: the longer-term the debt is, the harder it's hit by a rise in rates. A measure of that sensitivity to interest-rate swings is called "duration." Collins said a bond fund with a duration of around 4.5 years cushions an investor from changes in Treasury rates.
Top-flight corporate bonds - AA and even A-rated, will closely track Treasury yields, Collins said, so he prefers slightly lower-rated debt.
"The best place to be is very defensive and very short-term," added Vanguard's Volpert. Within his firm's stable, he pointed to Vanguard Short-Term Corporate Bond ETF (VCSH) or Vanguard Short-Term Investment-Grade Fund (VFSTX) .
Go global
Bond managers increasingly see better returns outside of the U.S. Other countries' sovereign debt can carry higher rates and be just as safe as the U.S. - if not in a better economic and fiscal position. However, investors need to be especially aware of currency risk. World Bond funds that Morningstar tracks gained 7.2% on average in 2012.
Loomis Sayles' Eagan highlighted European corporate debt, as the euro zone has "turned a corner" in making the fiscal and monetary policy changes to confront its sovereign debt problems.
Money may even shift out of core countries, like Germany, to peripheral euro-zone countries that have been under attack, supporting those bond markets, he said.
Eagan also favors emerging-market debt, which offers higher yields and a chance of an appreciating currency. He is bullish on Mexico, Malaysia, Chile and Brazil.
Prudential's Collins also noted emerging-market and foreign bonds, but would avoid government debt, especially of Germany and Japan - extremely low-yielding markets with a lot of central-bank intervention that likely will keep rates low.
Linked to bonds
As for speculative-grade debt - rated BB+ or lower by Standard & Poor's - while some may find it hard to call them "high-yield" bonds, many of these companies are in good fundamental shape.
"Credit quality is improving as they build capital, and spreads are still wider," giving room for a rally, Collins said, though he cautions that if the economy slows, lower-rated debt tends to underperform.
Overall, it doesn't mean investors should completely shift out of fixed income just because rates are expected to rise. There are still plenty of risks out there to buoy bonds, chief among them the U.S. fiscal problems, Europe's debt and China's growth outlook.
"Many of the reason yields are here today still exist," Fidelity's O'Neil said. "Because of that, there are a lot of benefits to having an asset class that pays income and provides diversification and conservation of principal."
Deborah Levine is a MarketWatch reporter, based in San Francisco. Follow her on Twitter @dlevineMW.
Blackhalo
Cinco-X wrote:
Telegraphing your punches is almost always a bad idea.
The market is now the Fed's adversary? I think Ben's practice of giving the market at least 6 months notice, is one of the smarter things he does.
"Is the explanation as to why markets fell - a drop of 2% or worse is something that has happened literally 1000s of times previously - accurate? Was the 675th worst one day (2.34%) Dow selloff in history all about the Fed's taper of their bond purchases?"
Society
Groupthink : Two Party System as Polyarchy : Corruption of Regulators : Bureaucracies : Understanding Micromanagers and Control Freaks : Toxic Managers : Harvard Mafia : Diplomatic Communication : Surviving a Bad Performance Review : Insufficient Retirement Funds as Immanent Problem of Neoliberal Regime : PseudoScience : Who Rules America : Neoliberalism : The Iron Law of Oligarchy : Libertarian Philosophy
Quotes
War and Peace : Skeptical Finance : John Kenneth Galbraith :Talleyrand : Oscar Wilde : Otto Von Bismarck : Keynes : George Carlin : Skeptics : Propaganda : SE quotes : Language Design and Programming Quotes : Random IT-related quotes : Somerset Maugham : Marcus Aurelius : Kurt Vonnegut : Eric Hoffer : Winston Churchill : Napoleon Bonaparte : Ambrose Bierce : Bernard Shaw : Mark Twain Quotes
Bulletin:
Vol 25, No.12 (December, 2013) Rational Fools vs. Efficient Crooks The efficient markets hypothesis : Political Skeptic Bulletin, 2013 : Unemployment Bulletin, 2010 : Vol 23, No.10 (October, 2011) An observation about corporate security departments : Slightly Skeptical Euromaydan Chronicles, June 2014 : Greenspan legacy bulletin, 2008 : Vol 25, No.10 (October, 2013) Cryptolocker Trojan (Win32/Crilock.A) : Vol 25, No.08 (August, 2013) Cloud providers as intelligence collection hubs : Financial Humor Bulletin, 2010 : Inequality Bulletin, 2009 : Financial Humor Bulletin, 2008 : Copyleft Problems Bulletin, 2004 : Financial Humor Bulletin, 2011 : Energy Bulletin, 2010 : Malware Protection Bulletin, 2010 : Vol 26, No.1 (January, 2013) Object-Oriented Cult : Political Skeptic Bulletin, 2011 : Vol 23, No.11 (November, 2011) Softpanorama classification of sysadmin horror stories : Vol 25, No.05 (May, 2013) Corporate bullshit as a communication method : Vol 25, No.06 (June, 2013) A Note on the Relationship of Brooks Law and Conway Law
History:
Fifty glorious years (1950-2000): the triumph of the US computer engineering : Donald Knuth : TAoCP and its Influence of Computer Science : Richard Stallman : Linus Torvalds : Larry Wall : John K. Ousterhout : CTSS : Multix OS Unix History : Unix shell history : VI editor : History of pipes concept : Solaris : MS DOS : Programming Languages History : PL/1 : Simula 67 : C : History of GCC development : Scripting Languages : Perl history : OS History : Mail : DNS : SSH : CPU Instruction Sets : SPARC systems 1987-2006 : Norton Commander : Norton Utilities : Norton Ghost : Frontpage history : Malware Defense History : GNU Screen : OSS early history
Classic books:
The Peter Principle : Parkinson Law : 1984 : The Mythical Man-Month : How to Solve It by George Polya : The Art of Computer Programming : The Elements of Programming Style : The Unix Hater’s Handbook : The Jargon file : The True Believer : Programming Pearls : The Good Soldier Svejk : The Power Elite
Most popular humor pages:
Manifest of the Softpanorama IT Slacker Society : Ten Commandments of the IT Slackers Society : Computer Humor Collection : BSD Logo Story : The Cuckoo's Egg : IT Slang : C++ Humor : ARE YOU A BBS ADDICT? : The Perl Purity Test : Object oriented programmers of all nations : Financial Humor : Financial Humor Bulletin, 2008 : Financial Humor Bulletin, 2010 : The Most Comprehensive Collection of Editor-related Humor : Programming Language Humor : Goldman Sachs related humor : Greenspan humor : C Humor : Scripting Humor : Real Programmers Humor : Web Humor : GPL-related Humor : OFM Humor : Politically Incorrect Humor : IDS Humor : "Linux Sucks" Humor : Russian Musical Humor : Best Russian Programmer Humor : Microsoft plans to buy Catholic Church : Richard Stallman Related Humor : Admin Humor : Perl-related Humor : Linus Torvalds Related humor : PseudoScience Related Humor : Networking Humor : Shell Humor : Financial Humor Bulletin, 2011 : Financial Humor Bulletin, 2012 : Financial Humor Bulletin, 2013 : Java Humor : Software Engineering Humor : Sun Solaris Related Humor : Education Humor : IBM Humor : Assembler-related Humor : VIM Humor : Computer Viruses Humor : Bright tomorrow is rescheduled to a day after tomorrow : Classic Computer Humor
The Last but not Least Technology is dominated by two types of people: those who understand what they do not manage and those who manage what they do not understand ~Archibald Putt. Ph.D
Copyright © 1996-2021 by Softpanorama Society. www.softpanorama.org was initially created as a service to the (now defunct) UN Sustainable Development Networking Programme (SDNP) without any remuneration. This document is an industrial compilation designed and created exclusively for educational use and is distributed under the Softpanorama Content License. Original materials copyright belong to respective owners. Quotes are made for educational purposes only in compliance with the fair use doctrine.
FAIR USE NOTICE This site contains copyrighted material the use of which has not always been specifically authorized by the copyright owner. We are making such material available to advance understanding of computer science, IT technology, economic, scientific, and social issues. We believe this constitutes a 'fair use' of any such copyrighted material as provided by section 107 of the US Copyright Law according to which such material can be distributed without profit exclusively for research and educational purposes.
This is a Spartan WHYFF (We Help You For Free) site written by people for whom English is not a native language. Grammar and spelling errors should be expected. The site contain some broken links as it develops like a living tree...
|
|
You can use PayPal to to buy a cup of coffee for authors of this site |
Disclaimer:
The statements, views and opinions presented on this web page are those of the author (or referenced source) and are not endorsed by, nor do they necessarily reflect, the opinions of the Softpanorama society. We do not warrant the correctness of the information provided or its fitness for any purpose. The site uses AdSense so you need to be aware of Google privacy policy. You you do not want to be tracked by Google please disable Javascript for this site. This site is perfectly usable without Javascript.
Last modified: March, 12, 2019