|
|
Home | Switchboard | Unix Administration | Red Hat | TCP/IP Networks | Neoliberalism | Toxic Managers |
| (slightly skeptical) Educational society promoting "Back to basics" movement against IT overcomplexity and bastardization of classic Unix | |||||||
There are signs that in Q1 of 2016 oil prices reached temporary cyclical bottom caused mainly by casino capitalism factors (future markets games and Saudis predatory pricing) , not production factors ("oil glut"). Among arguments in favor of this hypothesis are
Prices below $80 now represent a "dead zone" for the US shale oil industry. IMHO shale oil optimists should try to understand a very simple statement: Prices below $80 now represent a "dead zone" for shale in which companies will not get the level of financing they are used to and which allowed them drilling like mad and service their debts and other obligations while having negative cash flow.
The same is generally true for Canadian oil sands.
Consumption continues to grow as Earth population continued to grow.
Depletion of traditional oil fields continues unabated
Capital expenditures into development of new fields are radically slashed everywhere in the world and most probably will say low in 2017 and 2018.
Speculators who control oil price via futures can change their behaviors on a dime and run it up.
New oil deposits generally require oil price above $60 to be economically viable.
Geopolitical factors that stimulated oil crash (the desire of certain countries to hurt Russian and Iran economies) might slightly change with the end of the term for Obama administration, especially if he will be replaced not by another neocon(Hillary Clinton) but by less jingoistic and more pragmatic Donald Trump.
In my previous article Why the Bakken Boomed, I discussed the shale oil boom that has had such a dramatic impact in North Dakota's Williston Basin over the past decade. But throughout the U.S. shale boom there have been those who doubted that the production gains would prove anything other than fleeting. Those doubts were grounded in the fact that shale oil production is more complex and expensive than conventional oil production, and the fact that cash flow has been consistently negative for virtually all shale oil producers.
While the doubts are based on fact, the story is more complex than it may appear. Isn't that always the case though? Things are never quite as simple as they seem. Superficially, the narrative for many has been "Shale oil isn't economical. The wells deplete too quickly. Just look at the negative cash flow."
But it's just not quite that simple. Let's dig a little deeper to gain a better understanding of what has happened, what is happening, and what is likely to happen moving forward.
First it's important to understand that the oil industry is cyclical, and more importantly to understand the reason that it is cyclical. The long history of the oil industry has been one of boom and bust cycles. During the booms we hear about windfall profits, but during the downward part of the cycle, oil companies lose a lot of money and many people lose their jobs.
So why is the oil industry cyclical? It's not complex. It is a function of the capital-intensity of the business, and the multi-year lag time in getting projects executed. If you just want the executive summary, here it is. I have arbitrarily started this at the bottom of the cycle, and the 5 stages I have described here could be described at a more granular level with more stages:
Keep in mind that some of these steps overlap in time, partially because the oil industry is made up of so many different companies with many different management styles. One company may still be investing heavily while another has already slashed spending in anticipation of falling prices.
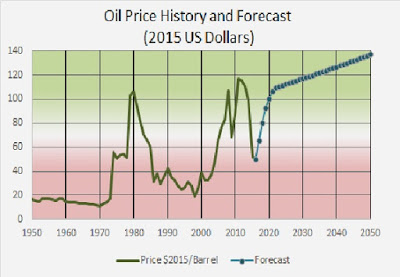
We were at Stage 1 of the cycle in the late 1990s, when oil prices were bouncing between $20 and $30/bbl. In response to low prices, oil companies were conservative in their capital expenditures leading up to the early 2000s. In 2002 the price of oil slowly began to rise as demand growth outpaced new supplies and reduced the world's spare capacity cushion. We were entering Stage 2.

Source: Energy Information Administration
We spent the early part of the past decade in Stage 2, but then most of 2005-2010 was spent in Stage 3. In 2005, the price of West Texas Intermediate (WTI) averaged $56.64, rising to an average of $66.05/bbl in 2006, $72.34/bbl in 2007, $99.67/bbl in 2008, but then falling back to $61.95/bbl in 2009.
Demand in the developed world started to decline in earnest in 2008. This marked the early stages of Stage 4, which was drawn out because of strong demand growth in developing countries (which kept global demand growing). But new production was coming online at a rapid pace in response to $100/bbl oil, and a supply cushion began to once again expand. In mid-2014, we entered Stage 5 as the price of oil began to collapse.
In 2005, most oil companies generated solid operating cash flow - defined as the cash generated by a company related to core operations. But as the shale boom accelerated, and with prices remaining high, oil companies went on a spending spree to get new projects implemented. Prices got so high that oil companies were investing every cent they could get their hands on to capitalize on the opportunity.
It's easy to understand why they do it. Imagine you are running a business, and making very hefty margins on the products you are selling. You would likely want to plow your profits back into the business to grow sales as long as the margins are strong. If you are getting higher prices for your products each year, you are going to continue to plow that money back into growing the business. But this may very well put your business in a negative cash flow position even when prices are high.
As long as margins are good, you can grow your business rapidly. But what happens if prices collapse? It depends. If you grew by highly leveraging your business - in other words if you borrowed lots of money to grow it even faster – then you could be in trouble. If, on the other hand you don't have a lot of debt to service and are able to slash your capital spending, you may be able to generate profits even though prices have collapsed.
As the spending spree ensued, cash flow turned solidly negative by 2009, even though the price of oil was higher than it was in 2005. A recent graphic by Oppenheimer tells the tale:

When oil prices began to fall in mid-2014, companies began slashing capital expenditures. But they are slashing from capital expenditures that a year earlier were based on $100/bbl oil. Oil prices have fallen so far, so fast that essentially all oil and gas companies are still in a negative cash flow position despite the cuts they have made (except of course the refiners, who benefit from low oil prices). And they are slashing based on projections of where they think oil prices will be in the future. Different companies will have different ideas of where oil prices are headed and different levels of indebtedness, so they will naturally differ in how aggressively they will prune capital expenditures.
History argues that, even if oil prices remain near $50/bbl for an extended period of time, some companies will be able to rein in costs enough to generate free cash flow as they did in 2005. Of course the counterargument is that it costs more to produce oil in 2015 than it did in 2005, when companies had positive cash flow with WTI at $56.64/bbl. After all, it took higher prices to enable the shale oil boom, and therefore it stands to reason that it will take higher prices to keep it going.
Let's first consider the economics of producing oil from a shale play. (For a more detailed explanation, see Art Berman's recent Forbes article Only 1% Of The Bakken Play Breaks Even At Current Oil Prices).
Broadly speaking, the economics of oil production hinge on the cost to drill and complete the well, and the amount of oil, gas, and natural gas liquids that are obtained from the well. There are also other expenses involved, such as operating costs, taxes, exploration costs, etc. But let's focus on the cost to drill and amount of oil produced.
If an oil producer spends $5 million to drill and complete a well, but only recovers 100,000 barrels of oil from that well, then that's $50/bbl just on the drilling and completion costs. If, hypothetically they could produce 1 million barrels from that well, then it's just $5/bbl on drilling and completion costs. Thus, the amount of oil ultimately recovered has a huge impact on the cost of production.
In the early days of the shale oil learning curve, the wells were more expensive to drill and complete relative to the production levels that were being achieved. As operators gained more experience by experimenting with the number of fracking stages, the amount of sand, etc., they lowered their cost of production. A 2009 filing by Brigham Exploration - later acquired by Statoil (NYSE: STO) - demonstrates how oil well economics improved as more hydraulic fracturing stages were introduced to horizontal wells:

Source: Brigham Exploration SEC filing
This shows that within four years or so this company was able to reduce the cost of producing a barrel of oil in the Bakken by more than $25/barrel of oil equivalent (BOE). (Note that this is only the cost to produce; it doesn't include operating costs, etc.). Thus, what may have only been economical at $100/bbl in 2006 could have been economical at $75/bbl by 2010. By 2014, many were claiming that the break even cost had fallen to $60/bbl or even lower.
But that's an industry wide estimate. As Art Berman explains in his article, there are a few Bakken wells that are breaking even with Bakken oil prices in the low $30s (and WTI in the mid-$40s). But those wells are the most productive wells in the Bakken Formation, which drives down the cost per barrel for drilling and completion.
Industry wide, it's probably going to take WTI prices of at least $60/bbl before the average Bakken well breaks even. Of course that's an average; some operators will still be in trouble at that price while others will start to generate positive cash flow.
So what about the notion that fracked wells deplete too quickly, and that is why they can't be economical? I have heard this justification repeated many times, but again reality is more complex. First, it isn't a mystery to the companies drilling these wells that they deplete quickly. What they are interested in is the estimated ultimate recovery (EUR).
If you are familiar with the time value of money, you would like to have your investment paid back as quickly as possible. So if I have a well that is going to produce 500,000 barrels during its lifetime, do I want a slow and steady depletion to zero? No. As an operator, I want to get that oil out as quickly as I can without damaging the well and reducing its ultimate production.
Where some see fast depletion as a problem, another way to look at it is that you got most of the available oil out quickly. (Note that some operators are experimenting with throttling wells early on to determine whether that increases the EUR).
The history of the oil industry has been one of cycles, from nearly the beginning of the industry in the 1850s through today. In the down cycle that we are currently experiencing, demand rises due to low prices, even as oil producers begin to cut capital expenditures. U.S. shale production has already begun to decline as very little shale oil production is currently profitable. The end result is very predictable, even if the timing is not. While there is broad agreement that a great deal of U.S. oil production is currently unprofitable, some feel like oil prices need to fall further to make a bigger dent in production because crude oil inventories are still quite high. I feel like with the continued growth in global demand, we can already see the supply/demand picture tightening on the horizon. When that becomes broadly obvious, oil prices will again rise, bringing profits to the industry and higher capital spending on new projects. How long that process takes will determine how many oil companies are left standing to reap those profits.
|
|
Switchboard | ||||
| Latest | |||||
| Past week | |||||
| Past month | |||||
Feb 13, 2017 | peakoilbarrel.com
Seppo Korpela says: 02/10/2017 at 8:33 pmThe report by the Hills Group claims to rely on thermodynamics arguments to predict oil's price-volume trajectory going forward. If does not stand up to scrutiny.Rune Likvern says: 02/10/2017 at 10:34 pmThermodynamic analysis of engineering systems is typically based on the first law of thermodynamics together with mass balances.
The second law of thermodynamics introduces the entropy as a thermodynamic property and the related concepts of reversible processes and reversible heat transfer.
Irreversibilities in real processes are taken into account by assigning a value of experimentally determined efficiency to equipment such as pumps, compressors and turbines and
this way the reversible processes are related to the actual ones.A relatively recent development has been to develop a systematic use of an exergy balance to examine where in a complex energy system irreversibilities
take place. Exergy is defined as the maximum theoretical work that can be obtained from a system and its environment as the system comes to equilibrium
with its environment. By combining the first and second laws of thermodynamics an exergy balance can be written down.Rudimentary exergy analysis can be found in the 1941 book Thermodynamics by Joseph Keenan. It was called availability analysis at that time. The most systematic development of the exergy analysis is in the textbook Fundamentals of Engineering Thermodynamics by M. Moran, H. Shapiro, D. Boettner and M. Bailey, 7th ed. John Wiley, 2011.
Although the entropy balance equation can be used (although typically only for steady state systems) to determine the entropy production, to carry it out requires that sufficient number of thermodynamic properties and interactions are known at the system boundaries. Since such a calculation needs to be carried out after the thermodynamic analysis has been completed, it is seldom carried out in engineering practice because the knowledge of the same properties allows the efficiency of the machine or system be determined.
The advocates of exergy accounting claim that knowing where the exergy destruction takes place in a system is a good way of allocating development money to improve it.
This kind of analysis has not taken hold in industry either, simply because, manufacturer, say of turbines know that the irreversibilities are quantified by measuring the efficiency of the turbine, and they direct their efforts toward understanding how the blades of the turbine can be shaped in order to reduce the irreversibilities. Such a task is based on aerodynamic calculations. Compressors and pump are by the nature of the flow through them machines with lower efficiency and their improvement requires again experts with fluid dynamic knowledge to improve them. Similarly improving the heat transfer in a heat exchanger is carried out by making improvements in the heat exchanger surfaces and reducing pressure losses.If these improve the heat transfer, the entropy production is reduced. Here the expertise of a heat transfer specialist rather than a thermodynamicists is needed.
One interesting application of exergy analysis is to calculate the second law efficiency. A high second law efficiency means that the source of energy is well matched with the application.
Thus heating shower water with a thermal solar heater is a good match as unfocused solar energy raises the water temperature high enough to serve as shower water, but not nearly so high as to create superheated steam to power a steam turbine. Thus the most important insight to be obtained is to match the source of energy to the application, and once this insight is internalized, calculation of the second law efficiency adds only marginally to understanding. For this reason it is seldom used in industry. To be sure, optimization of a system's second law efficiency is still worth while, but using other metrics this can be done with topics based on heat transfer, fluid dynamics, stress analysis and the like.
Where thermodynamic analysis is helpful is in seeing how a thermodynamic efficiency of a system such as a coal or nuclear power plant can be improved by increasing the maximum steam temperature of the plant in which the turbine is but one component. This requires that blades are made of materials that withstand the stresses generated at these temperatures. Such developments have increased the maximum temperature of these power plants to about 1000 F, but further improvements have now stalled over the last half a century. For gas fired power plants combustion temperature is higher and and turbine designers implement both cooling technology for the blades and use high temperature materials, that today are made of single crystals, that withstand the hot combustion gases. Interestingly exergy analysis shows that most of the exergy
destruction takes place in the combustion of the fuel, but there is not much one can do to reduce this destruction. For this reason a naive application of exergy analysis may lead the poor allocation of development funds.The report by the Hills Group proposes to use the second law of thermodynamics as the starting point. The unsteady entropy balance for a control volume with one exit and no inlet is given as
dS_cv/dt= Q^dot_j/T_j – m^dot_e s_e = \sigma^dot_cv
Next comes the assumption that at all times dS_cv/dt = m^dot s_e$. It is based on the observation that because at the end of oil production when the reservoir has been completely depleted the flow will stop and nothing much takes place, then both of these terms are zero. After cancelling these terms the entropy production is seen to be related to the heat transfer. But his assumption is clearly unjustified while the oil is being extracted and these two terms do not cancel each other. The neglect of the terms leads to an equation that omits the entropy production that is caused by the irreversibilities of the oil flow through the permeable reservoir rock.
The incorrect canceling leads to the equation
dot Q^dot_j/T_j = sigma^dot_cv or sigma^dot_cv= Q^dot_j/T_j
and this can be cast in these two forms, depending which term is known and which is unknown. The report by Hills Group does not tell the reader which is a known quantity and which is to be calculated. In fact, there is no indication in the report how the heat transfer is calculated? In thinking about the heat transfer, for a control volume that includes the reservoir only, it appears that the heat interaction between the system and the surroundings is mainly caused by the geothermal gradient. That is, heat enters from the lower boundary and leaves across the upper boundary. This is a passive process.
The fact that the oil and water in the reservoir have some average temperature in the geological setting only influences the viscosity of the fluids and thus how well they move through the reservoir, but from the energetic standpoint the sensible energy is not important. That is, there is no attempt made to extract this energy in a heat exchanger, nor is the high pressure used to extract energy in an expander. Rather the oil and water mixture flows through a set of throttling valves, in which the exergy is destroyed.
If the entropy production were known independently, then this equation could be used to calculate the heat transfer, but the answer would be incorrect because entropy production is caused by both heat transfer and irreversible processes taking place inside the control volume. For the control volume consisting of the reservoir, entropy production takes place mainly in the pores of the permeable reservoir rock as the flow is forced out.
This takes place by local viscous dissipation and although it can be calculated in principle, in practice such a calculation is nearly impossible to carry out from first principles. The entropy production rate for the system would then be calculated by integration of the local values over the entire reservoir.
Next in the analysis is a calculation of E_Tp. It is defined as the total production energy, or the total work required to extract, process, and distribute a volumetric quantity (a gallon) of crude oil. The report offers the equation
E_Tp = [(m_c C_c + m_o C_o ) (T_R-T_O)]/[m_c]
as a way to calculate it. But this is the energy of the sensible part of the oil-water mixture above the reference temperature T_O. It does not include the chemical energy of the crude oil and the formula cannot be reconciled with the definition of E_Tp.
The following equation also appears in the report
E_Tp = integral_{t_1}^{t_2} T_0 \sigma^dot_cv dt\]
Thus there are two equations to use for calculating E_Tp and there is no mention what the independent variables are and what is calculated using these equations.
If the value of E_Tp is calculated this way then how is the previous equation used? The only unknowns are the reservoir temperature T_R and the oil-water ratio, if the total flow rate is determined from the depletion rate equation. The reservoir temperature can be measured, so the unknown seems to be the water oil ratio. However, the report makes use of an empirical equation for the oil/water ratio as a function of the percent depletion of the reservoir.Finally last equation can only be used to calculate the change in exergy, and this would necessitate a new symbol to be introduced for exergy, and this is not the same as energy.
The report next presents calculation of the oil extraction trajectory that is based on Hubbert's methodology. The calculations are in close agreement what others have found., with cumulative production 2357 Gb that is somewhat larger than what Campbell and Laherrere's value 2123 Gb. It is now well known that the in the calculations based on logistic equation there is a slow drift to large values of the ultimate production as more data has been included in the calculations with the passing of the
In the same section is also a discussion of the surface water cut as a function of the percent of oil extracted from a reservoir. The curve is then rotated in order to satisfy two criteria set by the authors. Now a rotation of a curve is a mathematical transformation and a curve cannot be arbitrarily rotated without destroying the underlying mathematical theory. Furthermore, the report states that E_Tp cannot exceed E_G, the crude oil's specific exergy. The terminology is again used loosely applied to both energy and exergy.
Returning to the calculation in Section 4.1 of the report for calculating $E_{Tp}$ by the equation
E_Tp = [(m_c C_c + m_o C_o ) (T_R-T_O)]/[m_c]
The statement on top of page 19 suggests that the water cut is an input parameter, in which case the value of E_Tp depends only on the reservoir temperature.
The reservoir temperature in turn is a function of the depth of the well, owing to the geothermal gradient. This would allow this equation to be used to calculate the sensible energy of oil-water mixture. But what purpose does this serve?
The sensible heat of the crude oil is not used in any significant way. The crude oil cools as it enters the ground facilities and it cools further as it is transported in the pipelines. No power is generated from the sensible part of the crude oil's energy. Only the chemical energy is valuable upon combustion. The rest of the report relates to how prices are linked to the energy delivered. There is no theory to predict how prices adjust to either temporary surplus or deficit.
From what has been discussed above, the thermodynamic analysis is incorrect and therefore any calculations and graphs based on this analysis must also be unreliable. Readers have noted that the so called analysis predicts a peak in oil production during the 2017-2018 time frame and troubles by 2023. That this coincides with the time others have judged the difficulties to appear, seems to give the report a superficial credibility.
If the authors have a better handle on how much energy is expended in oil production, they can form the EROIE ratio and it would constitute an independent check on the work of Hall and his coworkers on EROEI. Such an independent analysis would have some value
Seppo,
+1 000 000!
I am (and many others) now awaiting Hills rebuttal to this.
peakoilbarrel.com
texas tea , 07/16/2016 at 4:58 pm
Art also had this article out last month.I like Art and now he thinks and writes but I also think that he as some Dennis Gartman blood in him, he holds many ideas at the same time and he can argue any of them very well. These articles seem to contradict each other a bit, but they are at least thoughtful..
and now for something completely different:
https://www.donaldjtrump.com/press-releases/an-america-first-energy-plan"Two years into the global oil-price collapse, it seems unlikely that prices will return to sustained levels above $70 per barrel any time soon or perhaps, ever. That is because the global economy is exhausted" ~A.Berman ca. July. 2016Fernando Leanme , 07/16/2016 at 8:06 am"But from 2008 to 2015, oil production actually fell in 27 of 54 countries despite record high price. Thus, while peak oil critics have been proven right in North America they have been proven wrong in half of the World's producing countries" ~ E. Mearns ca. July, 2016
It looks like my posts at this fine blog for the past 2 – 2.5 years are finally being read and understood …..
Maybe one day even Dennis will get the message…….
……one can only hope….."…while indeed initiated by geology, this time "PEAK" shall be by the way – and in the form of low prices…" ~ Petro's main theme for the past 2 years on POB
Be well,
Petro
P.S.: a little hubris and arrogance is healthy now and then….
Here's my forecast
Javier , 07/16/2016 at 9:22 am
Unlikely, Fernando. I see very high volatility in oil prices heading our way.Sustained high prices are only possible with a very good economy or with a very low production (you only sell to the elites).
On the other hand the value of money could tank with a monetary crisis, and oil prices could rise to millions of dollars per barrel.
Stavros Hadjiyiannis , 07/16/2016 at 12:42 pm
I totally agree with you. I see the oil price rising well over 100 bucks per barrel before the end of the decade.shallow sand , 07/16/2016 at 6:07 pmAs for the persistent fantasies that Russian oil output will decline. The exact opposite will happen in the long-term. Russian oil reserves easily dwarf anybody else's.
The concluding paragraph on the oil reserves of the Bazhenov formation in SW Siberia reaches an unequivocal conclusion:
"Giant recoverable oil reserves contained in the fractures suggest that the Jurassic reservoir is a primary oil accumulation which has no analog all over the world. Therefore, we believe that Russia has the largest hydrocarbon reserves in the world."
Any info on how the first wells in this play are performing. Seems it is difficult to find much information online about them.Javier , 07/16/2016 at 4:53 amPetro,Dennis Coyne , 07/16/2016 at 10:29 amIt is fine and dandy that you show some arrogance when the data is starting to support your hypothesis, however I must point out that a lot of people have been coming to the same conclusions at about the same time. There are a lot of clever people in the world.
Ron Patterson has been onto oil decline for a very long time from studying oil production data. He was about the first to realized that LTO was not a solution to the Peak Oil conundrum. He probably realized about the 2015 Peak long before he put it on writing. He can tell us. I seem to recall reading his prediction within the first half of 2015.
Euan Mearns seems to be reaching the same conclusion from the same background, his geological expertise, but only now have I read him put it on writing.
Art Berman has come to the same conclusion from a very different background, the energy investment field. This is also the first time I read him say it so clearly, but he probably reached his conclusion some time ago and only now he dares to write something so strong in his influential blog.
Myself I reached the conclusion that Peak Oil was imminent in September 2014, from economic insight after I clearly saw that the oil price crash was really bad news for the consumer long term, while most people thought (think) that is great news for the consumer. I studied oil production data and saw my fears confirmed. That is when I started my oil (and climate) blog, and my first prediction on writing of a 2015 Peak Oil is from November 2014, and again February 2015.
My understanding of macroeconomy is not as good as yours, but is good enough to understand that we are facing the end of the road and the can kicking will not continue much longer. Central Banks are buying some time through desperate measures that will make the fall harder while the elites hasten their preparations. We are contemplating the Peak of our civilization (in my opinion Peak Civilization took place in the early 70's) and its unraveling is going to be a very long stressful one.
Hi JavierJavier , 07/16/2016 at 11:09 amI only disagree on the timing of the peak and never believed lto would have much effect on the peak.
I disagree with an analysis that suggests oil prices under $75/b for the 3 year average oil price forever.
Volatility is a good guess though Fernando's price scenario might be roughly correct for 5 year average oil prices.
Dennis,You might be right and I might be wrong. What it is clear is that we see more or less the same situation but a completely different outcome.
Two things separate completely my analysis from yours:
The first is that I see a monetary crisis as unavoidable in the not too distant future. Most of the planet's wealth is in the form of electronic money (derivatives and financial instruments). The folly of Central Banks is hugely increasing those that are in the hands of the financial elite so there is less and less real wealth (land, resources, and productive industries) to support that virtual wealth. At some point the bubble is going to be so big and the leverage so high that there is going to be a run of that virtual wealth to become real at any cost and that is going to destroy every currency you can buy something of value with. Over here in Europe I am already seeing some worrying signs of what is coming, as payments in cash are being limited to ridiculously low amounts and governments are trying to force everybody to have their money in the banks. With a monetary crisis the price of oil in dollars has no point of reference and predictions have little value. The US has no experience for generations on monetary crisis, so that is going to be a real shock.
The second thing is that during economic crisis wealth gets distributed more unequally. The middle classes and low classes lose their savings and everything of value they have while some elite class fare quite well even if they lose part of their nominal wealth. This has several dire consequences. It can lead to bloody revolutions like the French or Russian revolutions. And in any way it leads to most people not being able to consume much. There won't be enough customers for oil, making your price predictions useless.
My own personal thought is that the current pricing system for oil based on margin pricing will have to be abolished once the shit hits the fan. It will simply not work. They'll think of something to avoid total collapse of oil production.
OilPrice.com
Citigroup is "especially bullish" on commodities in 2017, the bank says.
"The oil market is treading water for now, but the oil price overshot to the downside earlier this year and this is clearly setting the stage for a bullish end to the decade," Citi analysts, led by Ed Morse, wrote in a research note published on July 11.
There is a quite a bit of volatility in commodity markets, especially for oil, but global demand continues to grow at a steady pace. Prices have crashed on oversupply, but with oil production going offline, particularly in the U.S., the markets could over-correct, creating the conditions for higher prices next year.
finance.yahoo.com
Rebounding after a two-year collapse, it's only this month that oil prices have pushed up past $50 a barrel, but Raymond James & Associates says this is just the beginning for higher prices.
In a note to clients, analysts led by J. Marshall Adkins say West Texas Intermediate will average $80 per barrel by the end of next year - that's higher than all but one of the 31 analysts surveyed by Bloomberg.
"Over the past few months, we've gained even more confidence that tightening global oil supply/demand dynamics will support a much higher level of oil prices in 2017. We continue to believe that 2017 WTI oil prices will average about $30/barrel higher than current futures strip prices would indicate."
The team went on to lay out three reasons for their bullish call, all of which are tied to global supply - the primary factor that precipitated crude's massive decline.
Here's how the rebalancing of the global oil market will be expedited from the supply side, according to the analysts:
- First, the analysts see production outside the US being curbed by more than they had previously anticipated, which constitutes 400,000 fewer barrels of oil per day being produced in 2017 relative to their January estimate. In particular, they cite organic declines in China, Columbia, Angola, and Mexico as prompting this downward revision. "When oil drilling activity collapses, oil supply goes down too!," writes Raymond James. "Amazing, huh?"
- Adkins and his fellow analysts also note that the unusually large slew of unplanned supply outages will, in some cases, persist throughout 2017, taking a further 300,000 barrels per day out of global supply.
- Finally, U.S. shale producers won't be able to get their DUCs in a row to respond to higher prices by ramping up output, the team reasons, citing bottlenecks that include a limited available pool of labor and equipment.
Combine this supply curtailment with firmer than expected global demand tied to gasoline consumption, and Adkins has a recipe for $80 crude in relatively short order.
"These newer oil supply/demand estimates are meaningfully more bullish than at the beginning of the year. Our previous price forecast was considerably more bullish than current Street consensus, and our new forecast is even more so."
The only analyst with a higher price forecast for 2017, among those surveyed by Bloomberg, is Incrementum AG Partner Ronald Stoeferle. He sees West Texas Intermediate at $82 per barrel next year. The consensus estimate is for this grade of crude to average $54 per barrel in 2017.
Over the long haul, however, Raymond James' team sees WTI prices moderating to about $70 per barrel.
Read Raymond James: Get Ready for $80 Oil on bloomberg.com
Related Stories
peakoilbarrel.com
shallow sand , 06/16/2016 at 11:15 amTT. I read that.texas tea , 06/16/2016 at 1:42 pmNot too happy to see prices are headed back down in the face of what appears to be strong demand and falling production. Strong dollar, negative rates. Ouch.
Petro. Are all commodities doomed, or just energy? How about grain?
I am going out on a limb here and say food and energy and precious metals will see money flow and the government will print money to make sure we have food and energy. Folks can do with out a lot but the streets will fill without food and energy. With respect to who will be right about US seeing past highs in C+C production, I have my doubts under normal business conditions, but i can envision that it could happen, but it would be under a "emergency" type all hands on deck scenario. Unlikely but possible, our industry has surprised doubters in the past in our ability to get the job done for the American people. lets make america great againHR , 06/16/2016 at 6:09 pmCrude traders following Fibonacci rules. That's all. They took out the stops around 51, made their profits then went short. Pretty soon they'll go the other way again. Third quarter they'll go long and stay there. Guys already taking options on 100 a barrel. WTI will probably retest a 42 handle before it starts a steady climb. In the sixties in three months or so. Better dollars next year.shallow sand , 06/16/2016 at 11:40 amWe just have to keep starving for a few more months. Oil in storage isn't helping much either. By the end of the year, we should have a couple of reasons to smile for a change.
Cheers gentlemen, keep a stiff upper lip!
Petro.clueless , 06/16/2016 at 3:35 pmOne other thought. I take it you see major deflation on the horizon? So, if both crude price AND operating costs deflate, what is the difference, unless one has debt?
If one only has plugging liabilities, in a highly deflationary scenario, those liabilities also deflate (cost of labor and cement) in relation to cash on hand. Further, those with plugging liabilities and cash with no debt will, in my view, at least, have high leverage with state agencies as to negotiating a long term P & A agreement.
The US has over 1 million wellbores, if there is a "royal flush" of E & P's, due to massive deflation + high long term debts, I'd say anyone who agrees to P & A a few wells per year will be looked on favorably. 3/4 or more of the well bores will be abandoned and thrown on the backs of state governments if WTI and nat gas prices persist or go lower.
At some point, there will be a rapid reversal, commodities become scarce, prices rocket up? One thing for sure, 1980s university finance professors never envisioned the kind of stuff going on. Crazy times. Hard to change long held views.
Shallow Sand – Here is the clueless take on things.Dennis Coyne , 06/16/2016 at 12:12 pmIn general: Low interest rates are deflationary; High interest rates are inflationary. But, they are used to fight the opposite problem. Inflation rising: raise interest rates. Deflation on the horizon: print money and lower interest rates to cause inflation. However, at the extremes, eventually the desired result is obtained.
In the 1970's they kept raising interest rates to fight inflation. Result, more inflation – until we got to 14% annual inflation and 18% interest on a home mortgage. Then a recessionary collapse, and inflation was killed. Now we are in the reverse position – including negative rates in Europe, and everyone printing money. Result, deflation becoming more of a worry. At some future breaking point, likely a SURGE in inflation.
Why is this? Because if you have debt, when interest rates rise, you have NO choice. You must raise prices to pay it . There are no productivity gains; better way of doing things; more efficiency, etc. to solve the problem. If you have debt and interest rates rise, generally you HAVE to raise prices to pay the interest.
Now the reverse. Suppose long-term interest rates go to zero. You want to build a restaurant. You borrow the total cost of $2 million for 20 years. No interest, just a balloon payment at the end of 20 years. Okay, you can build your restaurant for zero cost of capital. For 20 years, you just have to cover the variable costs – food, labor, utilities and insurance. So, for 20 years, you can undercut the price of anybody that does have a cost of capital. Your restaurant is a booming success for 20 years, until you declare bankruptcy, since you have taken all of the profits as your salary and have no money to pay back the debt. Meanwhile you have lowered the cost of eating out in your market area for 20 years.
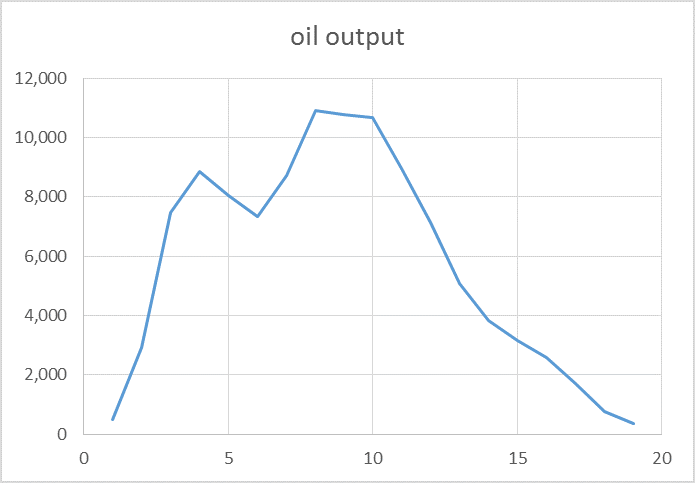
Hi Petro,Dennis Coyne , 06/16/2016 at 12:16 pmA mini model illustrating how the simple oil model works in chart below.
Basically well profile times number of wells added and add it all up.
Note that the well profile changes over time it is not fixed. Before 2008 there was a lower well profile, it increased and remained relatively stable from 2008 to 2013, the well profile increased in 2014 and 2015.
All of the well profiles and number of wells added each month from 2005 to 2016 (April), we don't know what the future well profile will be. All of this information is in the spreadsheet I linked earlier.The minimodel is in the link below and illustrated in the diagram below.
https://drive.google.com/file/d/0B4nArV09d398ejQzek9Bem0yalU/view?usp=sharing
 Hi Petro,clueless , 06/16/2016 at 3:53 pm
Chart that goes with spreadsheet above is below, shows a dual peak scenario, it is all about the number of wells completed, the peak only occurred because the number of completions fell from 200 per month to 45 per month in the ND Bakken/Three Forks.
 An open truly clueless question. For many years, much of the gas in the Bakken was flared. During that time, was measurement of gas as accurate and complete as when flaring no longer allowed and it is now being sold?Toolpush , 06/17/2016 at 4:12 am
The reason that I ask, is to assess if historical gas/oil ratios are meaningful.
Clueless,If you read the ND govt reports, you will see oil and gas figures per well each month. Yes gas produced has been counted all the way though. Gas captured and sold, is a separate number.
peakoilbarrel.com
texas tea , 06/17/2016 at 5:05 pm
http://www.rigzone.com/news/oil_gas/a/145084/Pioneer_CEO_60_Oil_Needed_for_US_Shale_Industry_to_Grow_Productionshallow sand , 06/17/2016 at 6:13 pm"I think the world is going to need Permian Basin oil production, and it's not going to grow until you get to $60 long term," he said. "When oil moves toward $60 per barrel, I believe a good $10 of it for a lot of companies will go toward paying off debt, or they'll start selling assets at decreased divesture prices. That extra $10 will be a huge difference for companies that have great balance sheets today. That's why I'm a firm believer we're in a $60 long term oil price environment."
Seems to have changed his tune somewhat. But $60 does not get in done in most LTO plays. PDX's production may be able to grow in the $60(60-69) but elsewhere not so much. But of course I will take 69 over $48 anyday
PXD smart moves. Hedging better than most. Issuing shares as opposed to incurring more debt. Still not convinced Spraberry is superior to Bakken/EFS.As I recall, only 11% of PV10 is in PUD per 2015 10K, despite 600,000+ acres which supposedly have multi stacked pays.
peakoilbarrel.com
AlexS , 06/15/2016 at 12:11 pm
I remember Lynn Helms predicting a sharp drop in production for March. In fact, in March Bakken output declined only 8 kb/d, but was down 69 kb/d in April.likbez , 06/17/2016 at 11:26 pmApril number for ND Bakken is down 6.6% vs. March, 10.9% vs. April 2015 and 15.2% (176 kb/d) from the peak reached in December 2014.
Average output for January-April 2016 is 1044 kb/d, down 6.9% year-on-year.As CLR's Harold Hamm and several other E&P CEOs are saying, $50 is a trigger for increased completion of the DUCs.
Rig count has also bottomed, but significant increase in drilling activity is unlikely until WTI reaches $60.Nonetheless, it seems that we will see further declines in LTO output in the next several months due to delayed impact of low oil prices.
Alex,While oil prices will definitely reach $60 at some point and shale is still doomed at the current price range, there are some contrarian tendencies visible now. If the world economy slows down considerably the rise of oil prices will slow down even more. Let's hope for the best and prepare for the worst.
www.cnbc.com
Until the capital markets open up and allow U.S. oil companies to spend outside of their cash flow, production will not increase and crude prices will continue to rise, Tapstone Energy CEO Tom Ward said Thursday."There's no increase in the capital spending, the debt side of the business is closed, and so until we have something fairly dramatic happen like maybe a doubling of the rig count, I don't think we can grow production in the U.S.," he said in an interview with CNBC's "Power Lunch."
Therefore, "I wouldn't be surprised at all if we saw above $60 or even $70 [a barrel] by the end of the year," added Ward, the co-founder of Chesapeake Energy.
His comments come on the heels of American oil billionaire Harold Hamm's prediction that oil will likely hit $69 to $72 per barrel by year's end.
... ... ...
Tapstone Energy currently has three rigs online, down from four, and Ward said there are no plans to add more rigs. It's the same across the industry, he said, because of the lack of access to capital markets."I think prices will have to move up even higher than we're talking about for there to be a big change in the rig count," said Ward. "We can't change the decline of the oil production in the United States without more capital, and right now that's just not available."
That said, as soon as funds open up, Ward plans to start spending.
"We will spend whatever you give us. As long as there is money to be had through the capital markets, then we'll use that to grow production, because that's what we're paid for."
peakoilbarrel.com
Ron Patterson, 06/03/2016 at 6:32 am
Oil Price Poised For A Boost From A Big Fall In U.S. ProductionRon Patterson , 06/03/2016 at 6:37 amU.S. oil production has entered the end game with output forecast to plummet as drilling dries up and banks foreclose on oil companies teetering on the brink of insolvency.
Long predicted as a natural development after the 2014 start of the collapse in the oil price the inevitable has been delayed by drillers squeezing every drop out of their wells, but that game is all but over.
From a peak of more than 9.5 million barrels a day early last year current output has slipped to 9.1mb/d but if a fresh forecast is correct the number could be 8.5mb/d by July and possibly below 8mb/d in the September quarter…
Saudi Smiles
The Saudi view has consistently been that the oil market will fix itself with low prices forcing high cost producers out of business, leading to a sustainable price recovery.
What the ANZ has done with its report released earlier today is reinforce the Saudi position with the headline telling the story: "Declines in U.S. oil output set to accelerate".
And here is that story: Declines in US oil set to accelerateOldfarmermac , 06/03/2016 at 7:02 amLondon, 2 June 2016
A lack of drilling is about to catch up to US oil output. To maintain current production levels in the US requires 439 rigs, compared to the 280 in operation, according to ANZ Research. "If that trend persists, we could see production fall below 8.5mb/d by July," comments Daniel Hynes, commodity researach analyst.
Financial stress could exacerbate this. Oil producers with sub investment grade debt maturing this year produced approximately 1.3mb/d of oil. We have also seen more downgrades of credit ratings in 2016 than over the past three years.
This should see oil prices remain well supported over the next six months.
It has always seemed perfectly obvious to me that the price would HAVE to go back up, and it has , quite a bit already.The thing that surprised me is that it has taken as long as it has for the high cost producers to start falling by the wayside. In other industries, the blood would have been in the water MUCH quicker.
Does anybody have a figure for the "typical or average " cost of storing crude per barrel per year? How has the price of storage varied for the last couple of years?
peakoilbarrel.com
AlexS ,
06/09/2016 at 4:32 amshallow sand,texas tea , 06/09/2016 at 5:09 am"hope this rally isn't a repeat of last year."
I'm sure it isn't.
Short-term downward corrections are possible, but the general trend is upward.I tend to agree, but it will not surprise me to get a soft patch in prices late summer, if it is shallow, no pun intended, we will have the episode be hide us and I would look at it as a time to add to pub co stocks. By then the production trends as highlighted in the work presented here will be very much in place. Who knows Dennis might have to adjust his trend lines on the C+C chart by that time and will need to use peak flow as the starting point.Dennis Coyne , 06/09/2016 at 9:57 amShallow you do not need to tell me, of the hundreds of thousands of people who work in oil an gas extraction the number of them "barons" would fit on one of the those new electric buses.
Hi texas tea,If we substitute Dean's better estimate for Texas into the EIA's US estimate (removing the EIA's Texas estimate from the US total) and use the data from the peak in April 2015 to the most recent monthly data point of March 2016 and fit a trend line using the method of least squares we get production decreasing at an annual rate of about 200 kb/d over the most recent 12 months.
See https://en.wikipedia.org/wiki/Least_squares
This is the method used by a spreadsheet when a linear trend line is fit to the data.
Reply

oilprice.com
Middle East oil producers turn to debt markets. Oman sold $2.5 billion in bonds on Wednesday, as it seeks to improve its financial position. The Gulf state oil producer, who is not a member of OPEC, went to the debt markets for the first time in more than twenty years, a sign of how badly it has been damaged from low oil prices. The move comes after some of Oman's neighbors issued new bonds earlier this year – Qatar sold $9 billion in debt and Abu Dhabi sold $5 billion. Saudi Arabia is also expected to turn to the bond markets, perhaps selling as much as $15 billion worth of bonds. But the IMF warns that the Gulf States are going to need to do a lot more to cut spending in order for them to hold onto their currency pegs.Speculators gamble on $100 oil. Bloomberg reports that some oil traders are buying contracts that will only pay out if oil surpasses $100 per barrel at some point in the next few years. The contracts do not suggest that such an outcome is necessarily likely, but only that some traders view it as a potential profitable position. The fact that traders are buying up these kinds of contracts suggests that the markets are starting to believe that today's severe cutbacks in exploration and development will create the conditions for a supply shortage somewhere down the line.
By Evan Kelly of Oilprice.com
OilPrice.com
According to consulting firm McKinsey, the current oil futures market is pointing to a coming balance between demand and supply-a balance which has the potential to render most oil and gas investments uneconomical.The futures market is often a reliable guide to forcasting the future direction of oil prices, and analysts rely on both contangos or backwardation when determining their forecasts.
During a supply glut, a contango is typically observed. This is a condition where the spot price for future contracts is far higher than the current price for nearby contracts. This means that people are willing to pay more for a commodity sometime down the road than the actual price for the commodity.
Backwardation is noticed when the current demand is higher than the supply, thereby making the nearby contracts costlier compared to future contracts.

(Click to enlarge)
Until around 2005, backwardation was the normal condition, as seen in the charts. But since 2005, contango has become the normal condition, reports Reuters . Experts differ on their views regarding this shift.
Large contango is indicative of market bottoms. During the 2008-09 crude oil crash, the oil market witnessed a super-contango, when the price difference between the first month and the seventh month contract had reached up to $10 per barrel.
Similarly, during the current crisis, the contango reached $8 per barrel twice, once in February of 2015 and again in February of 2016, as shown in the chart below, after which, the markets bottomed out.

(Click to enlarge)
Related: Aviation Giants To Ramp Up Biofuels Usage
During the 1985-2004 period, the average backwardation was $1.07 per barrel, and during the 2005-2014 period, the average contango was $1.50 per barrel as shown in the chart below. The current contango hovers around $2 per barrel, which is close to the average during the 2005-2014 period.

(Click to enlarge)
The current oil crisis is unlike the oil crisis of 2008-2009, as there is no demand destruction this time. Demand for oil is on the rise and is likely to increase by 1.5 million barrels per day, both in 2016 and 2017, according to the latest Short-Term Energy Outlook by the U.S. Energy Information Administration.
In the short-term, the supply outages to the tune of 3 million b/d have supported oil prices by easing the supply glut and restoring the balance between supply and demand. If supply is restored, the oil markets will again return to a surplus, putting pressure on prices.
Due to low oil prices, billions of dollars in investments have either been scrapped or postponed. As and when the markets shift from surplus to deficit, new supply will find it difficult to catch up with increased demand. Markets need higher prices for investments to start trickling into the industry.
However, consulting firm McKinsey believes that oil demand will peak around 100 million barrels per day by 2030 from the current levels of 94 million barrels per day.
Related: Why Did Natural Gas Prices Just Rise 25% In Two Weeks?
"This change is driven by three factors: first, overall GDP growth is structurally lower as the population ages; second, the global economy is shifting away from energy-intense industry towards services; and third, energy efficiency continues to improve significantly," McKinsey's Occo Roelofsen said. "Peak oil demand could be reached around 2030", reports The Telegraph.
If oil demand behaves according to Mckinsey's expectations, most new investments into oil will be uneconomical due to weak demand in the future.
Though the long-term is slightly uncertain, balance is maintained in the short-term. Unless we see supply outages restored, prices are likely to remain in a small range following an impressive run.
By Rakesh Upadhyay of Oilprice.com
finance.yahoo.com
The oil price is making a fool of everyone. That's according to Steve Schwarzman, cofounder of private-equity giant Blackstone. The billionaire investor was speaking at the Bernstein Thirty-Second Annual Strategic Decisions Conference 2016 on Thursday, and talked about the volatile oil price.
He said:
Let's just take energy first because it's in the news a lot. And talk about a crazy business where there's almost not one person who knows what they're doing, right? At $120, it was going to $140 a barrel. When you were at $80, it was going to stabilize at $60. And when you're in $60, you didn't quite know, but maybe it would be $50 to $70. And then when it went to $24, everybody is a bozo, right? And then it was going to stay there, sort of $25 to $35 or maybe $40 for the next year or two, and now it's $50.
We've seen crazy swings in oil prices this year, largely driven by slowing demand, increased supply, and speculation over a potential coordinated cut in the production of oil. US oil prices ended slightly lower on Thursday after briefly rising above $50 a barrel in intraday trading.
Schwarzman said that his favorite person to talk to when trying to make sense of the oil market was Exxon CEO Rex Tillerson. He said:
When the price's around $60, I asked Rex, "What do you think?" He said, "Well, it's going to be between $20 to $120, and we're set up for all of those environments. I think it'll go a little lower than higher, but what do I know? I've just been doing this my whole life." And I thought, he's kidding, but he really wasn't.
naked capitalism
PlutoniumKun , May 31, 2016 at 4:27 amrjs , May 31, 2016 at 7:33 amIts interesting – I've been baffled by the apparent confidence of the markets in rising prices, and so far it seems they've been right. But I think we'll only know for sure later in the year. I suspect $50 will be the signal for a lot of struggling tight oil operators to open up their fracked but sealed wells, so there might be an unpleasant surprise for the bulls in the US market, if not elsewhere.
likbez , June 1, 2016 at 9:11 pmoil bulls were saved by the Fort McMurray wildfire and the Niger Delta Avengers; see the graphic from Goldman here: http://focusonfracking.blogspot.com/2016/05/update-on-oil-prices-whats-moving-them.html
I suspect $50 will be the signal for a lot of struggling tight oil operators to open up their fracked but sealed wells
Most probably you are wrong. LTO producers lost access to unlimited financing from Wall Street. They can't finance expansion from their cash flow (which is still negative), so they are cooked. Wells you are talking about were drilled, but not fracked. Drilling is only one third of the total cost of the well. So those two-thirds that are needed to complete the well is a problem. And will the particular well generate positive cash flow if oil price remains in $50-$60 range is another problem. Money spend on drilling are debt. Most shale wells will not compensate with their total production the amount of debt and interest.
They need around $80 per barrel to revive their operations.
oilprice.com
If the whims of oil speculators are anything to go by, then another oil price downturn looks increasingly unlikely.Oil prices have gained more than 80 percent over the past three months, bouncing off of $27 lows in February to hit $50 last week. Those sharp gains raised the possibility of another crash in prices because the fundamentals still appeared to be bearish in the near term.
By early May, oil speculators had built up strong net-long positions on oil futures, extraordinary bullish positions that left the market exposed to a reversal. Speculators had seemingly bid up oil prices faster than was justified in the physical market.
But the physical market got some help. The massive supply outages in Canada (over 1 million barrels per day) and Nigeria (over 800,000 barrels per day) provided some support to prices, erasing some of the global surplus.
Related: When Will Solar Overtake Oil?
Now speculators who had started to short oil in May have retreated, pushing short bets down to an 11-month low. "If you've been short since February this has been a very painful ride," Kyle Cooper, director of research with IAF Advisors and Cypress Energy Capital Management, told Bloomberg in an interview. "There are always a few die-hards but otherwise you'd want to get out. This is indicative of the improving fundamentals."
peakoilbarrel.com
Heinrich Leopold , 05/25/2016 at 9:48 am
The weekly status report for last week is out:likbez , 05/25/2016 at 1:53 pm
http://ir.eia.gov/wpsr/overview.pdfProduction fell just 24 000 b/d and week. However, the previous number has been revised downwardly by around 50 000 b/d and the recent number is down over 70 000 b/d, which is enormous and contributes very much to the recent oil price rise. US production is down by over 6.4% and net product exports fell considerably. This is exactly the right thing to do to bring oil prices up again.
US oil production is now in its freefall phase and this makes me very optimistic about future oil prices.
Ron Patterson , 05/25/2016 at 3:08 pmUS oil production is now in its freefall phase and this makes me very optimistic about future oil prices.Not so fast.
I am pretty positive that the worst days for the conventional oil are over, and "carpet drilling" days for LTO are also history.
But the health of the USA economy in late 2016 and 2017 is a big open question and it might provide the celling for the oil prices. One of the key factors that prevented sliding of the US economy into the continuation of Great Recession in 2014 was the dramatic drop of oil prices, which started in the second half of 2014. So in 2014-2016 the resilience of the US economy was partially due to this "low oil price" factor.
But the effect was pretty small; due to this the FED was not able to "normalize" interest rates (they made only one hike) and now can face the new phase of the recession with all the ammunition already fired.
Impoverishment of the low 80% of population makes the recovery impossible; neoliberalism makes the redistribution of gains in favor of lower 80% impossible (most of the gains go to the top 0.1% - the financial oligarchy; top 20% probably hold their own; everybody else are gradually sliding into poverty). So this is a deadlock situation.
Ves wrote something about his views on this subject in this thread and as far as I recall he thinks that without artificially low interest rates the game is over.
So when oil price recovers to $80-$100 price band the stimulating role of low oil prices on the economy will be gone. From this point it might be a bumpy ride…
The EIA's Monthly Energy Review is out today with production data for April. US C+C production fell 123,000 barrels per day in April to 8,915,000 barrels per day. US lower 48 fell 100,000 bpd while Alaska fell 23,000 bpd.This data matches the weekly data very close. 8,915 K barrels per day is the average for April, not the production on the last day or the last week. The EIA has production for the third week in April at 8,767 K barrels per day. So it looks like US production will fall about the same amount in May as it fell in April, about 125,000 barrels per day.
US C+C production has fell 779,000 barrels per day since peaking one year ago in April.

peakoilbarrel.com
WTI and Brent spread has closed quite a bit lately. Anybody heard what the crooks at the tbtf mega banks are giving as an excuse?
Citi just announced that crude was headed to 50 a barrel in Q3, that's a pretty amazing call seeing as how it's pushing 49.50 right now. Those "analysts" probably will get a huge bonus for making that call right?Anybody got a handle on overall accurate storage stats? I believe that we are heading into a period that oil in storage and market sentiment will be more important than production at some point. At least I'm hoping we are getting there. That'd be a great idea for a new post Dennis. Oil in storage. But there are no stats on private storage in the lower 48 right? Hell, me and my two best business buddies have 25 thousand barrels in our tank farms right now. And we are small fry compared to the gangster bank backed shale guys.
oilprice.com
There have always been three routes out of the unsustainably low prices: natural decline/growth of supply/demand, collaboration constraints on supply, and military conflict. Since January, while the talk of a growth freeze had no effect whatsoever on actual supply, the natural decline/growth did reduce the overhang by a couple of hundred thousand barrels of oil per day. Meanwhile, two little-discussed and less-understood military interventions took a combined 900,000 bopd out of supply in a virtual instant.
The history of attacks by rebels on oil infrastructure in the Niger Delta and the coincident prosecution of a former rebel superficially suggested that this attack was another in protest. On the other hand, responsibility for the attack was first claimed two months after the fact and by a group not previously known to exist, namely the Niger Delta Avengers. Moreover, the sophistication of the attack diverges from the historical airboat-and-AK style of rebels in the region.
A similarly mysterious outage affected 600,000 bopd out of northern Iraq. Located in a region of multi-lateral conflict and poor transparency, this interruption could be easily dismissed. Nevertheless, the fact remains that the exact cause of this major supply interruption was not publicly claimed or understood by any of the parties.
oilprice.com
Goldman Sachs ... pronounced that the oil market is shifting into a deficit 'much earlier than expected', as a fourth Nigerian crude grade, Qua Iboe, comes offline due to a damaged pipeline. As demand growth continues to show strength, and outages start to add up, Goldman Sachs suggests that the market has shifted into a deficit this month:
OilPrice.com
On May 11th the U.S. Energy Information Administration (EIA) reported that U.S. crude oil production declined by 206,000 barrels per day over the six weeks ending May 5, 2016. In the same weekly report:
- U.S. crude oil inventories unexpectedly fell by 3.41 million barrels during the week ending May 6, 2016
- Gasoline inventories declined by 1.231 million barrels
- Distillate stockpiles fell by 1.647 million barrels
• The International Energy Agency (IEA) say the annual summer spike in demand for transportation fuels has begun.

When the oil markets are oversupplied, the speculators which control the oil futures markets tend to ignore supply outages that they consider short-term. For example, the forest fires in Alberta that shut-in more than a million barrels per day of Canadian heavy oil products in early May did not seem to have much impact on the price of oil. As supply and demand move back into balance, an outage of that size will send the NYMEX strip prices sharply higher. The oil sands projects shut in by the fires are now coming back on-line, but it will take months before production is fully restored.
Nigeria has much bigger problems
On Friday, May 13 an explosion closed a second Chevron facility in Nigeria, Africa's biggest oil producer. The explosion was the result of an attack by militants who are upset with their government. 70 percent of Nigerians live on less than $1/day. They see the "Top 1 Percenters" living like kings, while they have trouble finding enough food to eat. Apparently, they have money enough for guns and explosives.
Exxon Mobil also reported on May 13 that a drilling rig damaged a pipeline, shutting off more production of crude. Nigeria's oil production was already down 600,000 barrels per day before these two incidents, primarily the result of militant attacks. Shell is now evacuating workers from its offshore Bonga oilfield following a militant threat. Shell's Forcados export terminal has been shut down since a February bombing. To say Nigeria is a mess is an understatement.
Adding to the country's problems is the fact that they are over a year behind in paying invoices for oilfield services. Schlumberger Ltd. (SLB) has pulled personnel and equipment out of Nigeria, apparently tired of running up the bad debts.
Venezuela: Another OPEC nation on steep decline
Latin American oil production is now down close to 500,000 bpd from year ago levels.
On May 6, Bloomberg reported that Halliburton (HAL) has joined rival Schlumberger in curbing activity in Venezuela due to lack of payment during the oil industry's worst financial crisis.
"During the first quarter of 2016, we made the decision to begin curtailing activity in Venezuela," Halliburton, the world's second-largest oil services provider, said May 6th in a filing with the U.S. Securities and Exchange Commission. "We have experienced delays in collecting payment on our receivables from our primary customer in Venezuela. These receivables are not disputed, and we have not historically had material write-offs relating to this customer," the company said.
Halliburton's receivables in Venezuela rose 7.4 percent in the first quarter to $756 million compared to the end of 2015, representing more than 10 percent of its total receivables, the Houston-based company said. If you own Halliburton stock, prepare yourself for a big bad debt expense later this year.
On the demand side of the equation, May is the beginning of an annual spike in demand for hydrocarbon based liquid fuels. In their monthly Oil Market Report dated May 12, 2016 the International Energy Agency (IEA) forecasts that demand will increase by 1.66 million barrels per day from the first quarter of this year to the third quarter.
If history repeats itself, the demand spike will be even larger. In 2010, the final year of the last major oil price cycle, the IEA began the year forecasting a 1.0 million barrel per day increase that year. Actual demand growth was 3.3 million barrels per day. The forecast error made in 2010 was that IEA's formula for calculating demand, did not consider the impact of lower fuel prices on demand. I believe they've made the same mistake this time around.
Key points from the IEA report:
- Global oil demand growth for 1Q16 was revised upwards to 1.4 mb/d, led higher by strong gains in India, China and, more surprisingly, Russia. Russia had a cold winter and they still use a lot of oil for space heating.
- Oil inventory builds are beginning to slow in the OECD; in 1Q16 they grew at their slowest rate since 4Q14 and in February they drew for the first time in a year.
- "Changes to the data in this month's Oil Market Report confirm the direction of travel of the oil market towards balance. The net result of our changes to demand and supply data is that we expect to see global oil stocks increase by 1.3 mb/d in 1H16 followed by a dramatic reduction in 2H16 to 0.2 mb/d."
- "We have left unchanged our outlook for global oil demand growth in 2016 at a solid 1.2 mb/d. However, for 1Q16 revised data shows demand growing faster at 1.4 mb/d, in spite of the northern hemisphere winter being milder than usual. This strong 1Q16 performance might raise expectations that demand will remain at this stronger level causing us to raise our average figure for 2016." As you can see by this statement, IEA is already seeing the error in their forecasting model. Like most government agencies, they will never come out and say they screwed up.
During the first quarter, oil prices were under pressure from predictions that China's demand for oil would soften this year. Chinese demand growth has slowed down from the rapid pace of the prior ten years, but it is still going up. This is thanks in part to sales of SUVs that are still climbing in China. Apparently the Chinese people are becoming more status driven (like Americans), owning an SUV in China indicates your family has joined the Upper Middle Class.
Per the IEA report, India is rapidly becoming the leader in global demand growth. Oil demand in India increased by 400,000 barrels per day year-over-year in the first quarter.
Related: Does Tesla Care About Its Stock Price?

(Click to enlarge)
Conclusion: History Repeats Itself
I have worked in the upstream energy sector for 38 years. During my career the industry has survived six major and a few minor oil price cycles. It will survive this one because the products made from crude oil, natural gas and natural gas liquids (NGLs) are critical to the world economy. Our high standard of living depends on a steady supply of oil.
Oil price cycles do not end well. The big ones, and this is one of the biggest ever, overshoot the mark and result in a supply shortage. With OPEC now producing flat out, there is very little excess production capacity in the world. After the end of 2016, when oil supply and demand are back in balance, all significant supply outages (i.e. Canadian fire, Nigerian militants, ISIS attacks in the Middle East, etc.) will send crude oil prices skyrocketing. The Wall Street analysts that are saying we will never see oil over $100/bbl again will be eating those words.
Oil prices do not go up or down in a smooth line, as you can see in the chart above. Investors that can look past the short-term noise and invest in the best companies will harvest market beating gains as this cycle moves back to the long-term trend.
By Dan Steffens for Oilprice.com
peakoilbarrel.com
likbez , 05/05/2016 at | 8:13 pmthere ain't nobody there to fight the good fightGreenbub , 05/05/2016 at 10:09 pmJudging from price action today there are efforts to kill oil rally. I think if banks profits from oil trading can drop like a stone, we collectively will be better off. They desperately try to preserve the unnatural and ultimately destructive level of rent extraction from the oil industry they've managed to create.
Looks like the whole Wall Street is now in "apres moi, le deluge"(after me deluge, https://en.wikipedia.org/wiki/Apr%C3%A8s_nous_le_d%C3%A9luge ) mode.
All these disruptions and oil is still trading down. Don't make no sense.shallow sand , 05/06/2016 at 7:36 amGreenbub. I can only give a sarcastic response.Greenbub , 05/06/2016 at 7:53 amFirst: Tesla is going to sell so many electric cars so soon, based on their CC from yesterday.
Second: Continental Resources announced a wonderful quarter, and apparently $30 oil and $1.75 natural gas is no big deal.
I need to stop reading conference call transcripts. Never have I seen so much happy talk from two companies who are in debt up to their eyeballs and posting losses quarter after quarter.
Oh, I forgot, both are changing the world.
Even with the dollar down, oil is still down. What gives?likbez , 05/06/2016 at 3:03 pmDon't be so silly. Oil price below the cost of production is an anomaly and normalization is inevitable despite all efforts by Wall Street, the US government and EU to slow down this process to preserve neoliberal globalization, which is threatened by high oil prices.likbez , 05/06/2016 at 6:29 pmThey might have a year to run of fumes, but I doubt that more then that. And as a result of their valiant efforts the normalization might happen at the level above $80/bbl. Then what?
It is very easy to destroy an industry. And neoliberals proved to be pretty adept in this task while fattening their valets. In this case the USA oil industry. Generally destruction is a much easier task that building/rebuilding something. Nothing new here, move on.
"After me deluge" mentality might eventually lead to some neoliberals hanging from the lamp posts. They consider themselves to be aristocracy, so that will be pretty fitting.
"Let them eat cakes" did not work too well in the past. Same with oil shortages. "History Does Not Repeat Itself, But It Rhymes" - Mark Twain.
Hi Shallow Sand,Massive debt is now like the sword of Damocles hanging over the whole shale industry. And that created qualitatively new situation with reaction of the industry on rising oil prices delayed and more muted then at times of "carpet drilling". Even money to complete DUCs are now a scarce commodity. Everything goes to debt repayment. In addition many companies will be forced to sell assets like Chesapeake:
Here are thoughts from
http://oilprice.com/Energy/Oil-Prices/Why-Oil-Prices-Will-Rise-And-Many-Pundits-Will-Be-Caught-By-Surprise.html
that pretty well resonate with your line of thinking about the problem.Prices have dropped to levels destroying capital, bankrupting businesses, idling massive amounts of equipment and manpower. The cycle is reversing now. The weekly EIA numbers are showing steady declines in production (this is a balancing item – not real production estimates) and also increasing demand – In the United States.
The IEA is showing the same thing in their monthly report that has a decent look at the G7 countries and attempts to look at the G20. Between these two, there is a large world with little accurate measurement. China for instance jailed a Platts reporter for espionage when he tried to put together a fundamental energy statistics database.
Inevitably, we will have another price shock – or at minimum an upside surprise. It's unavoidable at this point.
Oil never transitions smoothly. Just like all the oil bulls had to be run out during the declining price stage, all the price bears, like Dennis Gartman, will be run out when fundamentals hit them over the head. Gartman, to his credit, will change his tune 180 degrees when he sees the actual data shaping up. That's how he has survived so long and profitably as a trader.
But by then it will be too late, the world will want incremental supplies immediately – yet the industry cannot scale in real time. In order to motivate producers to get busy and provide incremental supplies, prices must increase sharply from current levels.
My prediction – $80/bbl in 18 months, but it won't last very long. I think $60 – $70/bbl is a healthy range.
peakoilbarrel.com
JustSaying , 05/02/2016 at 1:25 pm
"Crude oil ended the month of April with the strongest monthly gain in 7 years, adding 22% to the price. The low price caused "production destruction" and strong demand put the market on a trajectory of market balance.""We have said that oil prices have bottomed and the chief of the International Energy Agency (IEA) agrees. "In a normal economic environment, we will see the price direction is rather upwards than downwards," IEA Executive Director Fatih Birol said on Sunday during a G7 meeting of energy ministers in Japan as reported by Reuters. He took the words right out of my mouth. Barring any unforeseen economic catastrophes, the global oil market is at the low end of the cycle. We have said for some time that now is the time to start positioning for a long term bullish move. The low price that we saw in crude oil earlier this year may be the last time we see that for over a decade. "
"Even as some shale operators say that they may actually bring on rigs after we hit $50 a barrel, the truth is that many of the smaller operators will find it hard to bring rigs back on."
peakoilbarrel.com
AlexS, 05/01/2016 at 7:24 pmRystad's projection for shale oil and gas production has always been more optimistic than forecasts made by the EIA, IEA and OPEC.Rystad's current upbeat outlook can be partially explained by their oil price forecast.
From an article in "Straits Times":
http://www.straitstimes.com/business/oil-tipped-to-rebound-to-us60-this-year
Oil could rebound to US$60 to US$70 a barrel by the end of this year as increasing demand starts to cut into the supply glut for the first time in years, according to an industry analyst.
Mr Jarand Rystad told a forum yesterday that with oil companies cutting back heavily on investments, the crude oversupply will quickly turn into shortage and, in turn, drive prices up.
In his keynote speech at the Offshore Marine Forum yesterday, Mr Rystad, managing director of Norwegian-based energy consulting firm Rystad Energy, added that oil could reach US$105 a barrel by 2020.
"This is just a classic commodity cycle… not a structural shift," he said, noting that global oil consumption is still robust, while alternatives such as liquefied natural gas will likely have a visible impact on energy demand patterns only decades later.
But the bigger worry, he warned, is that the massive investment cutbacks could lead to another period of cost inflation. "It is very dangerous to start to scale the industry," he said, citing how oil companies are adjusting their capacity to only a quarter of what it needs to be on a sustainable basis.
"Oil companies and oil service companies are laying off too many people. If you're starting to scale, you will end up with far too low a capacity. Then you'll have to hire new people (when the industry recovers) and then you're back to the problem of cost inflation."
OilPrice.com
IEA's chief Fatih Birol has chimed in on the topic today, highlighting low oil prices have cut investment by about 40 percent over the past two years, and how the sharpest falls have been in the U.S., Canada, Latin America and Russia.4) A study by Wood Mackenzie (chart = h/t @WoodMacKenzie) highlights that the trend of lower investment is set to persist. Their study projects $91 billion in capex cuts across 121 upstream companies this year:
... ... ...
6) Finally, the EIA has analyzed the annual reports of 40 publicly-traded U.S. oil producers, highlighting the significant differences in their financial situations. The group as a whole saw combined losses of $67 billion last year, although these losses varied wildly from company to company.
Eighteen of the forty companies experienced losses in 2015 in excess of 100 percent of their equity (termed as high loss companies – HGLs). The driving force behind the HLG's deteriorating financial conditions was leverage; their long-term debt-to-shareholder equity ratio averaged 99 percent, compared to the non-HLGs whose debt was at much-lesser level of 58 percent of shareholder equity.
Not only were the HLGs the most leveraged, but their assets were revised down the most too. Last year the 18 HLGs saw a 21 percent reduction in proved oil reserves, while the non-HLG group saw a drop of just 6 percent. The lower reserves for the HLG group caused impairment charges, decreasing the value of their assets. This lower asset value is ultimately reflected in lower credit availability to these companies.
finance.yahoo.com
Oil rose in early trade after the International Energy Agency (IEA) said non-OPEC production would fall this year by the most in a generation.
IEA chief Fatih Birol said low oil prices had cut investment about 40 percent over the past two years, with sharp falls in the United States, Canada, Latin America and Russia.
www.cnbc.com
Global oil prices and stock markets tumbled on Monday after major oil producers failed to agree on a deal to freeze output, but analysts are insisting that no deal is actually the best possible outcome for markets.
... ... ...
Despite the collapse of talks, oil market watchers said the lack of a "Doha deal" would be better in the long term and would mean that a rebalancing process of supply and demand can continue to its natural conclusion.
... ... ...
Goldman said on Monday that it was maintaining its fourth-quarter 2016 forecast of $45 a barrel for WTI crude and said that its full-year 2017 average WTi forecast was $58 a barrel, Reuters reported. In the short-term it said its forecast for $35 a barrel for WTI in the second quarter was now "more likely" following the decision not to freeze production.
www.cnbc.com
The founder and CEO of Continental Resources, who previously told CNBC that "the fundamentals of supply and demand were really close," reiterated during a "Power Lunch" interview on Monday that this year's third-quarter will absorb most of the excess oil supply, which in turn will lead to "stronger pricing."The billionaire suggested that oil is past an inflection point and prices have surged 50 percent from previous lows. Hamm foresees crude prices soaring to $60 a barrel by the end of the year, as lower oil prices are unsustainable. He contends, however, that even when the oil "overhang goes away," ramping up production will take U.S. producers a long time, as rig counts are at an all-time low.
He added that U.S. rig counts "are down 77 percent."
...Hamm argued that oil producers in the Middle East are "pretty much tapped out."
peakoilbarrel.com
AlexS , 04/19/2016 at 9:06 pm
Analysts from Sanford Bernstein believe that growing demand may bring one more super-cycle in oil prices.From Bloomberg:
Forget Doha, Oil Demand Could Create Another Super-Cycle by 2030
Emerging market economies will increase global oil demand about 1.4 percent a year through 2020, stronger than the past decade, Bernstein analysts said in a research note e-mailed today. Demand will peak between 2030 and 2035, creating a window for one final spike in prices before the fossil fuel begins its inexorable slide to irrelevance amid greater fuel efficiency and more electric vehicles.
"We still believe that there could be one more super-cycle in oil before demand peaks in 2030-35," Bernstein said in its note. "Assuming tight oil peaks out before demand does, it could result in another period of supply tightness as OPEC becomes a dominant force in supply, just as it did in the 1970s."
The world is well supplied with oil, which will keep the average price between $60 and $70 a barrel through the end of the decade, Bernstein said. The relatively low prices will lead to more use, with demand growth from 2016-2020 expected to be the highest since 2001-2005.
Emerging economies will spur global oil demand growth from 94.6 million barrels a day last year to 100 million by 2020 and 108 million between 2030 and 2035. In developed countries, crude demand is beginning to shrink amid improvements in energy efficiency and as consumers switch to alternative fuels, outweighing expanding populations and economic growth.
If U.S. shale oil production peaks before demand does, the world will have to go back to higher cost oil production, such as deepwater and Canadian oil sands, necessitating higher prices to justify investment. In previous super-cycles in the 1970s and 2000s, inflation-adjusted oil prices rose about tenfold, Bernstein said.
In the long run, oil demand will peter out to about 20 million barrels a day by 2100 as the world becomes more energy efficient and switches to lower-carbon energy sources. As that happens, the intensity of oil decreases and economic growth no longer creates crude demand growth.
OilPrice.com
Oil traders see the bottom for crude prices. After nearly two years of a down market, oil traders are growing confident that we have passed the low point. "The down market is behind us," Torbjorn Tornqvist, CEO of Gunvor Group Ltd., said on Tuesday at the FT Global Commodities Summit in Lausanne. "It is the beginning of the end of that for sure." Although there will be a lot of volatility for quite a while, Tornqvist said that "from here on, the trend is up." The CEO of Trafigura Jeremy Weir echoed that sentiment at the commodities summit. "I believe we've seen the bottom unless there is some sort of catastrophic situation political or otherwise," he said. Glencore's (LON: GLEN) top executive was a little more cautious, arguing that a rebound would not be quick because of the large stockpiles of oil that need to be worked through.
... ... ...
U.S. banks hit by energy. Major U.S. banks are set to report earnings this week, and many are facing regulatory pressure from the Federal Reserve, the Federal Deposit Insurance Corporation and the Office of the Comptroller of the Currency to reduce their exposure to risky energy companies. Most banks insist that energy is a small part of their portfolio, but the FT reports that the banks' trading and investment banking units could report their worst quarter since the financial crisis in 2009, although much of that is likely due to turmoil in global financial markets. Still, credit re-determinations are wrapping up, and many analysts expect cuts of 15 to 20 percent on average to the credit line for oil and gas companies.
finance.yahoo.com
Researchers at Bernstein expect global oil demand to increase at a mean annual rate of 1.4 percent between 2016 and 2020, compared with annual growth of 1.1 percent over the past decade.
"We expect oil markets to rebalance by the end of 2016. This will allow prices to recover towards the marginal cost of $60 per barrel," Bernstein said, adding that it expects global demand to reach 101.1 million bpd by 2020, from the current 94.6 million bpd.
OilPrice.com
There's not much money in new well drilling these days. In fact, the latest figures from the American Petroleum Institute (API) reveal a 70 percent annual decline in new natural gas well completions along with a staggering 90 percent drop in new oil wells as of the start of April.The drop hardly comes as a surprise, especially in the light of the continual reduction in active drilling rigs across the U.S. as reported on a weekly basis by Baker Hughes. As of April 8, there were 354 active oil rigs-8 fewer than the week before, and 406 fewer than a year ago. The number of active gas rigs was 89, down from 225 on April 8, 2016.
Given the low oil and gas prices that have pushed many energy firms to the brink of bankruptcy, these developments were only to be expected, although they are certainly worrying with regard to the resilience of some players in the sector. Yet, gloomy as the news seems, its implications for the future are rather positive.
Prices of crude oil and natural gas are at multi-year lows. Producers are not just shrinking production; they are also laying off staff in the thousands. Over the short-term, this will help them, or at least some of them, to survive. In the medium-term, however, production curbs and layoffs will benefit the energy industry in another way: it will make them temporarily less capable of responding to the growing demand for oil and gas. And demand will grow.
A report from Bernstein puts the mean growth rate for oil demand at 1.4 percent annually for the next five years, up from 1.1 percent for the last decade. The International Energy Agency expects average annual demand growth of 1.3 percent, much of which will come from non-OECD economies.
oilprice.com
The U.S. saw oil production fall by 14,000 barrels last week. The U.S. oil industry has posted consistent declines in recent months, and while the weekly data from the EIA is sometimes inaccurate, the best guess is that the U.S. is producing 9.008 million barrels per day right now. While it could take weeks or months to know conclusively, the U.S. could be about to drop below the key threshold of 9 million barrels per day in oil production.
... ... ...A massive fire hit ExxonMobil's (NYSE: XOM) refinery in Baytown, Texas on April 7, spewing black smoke into the air. The fire was extinguished and there were no injuries reported.
OilPrice.com
Oilprice.com: The IEA has been accused of overestimating global supplies. The WSJ says that somewhere around 800,000 barrels per day are unaccounted for, meaning they are not consumed nor have they ended up in storage. Are these "missing" barrels a big deal?
Mike Rothman: The issue has not been one of the IEA over-estimating supply, but rather under-estimating demand. There are basically two ways to arrive at figures for global oil demand. The IEA methodology is built on an estimate of GDP and an assumed ratio of oil demand growth to GDP growth.
... ... ...
OP: The oil industry is making massive cuts in investment. Should we be bracing ourselves for a price shock at some point in time? If yes when do you see this occurring?
MR: You cannot cut CAPEX and reduce upstream activity and somehow think future production growth goes unaffected. We forecast non-OPEC supply to contract this year for the first time since 2008. That was a way-out-of-consensus call to make a year-ago when most pundits vigorously argued non-OPEC production would still expand even with the drop in oil prices. What we've communicated to our clients – and those we deal with directly in OPEC – is that the spike down in oil prices is basically setting up an eventual spike up.
OP: Will bankruptcies in the U.S. shale industry do anything to balance the market?
MR: We expect that it will feed into the contraction we forecast for U.S. output. We also see the credit availability issue as likely being a limiting factor moving forward, sort of like what we saw in 1986 and then again in 1999.
... ... ...
OP: Lenders to the oil and gas industry have been fairly lenient with companies. Do you believe that the banks will start to tighten the screws a bit more as the periodic credit redetermination period finishes up?
MR: The old joke is that bankers are the guys who will lend you an umbrella and then ask to have it returned as soon as it starts to rain. Yes, we think lending will become much more highly scrutinized and financing less readily available.
oilprice.com
...most analysts agree that the sharp drop in Capex budgets, not just among shale producers, will have its effect on sharply lowering production this year and putting growth in reverse, efficiencies and well cost reductions notwithstanding. What's critical to note is how the media, and surprisingly most analysts, see global oil merely through the prism of U.S. independent shale players. To me, this is the critical grave mistake they make. Recent lease outcomes in the Gulf of Mexico, problems in Brazil and the likely end of spending for all new Russian oil projects are just a few of the other gargantuan gaps in global production we're likely to see after 2016.
... ... ...
While the EIA and most other analysts agree that sharp capex drops will begin to have their halting effects on oil production, they tend to argue over when those production drops come and how steep they will be. In all cases, they argue that any drop in production will be answered by a rally in oil prices, to the degree that U.S. shale players again 'turn on the spigots' and reestablish the gluts that have kept us under $50 a barrel for most of the last year. In this scenario, production never – or at least exceedingly slowly – rebalances to match demand.
I see it much differently. I could argue that the shale players, even with their low well drilling costs and backlog of 'drilled but uncompleted wells' (DUCs) cannot in any way repeat their frantic production increases they achieved from 2012-2014 ever again. I believe this because of financing constraints and the lack of quality acreage among other reasons – but I don't have to even "win" this predictive argument.
Longer-term projects from virtually all other conventional and non-conventional sources that have not been funded for the past two years will see their results, in that there won't be the oil from them that was planned upon. Chevron estimated in 2013 that oil companies would have to spend a minimum of $7-10 trillion dollars to 2030 to merely keep up with demand growth and the natural decline of current wells. And this was without factoring in the drop in exploration spending that is occurring now and throughout the next two years. Severe capex cuts from virtually every oil company and state-run producer over the last two years has put this necessary spending budget way behind schedule.
You can see why I tend to have a much more radical view of the decline line in production beginning in late 2016 and lasting, in my view, at least until the middle of 2018, when production again only begins to get the funding (and time) it needs to try and "catch up".
... .... ....
of Oilprice.com
www.nakedcapitalism.com
peakoilbarrel.com
Ron Patterson , 03/31/2016 at 5:04 pmNorth Dakota rig count finally breaks the big 3 0… It just hit 29 with one still listed to stack.Dennis Coyne , 03/31/2016 at 7:30 pmAnd to think, this happened while oil was at the amazing high of $39 per barrel. Or somewhere near there anyway. :-)
 Hi Ron,Ron Patterson , 03/31/2016 at 7:55 pm
WTI averaged $30/b for the month of February. Do you believe oil prices will remain under $40/b for the remainder of 2016? I do not. Output will fall by 700 kb/d in the US to 8450 kb/d by the end of the year and oil prices will rise, to $50/b or more in my opinion.
Dennis, I have no idea where oil prices will remain for the remainder of 2016. But there is one thing I do know, that is if oil prices remain in the region of $39 a barrel then production will definitely continue to fall and fall rather dramatically. And that is not just in the USA but around the world.Dennis Coyne , 04/01/2016 at 8:51 amA prolonged price of $39 dollars a barrel would be devastating for the oil industry.
Yes, I do believe oil prices will rise. But they will have to rise to a lot higher than $39 a barrel, or even $50 a barrel. $50 a barrel will not be high enough to cause world production to start to increase again.
Any increase in production caused by an increase in price to above $50 a barrel would have to come from the US and Canada. That is because oil at above $100 a barrel did not cause oil in the rest of the world, outside the US and Canada to increase in the last five years. Well, that is outside of OPEC. OPEC, or Persian Gulf OPEC, is another matter. That is because politics come into play here and not just geology.
Hi Ron,I agree, $39/b will not cause the decline in output to stop, but my guess is that the decline would be faster at $30/b than at $40/b and faster at $40/b than it would be at $50/b. In fact at $50/b the decline might stop eventually, but I agree with Guy who suggested $60/b will be needed to get drilling to increase and probably more like $80/b for 6 months before any noticeable increase in US and Canadian output. That might not occur until 2018, it will depend on the World economy and demand for oil. I would be surprised if we had not reached $100/b by then unless there is a severe global recession between 2016 an 2018.
Mar 12, 2016 | FRACTIONAL FLOW
Any forecasts of oil (and gas) demand/supplies and oil price trajectories are NOT very helpful if they do not incorporate forecasts for changes to total global credit/debt, interest rates and developments to consumers'/societies' affordability.
- The permanence of the global supply overhang could be prolonged if consumption/demand developments soften/weakens and it is not possible to rule out a near term decline.
- Recent demand/consumption data for total US petroleum products supplied show signs of saturation which provides headwinds for any upwards movements in the oil price.
- While prices were high many oil companies went deeper into debt in a bid to increase production of costlier oil. Many responded to the price collapse with attempts to sustain/grow production in efforts to moderate cash flow declines and thus ease debt service.
- If the forward [futures] curve moves from a present weak contango (ref also figure 02) to backwardation, this would erode support for the oil price.
- Some suggest that growth from India will take over as China's growth slows.
Looking at the data from the Bank for International Settlements (BIS) there is nothing there that now suggests India (refer also figure 05) has started to accelerate its debt expansion. The Indian Rupee has depreciated versus the US dollar, thus offsetting some of the stimulative consumption effects from a lower oil price.The recent weeks oil price volatility has likely been influenced by several factors like short squeezes, rumors and fluid sentiments.
Near term factors that likely will move the oil price higher.
- Continued growth in debt primarily in China and the US. {This will go on until it cannot!}
- Another round with concerted efforts of the major central banks with lower interest rates and quantitative easing.
Rune Likvern , 04/01/2016 at 9:25 ampeakoilbarrel.com
Loooong is less than 100 years, but several years. Several years with oil prices, say below $70/b, will affect the supply side.Dennis Coyne , 04/01/2016 at 11:39 am
In this context a sustained oil price [$100+/b] lasts more than 5 years.
Sorry, I think it is difficult to be more precise as everything increasingly now seems to become fluid.
Rune,I appreciate your answer, that clarifies your statement a lot. I agree predictions in this environment are difficult, yours would be much better than mine, in my opinion.
Your prediction looks sensible to me. A few years with oil prices below $70/b will reduce supply, let's say until 2018, then maybe by 2019 oil prices rise to $100/b or more, if they remained under $125/b for 5 years (and more than $100/b) the World might be able to muddle along at slow growth of 1% to 2%, but that scenario does seem far fetched.
More likely is a spike in oil prices by 2022 or sooner to over $150/b (2016$) and then a severe recession within a year or two which will bring oil prices below $100/b.
This may not be what you have in mind, but it roughly matches a few years under $100/b and less than 5 years at more than $100/b and seems moderately plausible, at least to me.
www.yahoo.com
Oil prices have hovered at $40 per barrel for much of the last week, as the markets try to avoid falling back after the strong rally since February.
- Oil production in the UK actually increased a bit in 2015, after about two decades of steady declines.
- The additional 100,000 barrels per day came from new offshore oil projects that were initiated in 2012 when oil prices were much higher, plus extra oil squeezed out from existing fields.
- The collapse in oil prices has demolished investment in new projects, the results of which will be felt in the 2018 to 2021 timeframe, due to multiyear lead times. The number of new projects greenlighted in 2015 was less than half of the level seen in 2013 and 2014.
- As a result, beginning in 2018, the UK could see more severe production declines.
Investors see shale production falling and demand continuing to rise, which point to the ongoing oil market balancing.
But it is unclear at this point if the rally from $27 per barrel in February to today's price just below $40 per barrel is here to stay. Fundamentals, while trending in the right direction, are still weak.
finance.yahoo.com
OPEC and other major suppliers, including Russia, are to meet on April 17 in Doha to discuss an output freeze aimed at bolstering prices.
But with ballooning global inventories, signs some OPEC members are losing market share, plus little evidence of a strong pick-up in demand, analysts said oil is likely to trade in a range.
"There is a rebalancing on the way, but we are still running a surplus and stocks are building up as far as we can see," SEB commodities analyst Bjarne Schieldrop said.
"There is a clear risk for a pull-back in Brent crude oil with a return to deeper contango again. Long positioning in Brent is at record high and vulnerable for a bearish repositioning."
Data on Monday from the InterContinental Exchange showed speculators hold the largest net long position in Brent futures on record. [O/ICE]
U.S. commercial crude oil stockpiles were expected to have reached record highs for a seventh straight week, while refined product inventories likely fell, a preliminary Reuters survey showed late on Monday.
Barclays said in a note on Monday net flows into commodities totaled more than $20 billion in January-February, the strongest start to a year since 2011, and prices could fall 20 to 25 percent if that were reversed.
247wallst.com
While the recent surge of oil seems to have run into a wall at $40, one thing seems to be in place. The market lows appear to have been put in with the drop into the mid-$20s and subsequent bounce back, and at least one top firm we cover here at 24/7 Wall St. thinks the low for the cycle is in.
A new Jefferies research note says that for the first time in history global capital expenditures in the energy industry will have fallen for two consecutive years. In addition, a combination of demand growth and non-OPEC production declines could very well set the stage for a $50 price handle by the end of this year.
peakoilbarrel.com
Verwimp , 03/21/2016 at 6:48 pm
@ Dennis,likbez , 03/21/2016 at 10:12 pm
I was out in the woods last weekend, so I didn't have the opportunity to respond to your questions in last Ronpost.Dennis: "if you think that LTO output of 4.5 Mb/d can go to zero and OPEC, Canada, and Russia can make up that difference, I believe you are incorrect."
I believe LTO output of 4.5 Mb/d will go to (nearly) zero rather soon (5 or 6 years, so 2021 or 2022), but I do not believe OPEC, Canada and Russia can make up that difference."Is that your assumption? Do you believe OPEC will fill that 4.5 Mb/d gap"
No. My assumption is that gap will not be filled. My assumption is the world will encounter Peak Oil very soon (if not yet)."What are your assumptions about the future price of oil?"
That's a tough one. Despite the model provided above by Ian Schindler. Let me take a wild guess: WTI in the $70-$80 range by december 2016. $110 by mid 2017 followed by another collapse of the price, due to real problems in China or India."Do you think the Brent oil price will be $35/b in Dec 2016 (STEO forecast)?"
See above: Brent versus WTI will vary within a 15% margin from eachother – mayby Brent being the cheaper one during 2016. (If you ask why?: This is just gut feeling.)Verwimp,Verwimp , 03/22/2016 at 7:15 pmThank you for your input. Very interesting considerations, that actually correlate with my own thoughts on the subject. Especially possible return to recession in the second half of 2017 . I also feel that Brent might be very close to WTI from now on. Lifting export ban eliminated premium. Unless "artificial WTI" shipments spoil the broth.
One question. If we assume that is the return to recession in the second half 2017, will it necessary cause another collapse in oil prices; or may be downturn in oil prices will be more muted ?
One feature of the return to recession is the collapse of junk bond market, which makes financing of both shale and oil sands more difficult. And it typically happens before the actual economic downturn. That will make ramping up shale oil production in 2017 extremely challenging. High oil prices will be only of limited help, as there is no return to "good old days" of Ponzi financing of shale.
Even speculative financing (revolving credit, aka evergreen loans) is already under threat and will remain in this condition for the foreseeble future.
So shale players might have no money to re-start "carpet drilling" again.
I think difficult days are coming for US shale/LTO players and even temporary return to above $100 price range might not restore previous financing bonanza for them - with enough financial thrust you can make pigs fly, but you better do not stand in the place where they are going to land.
Of course they may be propped by the next administration for strategic reasons. Who knows…
Hi Likbez,I don't know. Really. I'm just trying to get grip on things like most of us. I't been a tough day in here in Belgium today. A lot of game changers might come to surface very soon. I mean very soon.
I don't know.
Sincerely,
Nathanael , 03/23/2016 at 2:14 am
BrunoThis is not investment advice, but I think both of you are correct.I've been working from an old Deutsche Bank analysis which expects big swings in the price of oil. The high prices cause demand to drop and the low prices prevent exploration from happening. Result: total oil production declines continuously.
03/23/2016 at 12:13 pm
Scrambling for cover, U.S. shale producers ramp up hedging
http://www.reuters.com/article/us-usa-oil-hedging-idUSKCN0WP09X
Struggling U.S. shale producers have scrambled to sell future output at their fastest pace in about six months in recent weeks, curbing a rebound in prices and potentially prolonging the oil market's worst rout in a generation, traders say. As spot prices of crude rallied almost 60 percent from 12-year lows touched in mid-Feb, turnover in the long-dated oil contracts has soared to record highs, as producers started to lock in prices in the $40s, traders have said. Turnover in the U.S. crude contracts for December 2017 surged to record highs of over 30,000 lots this past Friday while volumes in the December 2016 delivery touched an all-time high of nearly 94,000 lots.
Combined, that equates to almost 125 million barrels of oil worth over $5 billion, a small portion of overall daily volume in U.S. crude futures, but enough to catch traders' attention.Now, brokers and traders say that has turned into execution, with some producers willing to hedge in the high $30s or low $40s in 2016 and between $45-50 next year, levels that are just about breakeven for many.
That is also below the $50 psychological threshold that many had thought would be necessary to prompt producers to seek price protection, suggesting drillers have accepted a new reality of lower-for-longer prices as
"The cost of production has declined to the point where at mid-40s they can hedge actively to remain viable." Piling on hedges could prevent prices rallying through $45 a barrel while the extra protection may delay further U.S. production cuts, seen as key to eroding the glut
The impact of the pickup in hedging activity was most conspicuous in longer dated oil contracts.
The 2017 WTI price strip has risen only about 15 percent over the past six weeks, much lower than the prompt contract's gains, while the selling has almost erased the far forward contract's premium over spot.
The contango, as the structure is known, narrowed to $5.82 on Monday, its lowest in almost nine months, and down nearly two thirds from about a month ago.
John Saucer, vice president of research and analysis at Mobius Risk Group in Houston, said he saw a "material" increase in producer hedging, with most action in this and next year's contracts, but extending through the whole of 2018.
Lack of forward buying by major consumers, like the airlines, has also meant prices have not received any boost as producers have been selling, adding to the pressure on prices.
To be sure, many hope for prices to go even higher.
"If prices recovered to that range north of $60, we'll be seriously considering hedging," billionaire wildcatter Harold Hamm said on a conference call.
Eulenspiegel , 03/23/2016 at 12:22 pmDo they really make money on these prices, since most of them where barely profitable at 100$+ oil?AlexS , 03/23/2016 at 12:53 pmOr do they just log in to make profit by pumping from their already drilled holes while ignoring front load costs?
If they would make money after hedging, why isn't there a new boom where everybody drills like mad?"Do they really make money on these prices …?"shallow sand , 03/23/2016 at 4:47 pmSurely they don't. They think that the oil price rally is not sustainable, so they want to lock in prices in low $40s, for 2016 and $45-50 for 2017-18.
AlexS,AlexS , 03/23/2016 at 6:44 pmOne wonders if much of the hedging is being required by banks.
Hedges at these levels likely locks in enough cash flow to pay LOE, taxes, G &A and interest. However, locking in the high side at these levels also locks in a long period of little cash flow for CAPEX and/or retiring debt principal.
An interesting exercise once the hedges are fully disclosed would be to insert the resulting revenue number into cash inflows in the SEC 10K, and then calculating both undiscounted and discounted future net cash flows.
Also, assume we have a Bakken well that produces 120,000 barrels after royalties, that was completed 1/1/15 and has been hedged at an average price of $47 WTI for 2015-17.
A $7 discount puts us at $40. 10% severance puts us at $36.
Our $6-9 million well has only grossed $4.3 million in its first three years. Hedging at these levels locks in many wells to no hope of payout, as we will likely need to subtract another $6-8 per barrel, or more for LOE and $2-3 more for G & A. Oh yes, and another $4-7 more per barrel of interest expense.
Locking in through 2017 scores of wells completed in 2015 that will never payout.
shallow sand ,shallow sand , 03/23/2016 at 8:59 pm"locking in the high side at these levels also locks in a long period of little cash flow " Exactly. That's why I think they will hedge only a small part of their sales at current prices. According to IHS, as of the beginning of 2016, North American E&Ps have hedged just 14% of their total oil production volumes for 2016 and 2% for 2017.
[ http://press.ihs.com/press-release/energy-power-media/north-american-oil-and-gas-companies-face-difficult-year-2016-stron ]In January-February, they were not hedging; and some of distressed companies were even unwinding hedges in order to raise much-needed cash.
[ http://www.reuters.com/article/us-usa-oil-producers-hedge-idUSKCN0VL224 ]
Now hedging activity is increasing, but I think most of the future production will remain unhedged.
AlexS,Sub $50 WTI simply doesn't work for US onshore lower 48 production to any significant scale. There is a big media disconnect between LOE and CAPEX. Although a broad generalization, the lower the current LOE, the newer the well and the higher the decline rate in the next year, etc.
For example, California Resources corporation has LOE around $20 per barrel, yet lower decline rates, while US LTO is around $6-9 per barrel, but has high decline rates. Further, CRC LOE will be more stable over time. Without addition of substantial new wells, US LTO LOE will surpass that of companies like CRC in less than 5 years IMO.
Again, I am speaking in broad terms, each well is different from every other, and each varies over time.
My view is Bakken wells producing under 1000 barrels net of royalties per month have LOE of $15+ generally.
I do apologize for mixing up OPEX and LOE over the last year plus.
I guess OPEX includes royalties, lifting costs and severance taxes?
LOE is lifting and operating expense. Same is calculated on net barrels, after royalties are paid. Expenses such as severance taxes, interest and general and administrative expenses are not included in LOE.
Further, always be aware that LOE is calculated in BOE, so gas and NGLs are included. Gas is on a 6 to 1 ratio with oil.
Many US LTO are touting reduced LOE, when the reality is the company wide gas to oil ratio is increasing. One BOE of gas is selling for $6-10 at the well head right now.
CLR is a good example. Their gas to oil ratio has went from 30:70 to 40:60 in about three years. So, part of the LOE per BOE is directly offset by lower realized per BOE prices. Further, gas is usually cheaper to produce than oil on a BOE basis in the US, so this also must be factored in.
I have been looking at Q1 2016 earnings estimates for US E&P, as well as FY 2016 earnings estimates. Horrible. Two years in a row of record losses are coming, with year 2 worse than year 1.
tally%20wrong%20reporting%20by%20Australian%20public%20broadcaster%20in%20March%20201
Matt Mushalik, 03/24/2016 at 3:37 pm
Totally wrong reporting by Australian public broadcaster in March 201618/3/2016
Oil output rises even as US rig count falls to historic lows http://www.abc.net.au/news/2016-03-18/oil-output-rises-even-as-us-rig-count-falls/7259566?section=business
www.bloomberg.com
A wave of projects approved at the start of the decade, when oil traded near $100 a barrel, has bolstered output for many producers, keeping cash flowing even as prices plummeted. Now, that production boon is fading. In 2016, for the first time in years, drillers will add less oil from new fields than they lose to natural decline in old ones.
About 3 million barrels a day will come from new projects this year, compared with 3.3 million lost from established fields, according to Oslo-based Rystad Energy AS. By 2017, the decline will outstrip new output by 1.2 million barrels as investment cuts made during the oil rout start to take effect. That trend is expected to worsen.
"There will be some effect in 2018 and a very strong effect in 2020," said Per Magnus Nysveen, Rystad's head of analysis, adding that the market will re-balance this year. "Global demand and supply will balance very quickly because we're seeing extended decline from producing fields."
A lot of the new production is from deepwater fields that oil majors chose not to abandon after making initial investments, Nysveen said in a phone interview.
... ... ...
Companies cut capital expenditure on oil and gas fields by 24 percent last year and will reduce that by another 17 percent in 2016, according to the International Energy Agency. That's the first time since 1986 that spending will fall in two consecutive years, the agency said Feb. 22.
peakoilbarrel.com
R DesRoches , 03/20/2016 at 11:23 am
The question that needs answering is what was the effect of cheap funding?likbez , 03/20/2016 at 2:50 pmThe LTO oil boom was the result of companies making a nice return at $100+ oil. At that price range production increased at a rate of one million barrels a day for three years.
If the cost of funding was say 3 to 5% higher what would have been the results?
Companies would still be making money, and they would also be borrowing, but the amount borrowed would have been lower.
At a lower amount of borrowing, production growth would not have been one million per year. One estimate that growth would have been around 750 kbd.
So after three years, U.S. Production would have been 750 kbd lower than it was.
At that growth rate world production would have stayed in balance, prices would have stayed in the $100 range, and the Saudis would not have ramped up production by 1 to 1.5 million a day.
So IMO the net effect of cheap money was to grow production more than the market could use and then crash prices.
In either case, with or without cheap money, the LTO boom would still have happened.
I believe that $100 plus oil prices was the real fuel that fed the growth in LTO production. At that price a very good ROR was made and fund were provided.R DesRoches , 03/21/2016 at 9:39 amIt was simply the situation in which Wall Street needed a place to dump money provided by Fed and shale came quite handy.
According to Art Berman, during the 5 year period (2008-2012), Chesapeake, Southwestern, EOG, and Devon spent over 50 billion dollars more than they took in. Such a great profitability.
Most of the companies you talked about are Nat gas production companies. We are talking about LTO.AlexS , 03/21/2016 at 12:20 pmBut Art only talked about what was spent. If you look at LTO what was gotten was in increase in production of about 4 million barrels a day of production. That is a rate of 1,460, 000,000 barrels a year.
That generates sales at $100 oil of $146,000,000,000 per year.
Art Berman talked about what these companies have spent (capex) and what they got (operating cashflow). During the whole period of the shale boom, shale companies' capex significantly exceeded their operating cashflows.That doesn't mean that all that cash was "burned". Operating cashflow is what they get from today's sales. Capex is what is spent on tomorrow's production. Given that until recently production volumes were rapidly increasing, that partly justified cash overspending.
peakoilbarrel.com
Ves , 03/21/2016 at 12:04 pmDaniel,
Don't waste your time calculating something that is so fuzzy as breakeven price. Price of oil went up 55% in month and half? So demand went up that much? In middle of winter? :-) In the middle of "glut" and oil storages bursting from that overflow of oil? :-) Just like that with a snap of finger.likbez , 03/21/2016 at 10:35 pm
Ves,Your critique is of course valid. But…
There is a huge difference between daily price curve and average quarterly price curve. Using average price for a longer period instead of daily price helps to smooth abrupt price movements and allow models like presented above to look more reasonable. Think about price curve as the result of juxtaposing of several sinusoid waves with different periods like in Fourier transform. Using average for a longer period essentially filters waves with a short period.
There was pretty long exchange between me and Alex on this subject some time ago that covered those issues.
peakoilbarrel.com
Verwimp , 03/21/2016 at 6:48 pm
@ Dennis,
I was out in the woods last weekend, so I didn't have the opportunity to respond to your questions in last Ronpost.Dennis: "if you think that LTO output of 4.5 Mb/d can go to zero and OPEC, Canada, and Russia can make up that difference, I believe you are incorrect."
I believe LTO output of 4.5 Mb/d will go to (nearly) zero rather soon (5 or 6 years, so 2021 or 2022), but I do not believe OPEC, Canada and Russia can make up that difference."Is that your assumption? Do you believe OPEC will fill that 4.5 Mb/d gap"
No. My assumption is that gap will not be filled. My assumption is the world will encounter Peak Oil very soon (if not yet)."What are your assumptions about the future price of oil?"
That's a tough one. Despite the model provided above by Ian Schindler. Let me take a wild guess: WTI in the $70-$80 range by december 2016. $110 by mid 2017 followed by another collapse of the price, due to real problems in China or India."Do you think the Brent oil price will be $35/b in Dec 2016 (STEO forecast)?"
See above: Brent versus WTI will vary within a 15% margin from eachother – mayby Brent being the cheaper one during 2016. (If you ask why?: This is just gut feeling.)likbez , 03/21/2016 at 10:12 pm
Verwimp,Thank you for your input. Very interesting considerations, that actually correlate with my own thoughts on the subject. Especially possible return to recession in the second half of 2017 . I also feel that Brent might be very close to WTI from now on. Lifting export ban eliminated premium. Unless "artificial WTI" shipments spoil the broth.
One question. If we assume the return to recession in the second half 2017, will it necessary cause another collapse in oil prices; or may be downturn in oil prices will be more muted ?One feature of the return to recession is the collapse of junk bond market, which makes financing of both shale and oil sands more difficult. And it typically happens before the actual economic downturn. That will make ramping up shale oil production in 2017 extremely challenging. High oil prices will be only of limited help, as there is no return to "good old days" of Ponzi financing of shale.
Even speculative financing (revolving credit, aka evergreen loans) is already under threat and will remain in this condition for the foreseeable future.
So shale players might have no money to re-start "carpet drilling" again.
I think difficult days are coming for US shale/LTO players and even temporary return to above $100 price range might not restore previous financing bonanza for them - with enough financial thrust you can make pigs fly, but you better do not stand in the place where they are going to land.
Of course they may be propped by the next administration for strategic reasons. Who knows…
peakoilbarrel.com
likbez, 03/17/2016 at 7:35 pm
Ves,
All I am sure that none of us know what will happen.
What do you mean? Here most posters are adherents of the peak oil hypothesis. If so, this is a nonsense statement.
Bets when oil will , say, above $80 belong to the casino, but if trend is predicted right then it is clear that the prices should rise at least to the max level they reached before (above $100) within some reasonable period (say before magic 2020). And to above $70 within much shorter time period. Probably with some crazy spikes in both directions in between. When Wall Street speculators see profits around 25% a quarter they are ready to kill own mother.
The key factor here is that the amount of oil to replace natural depletion of existing wells that can be extracted at prices below $70 is low to compensate natural depletion. For example, despite all this buzz about rising efficiency of shale production, the US shale does not belong to this category.
It will be more difficult to induce the second oscillation of oil prices by repeating the same trick again with forcing debt burdened producers to produce at a loss. When oil producers were caught naked in 2014 with a lot debt to service they have no choice but to continue production. That was an interesting neoliberalism induced wealth redistribution play in which oil producing countries started to subsidize oil importing countries (aka G7) to the tune of 0.5 trillion a year. They did it instead of working together on conservation and keeping oil price at reasonable level they destabilized the system using Saudi in a bait and switch fashion. It might be an Obama attempt to bring Russia to knees, attempt to save economy from secular stagnation or sling to new recession, whatever. What is done, is done. But this racket can't run forever. And what can't run forever will eventually stops.
Low oil price regime started to show crack already in early 2016, when agreement to freeze production was first discussed. Essentially in plain English that is a message to oil importing countries "f*ck yourself".
The next step will be agreement to limit production based on natural decline rates and low capex environment. The huge, paranoid level of fear of such an agreement is clearly visible now in MSM. And of course the US state department along with EU will do the best to crash such a possibility.
But if such an agreement materialize despite all efforts to block it, it will have effect of the A-bomb on Wall street speculators and the second nail into "oil price forever" myth coffin. The same speculators who drove the oil price down from this point will drive it up like there is tomorrow. And as GS trading desk change their bets, those despicable presstitutes from Bloomberg instantly will change tone and start crying loud about coming oil crisis. Financial oligarchy has no allegiance to any country, only to their own bank accounts.
In other words this shale/Saudi induced price crash just speeded up the day of reckoning by several years and will make the next spike of oil prices much closer and much higher.
How long the oil prices can be suppressed by the threat of resumption of shale production remain to be seen, but if there will be a bounce in shale production at below $80 prices it will be a "dead cat bounce" and will not last long as if prices drop again all those guys who tried to anticipate higher price environment and started "carpet bombing", sorry, drilling, again will be swimming naked again. Shale is a Red Queen race in any case. That means that shale will add to amplitude of the oscillations of the oil prices and might somewhat prolong the agony, but can't prevent oil price rise to above $80 level.
peakoilbarrel.com
Ian,Schinzy , 03/20/2016 at 6:41 amThanks for the post.
There has been a long history of oil price model failures. I was wondering whether you could comment on how your model has overcome the weaknesses of earlier models. I have the impression that the oil price in the short, medium but also long term depends on many highly non-linear factors. That just makes it difficult for me to see how any model, even just theoretical, could make reasonable predictions.
Suppose there was such a model, that had a little better predictive power than the market. Wouldn't market participants then not rush in to make money using the model, which would again destroy its predictive power?
Hi Enno,The idea to use autocorrelation came from just eyeballing Figure 1. Low prices seemed to be associated with constant rates of growth. If the rate of growth decreases or stops, the price pops. I gave a bunch of variables to Aude (who is a statistician) and asked her to look for correlations. She fiddled around with the data for some time trying different transformations. When she came back with what worked I slapped myself and wondered why I hadn't told her to try that first.
As I said in the introduction, this work is preliminary and there is a lot we don't know. What I believe is going on is that many variables normally associated with demand are hidden in past extraction data. Exactly which variables are included and which excluded is to be determined.
I think that if traders started using this model to estimate prices the model would work better. It would be a self fulfilling prophecy. The reason for this is that I think price speculation is not included in the variables used, so if the speculators were closer to the "right" price, there would be less variation.
If data were available it would be interesting to split the model by API density using the average price for each tranche of density. The model explained past data much better with EIA C & C data than it did with the BP data that included NGL (as Dennis thought it would).
If you have references to other price models, I am interested as well.
peakoilbarrel.com
R DesRoches , 03/19/2016 at 10:09 am
One of the problems with using historical models to make predictions is that when disruptive technology comes along this type of model may have errors that are hard to adjust for.Schinzy , 03/19/2016 at 10:31 amMany believe that Light Tight Oil (LTO, also known incorrectly as shale oil), is only a high priced flash in the pan, that will quickly die. Over the past few years both of these assumptions are proven to be quite wrong.
The EIA on Sept 24, 2015 came out with an updated report under "Analyisis & Projections" called "World Shale Oil Assessments"
This analysis places the U.S. LTO resource potential at 78.2 billion barrels. A detailed breakdown can be seen by clicking on "US" in the
table.The U.S. analysis is a bottoms up analysis taking (1) the area of potential, (2) well spacing, (3) EUR per well to determine what they call the "Technically Recoverable Resource " (TRR). When doing a Peak Oil Analysis, these is what the ultimate recoverable is.
It should be noted that EURs can change quite a bit so for example for the Bakken they sub divided it into 41 subregions.
The other piece of the disruptive technology is the cost of production. Over the last few years this has come down much more than many believe. The lower costs can be seen in two ways.
The first place is in the EIAs monthly "Productivity Report" which shows that rig production in barrels per day per month, for the last five years, in the Bakken has gone from 100 to 230, and in the Eagle Ford it has gone from 100 to 300. This equates to a major reduction in costs.
The second way lower costs can be seen is what ROR the oil and gas companies are expecting. For example EOG is estimating that their ATROR for five different plays is 30% at a WTI price of $40. Just a few years ago the threshold price of LTO was throught to be $80 to $100.
Since the EIA analysis is based on current production, changes in EURs and future areas of derisked production are not included. For example the Permian, and Three Forks have zones that have little production history and are not included. Also plays that are just opening up, like the Unita, which has 1.2 trillion barrels of OOIP, is just now seeing horizontal wells with good results being drilled in zones that has never see this type of drilling.
The beautiful part of this model is that it does not take extraction cost into account. Whatever the cost of extraction, based on what is extracted, this model gives you the price.R DesRoches , 03/19/2016 at 12:14 pmWith respect to LTO extraction, in my opinion the big revolution is that because of high initial flow rates and short investment cycles, LTO extraction has introduced boom bust economics to oil extraction. In terms of the price model LTO extraction could bring on a faster decline in oil extraction by scaring investors away from longer cycle extraction projects such as deep water. Can LTO extraction replace all other types of extraction? If extraction levels decrease, the model says the base price will decrease as well. This will accelerate the contraction phase.
I believe that what has happened in this cycle in the oil market is that an increase in U.S. production from LTO of one million barrels a day for four years caused the S/D balance to shift to over supply.John Keller , 03/19/2016 at 3:54 pmThe difference in this cycle, making it longer and deeper than expected is the Saudi change in response.
From 1999 to 2013, each time there was a dip in price the Saudis cut their production by an average of 1.5 million barrels a day. This happened five times.
In 2013 as prices started down they started to cut production, but then something changed. As prices went lower instead of cutting production they increased it by over one million a day.
Was it to punish Iran or Russia. I don't think so. I believe it was to slow down the runaway freight train of US LTO production. I believe that they understand the potential of this new resource to change the oil market.
The Saudis recognized that LTO production growth was a product of cheap and plentiful financing. They set out to pop the bubble and they have. The bankruptcies are piling up. LTO economics are overstated. The wells will not produce anything close to what the companies claim. LTO could come back if the banks and debt investors are dumb enough to lend to the companies. My guess is that any debt financing will have much higher costs and tighter covenants. Borrowing for 10 years unsecured at 4-5% probably won't be coming back.
uk.reuters.com
(John Kemp is a Reuters market analyst. The views expressed are his own)
* Chart 1: tmsnrt.rs/22p4vn8
* Chart 2: tmsnrt.rs/22p42kQ
* Chart 3: tmsnrt.rs/22p6Fmy
* Chart 4: tmsnrt.rs/22p49wG
By John Kemp
LONDON, March 17 The oil futures curve is flattening as a wave of bullishness washing across the market raises the price of near-dated contracts faster than that of contracts for deferred delivery.
Brent for delivery in May 2016 has risen more than $10 per barrel since early February, while prices for delivery in 2017 are up less than $7 over the same period.
The discount for Brent crude delivered in May 2016 compared with the average of 2017, a price structure known as contango, has narrowed from $9 to well under $6 per barrel since Feb. 11 ( tmsnrt.rs/22p4vn8 ).
The shape of the futures curve is intimately connected with expectations about supply, demand, stocks and the availability of storage ("Brent contango is hard to square with missing barrels", Reuters, March 10). So the narrowing contango implies the market now expects less oversupply and a smaller build-up in stocks in the months ahead. But market bullishness is at odds with warnings from influential analysts forecasting supply will continue to outstrip demand and stocks rise ("Oil shrugs off Goldman warning about premature rally", Reuters, March 14).
MAYBE WRONG, BUT RATIONAL
It is sometimes said the futures curve is not "forward-looking". If that means the curve is not a simple forecast and is not good at predicting what will happen to spot prices in future, the statement is correct.
But the futures market is actually very forward-looking and focused on how the balance between supply, demand, stocks and prices will evolve in the coming months and years. Via the futures curve and the mechanism of financing and storage, those expectations about medium-term supply, demand, stocks and prices are ruthlessly discounted back to the present.
Given many market participants believe oil supplies will fall sharply, demand will increase, and stocks will peak and begin to fall later this year, the recent rise in prices and narrowing of the contango are entirely rational. Any other price response would be irrational because it would violate the requirement for inter-temporal consistency. The market could be wrong in its expectations for supply, demand, stocks and prices later in the year and in 2017, but it is being absolutely rational.
SPOT PRICES AND SPREADS
The price of oil for delivery on a future date (e.g. calendar average 2017) can be thought of as the sum of a spot price (May 2016) and a spread (the price difference between May 2016 and the calendar average of 2017).
As a matter of convention, the spread is normally expressed as the spot price minus the futures price (it can just as easily be expressed the other way round).
If futures prices are above the spot price, the spread is negative and the market is said to be in contango. If futures prices are below the spot, the spread is positive and the market is trading in backwardation.
For example, if the future price is $50 and the spot price is $40, the future price can be analyzed as a spot price of $40 plus a spread of $10 contango.
Many real trades are arranged this way, with the customer buying (selling) near-dated futures contracts and then adjusting their position by selling (buying) the spread between the near date and the forward one. The advantage of executing trades as two transactions (spot and spread) rather than just one is that it enables dealers and customers to make best use of the greater liquidity in spot contracts. In principle, spot prices and spreads are determined independently and can move separately. In practice, there is normally a high degree of correlation between them.
In most cases, rising spot prices will be accompanied by a narrowing of the contango (or a move from contango into backwardation). Conversely, falling spot prices will normally be accompanied by a widening of the contango (or a move from backwardation into contango). This is exactly what is happening at the moment: the market's newfound bullishness is resulting both in a rise in the spot price of Brent and a narrowing in the contango.
PRICES MOVE TOGETHER
As the market becomes more bullish, the price of contracts for short-term delivery rises faster than the price of contracts for later delivery. The result seems paradoxical since an improved outlook for supply-demand balance over the next few months and years has its biggest impact on the price of oil delivered now. In fact, this behaviour is typical for oil and other commodity markets.
Over the period from 1992 to 2016, taken as a whole, there is no correlation between the level of oil prices and the degree of contango or backwardation in the futures curve ( tmsnrt.rs/22p42kQ ).
High spot prices have coincided with backwardation (January 2008) and contango (May 2008). Low spot prices have coincided with contango (January 1999) and backwardation (April 1999).
But the large shifts in the absolute level of prices since 1992 obscure the short-term relationship between spot prices and the shape of the futures curve. A more granular analysis reveals there has been a fairly close correspondence between spot prices and the shape of the futures curve for most sub-periods since 1992.
In most cases, higher prices have been associated with a narrower contango, or even backwardation, while lower prices have been associated with a wider contango ( tmsnrt.rs/22p6Fmy ). This relationship has held in almost all sub-periods since 1992 with the exception of 2005/06 and the first half of 2008 ( tmsnrt.rs/22p49wG ).
The relationship grows even stronger if we compare the change in prices with the change in the shape of the curve.
That makes sense since an increase in spot prices is associated with a narrowing of the contango, and a fall in spot prices is associated with a widening of the contango; both respond to the expected supply-demand balance.
LOOKING BEYOND THE GLUT
Since 1992, changes in the outlook for oil production, consumption and stocks have had the biggest impact on futures contracts near to delivery rather than those with longer maturities.
As a result, spot prices have been much more volatile than the price of futures contracts with many months or years to delivery. In the current environment, the oil market is looking past short-term oversupply towards the end of 2016 and 2017 when oversupply is expected to be much less, or there might even be excess demand.
Via the storage and inventory financing relationships embedded in the futures curve, the expectation of a future tightening in the supply-demand balance later in 2016 and 2017 is pulling up the spot price of oil now.
The market might be wrong to expect the supply-demand balance to tighten by the end of 2016 or early 2017. The short-term increase in oil prices could also be self-defeating if it stimulates more production and thereby perpetuates the oversupply ("New oil order: the good, the bad and the ugly", Goldman Sachs, March 11). But if the market is right to expect the supply-demand balance will tighten later in the year or in 2017, then spot prices have to rise now and the contango must narrow. Any other outcome would be time-inconsistent. (Editing by Dale Hudson)
www.usatoday.com
The 21st century version of the American gold rush is coming to a swift end.
A shakeout is sweeping through the U.S. oil and gas business, putting small-time petroleum prospectors who got rich off of shale energy out of business as rock-bottom oil prices reshape the sector despite the commodity's slight uptick in recent weeks.
The pain low oil prices have sparked has spread into other corners of the energy industry. This week, coal miner Peabody Energy warned that it may have to file for bankruptcy protection and SunEdison, a developer, installer and operator of alternative energy plants said it discovered problems in its accounting processes, the latest in a string of troubles for the company.
peakoilbarrel.com
Ves , 03/15/2016 at 1:00 pmAlex,AlexS , 03/15/2016 at 1:44 pmI have read your comment on the last thread and I completely disagree with your point 2 that you make: "shale companies have always been growth-oriented, and the market (investors and lenders) has been rewarding them for growth rather than capital discipline." This a definition of ponzi scheme that you describe and ponzi always end when you run out of greater fools. And shale is at that point. Their relentless drilling of the remaining sweet spots AT ANY price will not change their financials at all.
Oil price will steadily rise as shale start running out of the sweet spots and their production start decreasing so shale will never meet that imaginary price of $80-$100. Shale will run out of sweet spots long before the price is at $80-100 range.
Ves,Ves , 03/15/2016 at 2:16 pmWhat is wrong in my statement?
You asked why companies are still drilling when oil price is $37 and they are making losses? I said that I do not see economic logic, but they were doing that in the past, continue to do so now, and will continue to drill and complete wells at loss in the future.
I do not mind if you call it "ponzi scheme", but this is reality. In the first 2 months of 2016 shale companies sold about $10 in equity, diluting existing shareholders, but they found new buyers. Bondholders are happy that oil companies' bonds are up 20% in the past month and are ready to invest more. Private equity is ready to invest tens of billions in distressed companies. I do not mind if you call all them fools, but this is reality.
Did I say that this is normal? I didn't. Did I say that this will continue forever? I didn't.
Alex,likbez , 03/15/2016 at 10:54 pmIf we both agree that shale is continuously drilling regardless of price and profit how can you claim (on the last thread) that shale will make new peak in production at some imaginary future higher price point? What is the basis of that assumption?
Alex,
You asked why companies are still drilling when oil price is $37 and they are making losses? I said that I do not see economic logicThere was a very simple, albeit pervert, economic logic in 2015 - top brass bonuses (along with several other factors like pipeline contracts, etc). Redistribution of wealth up should never stop :-)
But 2016 is a completely different game. "After me deluge" type of thinking on the top run its course: they run out of money and can't get new loans. For most shale companies it was something like waking up the next morning after several days of binge drinking…
Bondholders are happy that oil companies' bonds are up 20% in the past month and are ready to invest more.
Are you sure? Which of major banks anticipates bright conditions for junk bond market, and especially shale junk bonds, in 2017 ? I think most banks increased their loss provisions from junk for 2016. In view that survival of companies is in question, inquiring minds want to know, who are those happy investors who by trying to earn some extra points (chasing yield) already lost quite a bit of money and want to lose more. Or this is just new fools from never ending global supply. But like with oil there might be that "peak fools" moment is behind us :-) .
http://knowledge.wharton.upenn.edu/article/do-junk-bond-defaults-signal-trouble-for-2016/The iShares iBoxx $ High Yield Corporate Bond ETF, a $14.4-billion exchange traded fund that tracks the performance of the junk-bond market, posted an annual loss of 5.5%, and ended 2015 off a startling 12.4% from its February high. Likewise, the S&P U.S. Issued High Yield Corporate Bond Index lost 3.99% for the year, while BofA Merrill Lynch U.S. High Yield Index fell 5% for the year, its first annual loss since 2008.
BTW Vanguard increased the quality of bonds in their junk bond fund. And that means that they think that the storm is ahead not behind us.
Dennis Coyne , 03/15/2016 at 1:48 pm
Hi Ves,Ves , 03/15/2016 at 2:26 pmWhen do you think oil will reach $90/b, if ever?
In the Bakken, the number of well completions has fallen from 185/month for the 12 months ending in March 2015 to 70 well completions in January.
If US falls by 1 Mb/d, that may be enough to balance the oil market, output in Canada may also fall, the low oil prices will eventually reduce output and oil prices will rise maybe by late 2016, eventually (probably 6 months later) oil output will gradually flatten and then rise, possibly reaching the previous peak, this will depend in part on demand for oil and the price of oil.
Dennis,Dennis Coyne , 03/15/2016 at 6:30 pm" When do you think oil will reach $90/b, if ever?" No idea.
If WTI is on average $40-45 by the end of the 2016 how much US shale and US total production will be on December 2017?
Hi Ves,Ves , 03/15/2016 at 8:05 pmThe decline might be as high as 1.5 Mb/d for total US output if oil prices remain under $43/b, with shale maybe about half of this (800 kb/d), the EIA is predicting WTI at $35/b in Dec 2016 and $45/b in Dec 2017 (the EIA's oil price forecast is too low in my view).
Very difficult to predict, it may be that capitulation in the US oil sector is close at hand. In that case output falls by more than I have guessed, but there is no way the EIA price forecast turns out to be correct in that case.
Hi Dennis,Ron Patterson , 03/15/2016 at 2:30 pm
I agree on EIA price prediction in sense that I always stay away from predicting price for anything. Even for my weekly grocery shopping bag. :-)Dennis Coyne , 03/15/2016 at 5:44 pmIf US falls by 1 Mb/d, that may be enough to balance the oil market,…And what do you think might happen in the rest of the world? In 2016 oil production will fall in most oil producing countries. Oil production will rise in a very few countries. The oil market may balance a lot sooner than a lot of people realize.
Hi Ron,Ron Patterson , 03/15/2016 at 6:48 pmYou may be correct on that point. If we take the US and Canada out of the equation I think increases in Iran's output might balance the declines in World minus US+Canada+Iran. The question then becomes (if my previous assumption is roughly correct), how much does US+ Canada decline in 2016? My guess is 1.25 Mb/d. I would be interested in your estimate, because you track the numbers more closely than me. Or just your estimate for World C+C decline in 2016 would be fine.
Thanks Dennis. I don't think the increase in Iranian production will come close to offsetting the decline in the rest of the world minus the US and Canada. I believe the decline in ROW less US and Canada will be about twice the increase expected from Iran.Dennis Coyne , 03/15/2016 at 7:10 pmBreaking it down, Iran may increase production, from February, another half a million barrels per day. That would be almost 700,000 bpd from their January production. The rest of OPEC will be flat to down, most likely down slightly. Non-OPEC, less US and Canada will be down from one million to 1.2 million bpd from their December production numbers.
That is my estimate, for what it's worth.
Hi Ron,Ron Patterson , 03/15/2016 at 7:32 pmThanks. I was under the impression that there were projects coming on line in that would offset some of the 1.2 Mb/d decline in non-OPEC less US and Canada. I may be wrong of course (happens all the time). :-)
Dennis, you just have not been following the news. Yes there were projects coming on line. But those projects were cancelled.Ves , 03/15/2016 at 8:11 pmHey, start paying attention.
Hi Dennis,Did you mean 1-2 oil sands project that are very close to completion in 2018? I think there is very minor one. But here is some hush – hush info from oil sands patch that there will not be any new oil sands project even if the price goes much higher in the near future without export pipeline in place. But who knows.
peakoilbarrel.com
Heinrich Leopold, 03/12/2016 at 7:38 amALexS, shallow sand, DennisIn my view actual spuds are very important for production numbers (see below chart).
Hovering around 100 per month during 2015, spuds plunged in February 2016 to a multi year low of 29. https://www.dmr.nd.gov/oilgas/stats/2016monthlystats.pdf.
In my opinion, the industry has finally cut production in earnest. This is very likely the main reason for the recent price recovery. The latest action provides a good basis for a significant price rise in the fall of 2016.
peakoilbarrel.com
AlexS, 03/11/2016 at 1:33 pmOil rigs 386 -6Amatoori, 03/11/2016 at 2:44 pm
Gas rigs 94 -3Horizontal 375 -14
Vertical 55 -3
Directional 50 +8Oil rigs in key LTO basins:
Permian: 150 -6
Bakken 32 -1
Eagle Ford 37 -3
Niobrara 15 unchangedAlthough the overall decline in oil rigs is slowing, key tight oil basins have lost 10 oil rigs.
Also note a significant decline in horizontal rigs.
Horizontal rigs drilling for oil:
– down from 311 to 301 for the week.
– down 120 units (-28.5%) from the end of 2015
– down 814 units (-73%) from the peak on November 26, 2014Oh CanadaCanadian Rig Count is down 31 rigs from last week to 98, with oil rigs down 22 to 28, and gas rigs down 9 to 70.
Canadian Rig Count is down 122 rigs from last year at 220, with oil rigs down 57, and gas rigs down 65.
Not an expert on Canada drilling but the production numbers won't be that impressive in 6 months as I understand this is the time they suppose to be drilling.
AND since US + Canada are the ones that been keeping world production up we all need to hope for some serious Iran drilling in the coming months (won't happen though). Price spike here we come my and my guess this is in August/September.
Everyone will be like: I thought we had a surplus? WTF happened?
finance.yahoo.com
While some investors are predicting that market expectations for oil at $50 a barrel might be too fast, and too soon , Bill Smith, chief investment officer and senior portfolio manager at Battery Park Capital, told CNBC the energy sector will find equilibrium by the second quarter of 2016. And it will not be pretty for those holding bearish trades.
Speaking to CNBC's " Squawk Box ", Smith said if indeed oil prices stabilize, much-battered energy stocks will follow crude prices higher.
"It's going to be a short covering rally that rips people's faces off," said Smith. "It's going to be ugly."
Battery Park Capital has assets under management worth $340 million. Short-selling refers to selling an asset in the hope of buying it back at a lower price later. The recovery in oil prices has been supported by reports suggesting that oil producers are planning to work together to reduce excess supply in the market.
Earlier this week Reuters, citing New York-based oil industry consultancy PIRA , reported major OPEC producers were discussing a new price equilibrium of around $50 a barrel.
Broadly, Smith was less upbeat about the U.S. economy. He said while the economy wasn't heading into recession, it wasn't growing either.
.. View gallery
Oil market rally could 'rip people's faces …
Nick Oxford | Reuters. Investors betting on falling shares of energy companies could have their &quo …"We don't have the building blocks to bust out and go on a growth trajectory," he said, adding there's no reason for runaway inflation at this point in time.
Government data showed core inflation rose 1.7 percent in the 12 months ended in January. The U.S. Federal Reserve 's inflation target is at 2 percent.
But Smith said he doesn't see any reason why the Fed would raise interest rates just yet, even due to currency risks.Last December, the Fed raised interest rates from near zero percent for the first time since 2006. Following the rate hike, the dollar initially found strength against major currencies around the world before losing some momentum earlier this year. But the move also created a major sell-off in global stock markets in January.
The Federal Open Market Committee is due to meet next on Mar. 15 - 16.
Smith said, "Every time they even talk about raising rates, the dollar rips higher and it's just creating chaos globally. So, I would much rather see them sit on the sidelines now."
peakoilbarrel.com
shallow sand, 03/09/2016 at 10:02 amND rigs at 33. Burlington has one to stack. My estimate is rigs will bottom at 26-27.Ves, 03/09/2016 at 1:03 pmEIA oil price projections are unrealisticly low IMO. Removing 1.5 million bopd from USA, plus world wide demand growth of 1-1.2 in 2016, plus other worldwide declines that Ron has illustrated, add up to more than Iraq and Iran can boost production. KSA appears to be incapable of going past 10.5 million. Russia cannot quickly increase production.
Things can change fast regarding oil prices, witness the volatility since 1/1/16. We are hearing there could be a real supply squeeze coming and are seeing real evidence of that anticipation based upon some long term offers to hedge well above the current strip, sharply increased local basis and refinery planning chatter. All are anecdotal, but are not signifying worries of tanks topping.
re Iraq and Iran,likbez, 03/09/2016 at 3:31 pmAlso add 600k disruption from Iraq Kurdish area due to complete change in geopolitics in that area, that 600k is NOT coming back to the market until there is deal and safe infrastructure on moving that oil towards the south terminals through areas controlled by Iraq government. And that talk of 500k from Iran waiting to flood the market is bogus story from the beginning and it was just used to perpetuate "glut" narrative.
Iran will not piss 500k at these prices unless there is a deal between Russians and Saudis regarding the quotas.
I would just watch March 20th meeting and try to decode the statements from the meeting.
ShallowS,EIA oil price projections are unrealistically low IMO
As for prices, Alex should always superimpose EIA STEO prediction from a year ago on the current. Otherwise posting such a graph does not make much sense and looks like a free promotion for crappy job that EIA performs with this metric :-)
BTW they are unrealistic by design as they are based on futures. Futures are a bad predictor of oil prices dynamics as they are often used by producers and by hedge funds for hedging and offsetting other bets. Probably worse then a typical "oil expert" predictions :-)
peakoilbarrel.com
R Walter, 03/07/2016 at 7:03 amI suspect farmers were buying diesel fuel in the past several weeks for field work coming up in the next two months.Two million farmers buying 2100 gallons of diesel fuel is 42,000,000,000 gallons, 1,000,000,000 barrels of diesel fuel; there it was, gone.
A thousand gallon on farm diesel tank, pour some into the tractors, trucks, all which will hold another thousand gallons easy, you have your demand in storage waiting to be burned doing field work. The pickups have a one hundred gallon tank in the pickup bed for some more fuel, fill those too. Fill the combine too, add some stabilizer, you're ready to go.
Plus a can of starting fluid for cold starts, just what you need to start a cold diesel engine.
Might as well order it before the price starts to rise in April. No sense in spending another fifty cents per gallon, that is another 21 billion dollars and might as well have it in the bank account for some fertilizer and soybean seed.
Just a hunch.
realmoney.thestreet.com
... ... ...
My point is that in the energy space, shockingly, money continues to pour in whenever it's being requested.
The facility of even the most distressed oil company to raise capital, and the least distressed feeling the need to do so, combined with the short covering move in oil futures, rightly spooked the equity shorts everywhere in the oil sector. You might be waiting to see a stock go, rightly, to zero, but if companies are continually able to extend their timelines on that at will, the possibility that oil will recover in time to save them obviously increases the risk in the short position.
The short-covering panic affected the sector stocks differently, of course -- those with the strongest balance sheets and lowest short commitment rallied the least; those on the other side of the spectrum -- the ones most likely (still) to face Chapter 11 (like SeaDrill) rallied spectacularly.
But now where are we? There's been a long-overdue, short-covering rally that I've been expecting. So what? And now what?
Here are some things I can say:
Oil has bottomed. We won't see any of the $10 or $20 targets that some have picked. Unless the momentum algorithms regroup and again begin to accumulate (which is easily trackable), we won't even see another $26 retest again, in my view. The contango (again trackable) would have to begin to spike outwards as well.
Oil still isn't ready to get long-term bullish, yet, either. While this short covering could easily take prices back to $40, that still only gets oil from a ridiculously, unsustainably low price to merely an unsustainably low price. We still need to see a whittling away of producers and drillers before any rally can be sustained. Drillers like SeaDrill have managed to "add wick to their time bomb fuses" but we still await a few of those bombs to explode before we'll be convinced the bear market is turning for good.
peakoilbarrel.com
Interesting we are seeing a crude oil rally in March, as in 2009 and 1999. Of course, we also had a rally in April in 2015 that didn't hold.Marcus , 03/07/2016 at 5:27 pmtwocats , 03/07/2016 at 5:46 pmThere are some that are saying this is due to a massive short squeeze as happened recently with iron ore, but I had not thought about the March correlation.
Last April didn't include the most important presidential election this country has seen in decades. If either of the two insurgent candidates wins it could deliver a mortal blow to the empire. Anyone who thinks they know why the price of oil is rallying is living in crazy-town.Could be anything. Could be short squeeze, could be Chinese, could be Japan (based on a secret G-20) agreement. Who is the biggest beneficiary of an oil price "stabilizing" around $35 – 45? Besides the containment of contagion from energy to banking sector – Obama to Hillary baton hand-off.
OilPrice.com
The more recent descent of oil prices below $30 per barrel is inducing another period of contraction in drilling activity, which is clearly visible with the rig count in free fall.
Individual shale basins are feeling the pinch to various degrees. The Eagle Ford shale in South Texas, for example, had over 200 rig counts as of late 2014. That figure has fallen to just 46 as of early March. Oil production from the Eagle Ford has declined by 0.5 million barrels per day since the middle of last year. The Permian Basin in West Texas had over 500 oil and gas rigs at the end of 2014, a level that has plunged to just 158. Oil production from the Permian has finally come to a halt, and could begin to decline through this year.
There tends to be a lag between movements in the oil price and the resulting effects on the rig count. As a result, the rig count may not rebound immediately even if oil prices rise. That means that with production in the U.S. now declining, the declines should continue at a steady pace until oil prices post a sustained rally.
OilPrice.com
Oil speculators are becoming more bullish on oil prices. Hedge funds are rapidly liquidating their short bets, as fears of sub-$20 oil have all but vanished for now. According to data from the CFTC, net-short positions fell by 15 percent for the week ending on March 1. "We might see the real bottom being behind us," Ed Morse, head of global commodity research at Citigroup Inc., said on Bloomberg TV on March 4.
In addition, although a lot of questions remain, OPEC representatives are planning on meeting with Russia's energy minister between March 20 and April 1 to follow up on their production "freeze" agreement. An outright cut to production remains a long-shot, especially since Saudi Arabia's oil minister Ali al-Naimi all but ruled it out at the IHS CERAWeek conference in Houston in late February. It is hard to imagine OPEC and Russia shifting course from the production freeze, but any agreement to take additional action represents an upside risk to oil prices.
Given the mounting evidence, it seems that the oil price rally is finally here, then? Maybe. But it is also possible that bullish sentiment is starting to outstrip the fundamentals, even if the fundamentals are trending in the right direction.
peakoilbarrel.com
shallow sand, 03/07/2016 at 5:19 pmInteresting we are seeing a crude oil rally in March, as in 2009 and 1999. Of course, we also had a rally in April in 2015 that didn't hold.Marcus, 03/07/2016 at 5:27 pmThere are some that are saying this is due to a massive short squeeze as happened recently with iron ore, but I had not thought about the March correlation.twocats, 03/07/2016 at 5:46 pmLast April didn't include the most important presidential election this country has seen in decades. If either of the two insurgent candidates wins it could deliver a mortal blow to the empire. Anyone who thinks they know why the price of oil is rallying is living in crazy-town. Could be anything. Could be short squeeze, could be Chinese, could be Japan (based on a secret G-20 agreement). Who is the biggest beneficiary of an oil price "stabilizing" around $35 – 45? Besides the containment of contagion from energy to banking sector – Obama to Hillary baton hand-off.
peakoilbarrel.com
shallow sand, 03/04/2016 at 11:43 pmLooking at the primarily conventional states again.likbez, 03/05/2016 at 1:51 amPer Kansas Geological Survey
- 1/15 daily oil production: 134,471
- 11/15 (most recent month reported) daily production: 106,318
These figures are backed up by EIA. There is some horizontal Mississippian production in KS, and it is down significantly, but so are all the larger production conventional counties. This is a 21% decline in under one year.
Per the Utah Department of Natural Resources, Division of Oil, Gas and Mining:
- 1/15. 110,594 barrels of oil per day, 5,127 producing wells, 772 shut in, 169 T'A.
- 12/15. 88,469 barrels of oil per day, 4,796 producing wells, 1,157 shut in, 149 T'A.
Again, these numbers fairly correspond to EIA. This is decline of 20%. Anecdotal, I agree. Have to wonder if declines this steep have occurred in other parts of the world? I am an American through and through. But, I will admit that, not only do we have very short attention spans, but we tend to hyper focus on things. I have hyper focused on shale like the rest, but I at least realize there are many places where production has absolutely tanked.
Many think lower for much longer. It could very well be that once the hype in the US turns, things could go quickly.
WTI is up almost 40% since 2/11/15, 15 trading days.
As AlexS pointed out, there will likely be at least a 6 month lag until US activity pick up. He thinks longer, and it makes sense. Balance sheets need major repair. Believe me, speaking from personal experience here.
I do not foresee a straight shot up, but the world has lost a lot of oil due to this crash IMO.
ShallowS,Heinrich Leopold, 03/05/2016 at 6:49 amMany think lower for much longer. It could very well be that once the hype in the US turns, things could go quickly.
I think Obama administration might object, as they need another 10 months to drive into the sunset :-)
Dominant (sustained by propaganda machine) myths like "oil glut", "storage overflow", fight for market share and mass overproduction by oil producing countries (except, of course, the USA, where shale producers suffer under brutal attack from Saudi Arabia :-) have now a life of their own and are difficult to change even when completely detached from reality.
IMHO for "things go quickly" we need a trigger event that suddenly becomes a focus of news coverage. Some large bankruptcy. Whatever. May be March 20 meeting in Moscow can serve as a trigger for some short squeeze, despite the measure to be taken is an old news. But just the level of determination of oil producing countries on this meeting might be interpreted as an important market signal.
shallow sand,The time lag between rig counts and actual production stands around 2 to 4 years for the general oil production index, which includes conventional and unconventional off- and onshore production (see below chart). In my view the time lag for shale is just six months and for conventional production it is at least 18 months. As an example in 2005 a doubling of the rig count did not raise oil production until 2009.
If rig counts stay low until the end of this year, production is set for a huge decline over the next year. Some interpret the still high production at low rig counts as a miracle improvement in rig productivity. If this is the case, the rig productivity must have been extremely low about four years ago when a high rig count gave a then still low production. So where does the huge turnaround come from?
peakoilbarrel.com
AlexS, 03/04/2016 at 1:26 pmDespite strengthening oil prices, U.S. oil and gas rig count is down 13 units.Ves, 03/04/2016 at 1:40 pm
Oil rigs: -8
Gas rigs: -5Horizontal rigs: -8
Directional: -5
Vertical: unchangedAll key LTO basins have lost oil rigs:
Permian: – 6 (to 156)
Bakken: -3 (33)
Eagle Ford: -1 (40)
Niobrara: -1 (15)Cana Woodford: +5 oil rigs ; -4 gas rigs (apparently same rigs were re-classified)
Thanks for the oil post :-)likbez , 03/04/2016 at 1:50 pmI think everything is clear. Rigs are going down regardless of this uptick in the price since bottom of $26 because it is clear that if there is sustainable price for the majority of world production, contribution has to come from Opec and non-Opec. There will be no more waving of hands and their always new breakeven price OCD type of messages from shale crowd but very quiet departure in the sunset.
Alex,George Kaplan, 03/04/2016 at 2:02 pmDespite strengthening oil prices, U.S. oil and gas rig count is down 13 units.
Quantity at some point turns into quality. Now there two ranges of oil prices that matter for shale: 0-70 and 80-infinity. With "hope" range 70-80 in between.
Strengthening of oil prices within the range 0-70 probably no longer matter much for indebted shale companies and their production and by extension rig count. Investment climate changed and will remain generally very cautious in this range, taking into account the possibility of yet another price slump (for example, if the price recovery overshoot; or Libya civil war ends). Mad drilling with negative cash flow is probably the thing of the past. Taking over the companies by lenders will be a more common practice than rescuing them.
I think range 0-$70 now represents "death valley" for shale in which only the "dead cat bounce" of production is possible. Investors might not return in-full before the price reach about $80 and stays at this level for a while. Because, those who were burned and balanced on losses around 60% on their loans (40 cents on a dollar) probably understand, that it just does not make any economic sense. Any belief in "shale miracle" if such existed is now busted.
What we have now is as Ves said, "a very quiet departure into the sunset". Of cause, we can play with numeric ranges, but you got the idea.
The E&P companies have set their budgets and placed drilling contracts. What the price of oil does over the next three to six months won't make much difference to the rig count. It may influence completions though as they can be conducted on a faster turn around.likbez , 03/04/2016 at 4:52 pmND has lost three rigs and is likely to lose up to another ten rigs in the coming weeks as Whiting and Continental shut down drilling, QEP and Hess reduce to one or two rigs only, and maybe a couple of the smaller private companies go bust.
George,shallow sand, 03/04/2016 at 2:06 pmThe E&P companies have set their budgets and placed drilling contracts. What the price of oil does over the next three to six months won't make much difference to the rig count.
IMHO it does not matter how shale E&P companies behave. Cards are stack against them and they are in a trap. It's Minsky moment for them, when euphoria is gone and the harsh reality started to assert itself. So the meaning of the number of rigs now is very similar to sweating of the patient in the famous anecdote when a doctor asks the nurse "Did the patient sweat before dying? Oh, yes. Very good, very good".
For conventional oil it is a completely different game and there can be some Renaissance.
My point is that for "below $70 range" ( +-$10) shale companies will remain in a "slow dying" mode. Availability of "sweet spots" does not improve with the age of the field. Loans availability is either gone or severely cut and cash flow is either negative or barely enough for the maintenance and for "evergreen" loans interest payments (speculative mode of production according to Minsky). Most of them suffer from the high level of existing debt.
Also their costs rise with the rise of oil price if only because they consume a lot of diesel fuel (if we assume EROEI 5 you need 8 gallons of diesel per barrel of oil, so effectively your barrel contains only 42-8=34 gallons). Only a fraction of the price rise improves their economic conditions (a large part of the "increased efficiency", lower cost of production blah-blah-blah was based on the same effect but acting in the opposite direction). The problems also might start when investors realize that they have a better chance to recoup their investments by taking a hold of assets in a rising oil price environment…
AlexS, note that in the 1998-99 price crash, oil rigs did not bottom until a few months after the OPEC cut.farmboy, 03/04/2016 at 2:47 pmThis time may be different, remains to be seen.
At $50.28 WTI companies lost record amounts and generally have PV10 all categories equal to long term debt, with radical reductions in future estimated production costs and development costs. But all are eager to show they can operate lower than their peers. Also, the stock market seems to get ahead of itself. Look at today, for example.
Trading $14+ below last year SEC prices, all is not yet well. A DOUBLE in price is needed, but likely will not occur in 2016.
Canada oil rig count is slowing down drastically and ahead of the normal seasonal slowdown if I remember correctly.Oil -33 (50)
Gas –13 (79)
Bloomberg Business
There will be a "dramatic price movement" when the meeting between OPEC members and Russia takes place, Nigerian Petroleum Minister Emmanuel Kachikwu said at a conference in Abuja on Thursday. Saudi Arabia, Russia, Qatar and Venezuela agreed on Feb. 16 in Doha that they would freeze production, if other producers followed suit, in an effort to tackle the global oversupply.
Mar 01, 2016 | OilPrice.com
... ... ...
This article first appeared on Energy Matters.
The following totals compare Jan 2016 with December 2015:
- - World total liquids down 230,000 bpd
- - U.S. down 170,000 bpd
- - North America down 180,000 bpd (includes U.S.)
- - OPEC up 270,000 bpd
- - Saudi Arabia up 70,000 bpd
- - Iran up 80,000 bpd
- - Russia + FSU up 10,000 bpd
- - Europe up 30,000 bpd (YOY)
- - Asia down 30,000 bpd
... ... ...
Still High Noon for the Oil Price
- No one has ever been able to predict the oil price. The current situation is a balance between quite strong bull and bear signals. Last month I said:
- Investors and speculators will expect the $26 lows to be tested. The fundamentals prevailing at that time will be crucial.
- This duly happened and support held, but WTI has yet to break free of resistance at around $33 and direction remains undecided.
On the bear side we know that:
- - The market will likely remain over-supplied throughout 2016.
- - Demand in Q1 and Q2 is cyclically weak.
- - Iran returning to full market will pour gasoline on the bonfire.
- - There are multiple signs of a slowing global economy, despite cheap energy.
- - There's no sign yet (as of January 2016) of production falling significantly.
On the bull side we know that:
- - The oil price will definitely rise from current levels unless the global finance system fails.
- - Low price and low investment now, lays the ground for supply shortage in the years ahead.
- - Zero spare capacity will prime the market for volatility and price spikes to come.
- - The down trend in declining price tops has been broken and there are signs of price support (Figure 1).
- - Shale patch bankruptcies appear to be accelerating as is the down turn in non-OPEC drilling
By Euan Mearns
Fuel Fix
Oil rose to an eight-week high in New York after U.S. production declined and a weaker dollar boosted the attractiveness of commodities.
Futures rose as much as 1.9 percent. Output fell for a sixth week to 9.08 million barrels a day, the lowest level since November 2014, according to the Energy Information Administration. Crude inventories rose, keeping supplies at the highest in more than eight decades. OPEC members will meet with Russia and other producers in Moscow on March 20 to resume talks on an output cap, Nigeria's oil minister said.
"The mood has changed in the market and we are a little bit more optimistic about the future," said Phil Flynn, senior market analyst at the Price Futures Group in Chicago. "The market is shaking off the big inventories builds that we saw in recent weeks."
Oil is still down about 5 percent this year on speculation a global glut will be prolonged amid brimming U.S. stockpiles and the outlook for increased exports from Iran after the removal of sanctions. Exxon Mobil Corp. scaled back production targets and said drilling budgets will continue to drop through the end of next year as the oil market shows no signs of a significant recovery.
West Texas Intermediate for April delivery rose 41 cents to $35.07 a barrel at 11:19 a.m. Eastern time on the New York Mercantile Exchange, after reaching $35.32. The contract rose 26 cents to $34.66 on Wednesday, the highest close since Jan. 5. Total volume traded was about 2 percent above the 100-day average.Brent for May settlement gained 22 cents to $37.15 a barrel on the London-based ICE Futures Europe exchange. The global benchmark crude was at a premium of 46 cents to WTI for May.
The Bloomberg Dollar Spot Index fell 0.5 percent, after earlier gaining 0.1 percent.
U.S. crude stockpiles expanded by 10.4 million barrels to 518 million, according to a report from the EIA Wednesday. Supplies at Cushing, Oklahoma, the delivery point for WTI and the nation's biggest oil-storage hub, rose for a fifth week to a record 66.3 million barrels.
The market's saying "You can't ignore fundamentals," said Tariq Zahir, a New York-based commodity fund manager at Tyche Capital Advisors. "With the massive amount of supplies that we have, the market should go lower. I think prices will go back to below $30 in a few weeks."
Others are more optimistic. There will be a "dramatic price movement" when the meeting between OPEC members and Russia takes place, Nigerian Petroleum Minister Emmanuel Kachikwu said at a conference in Abuja on Thursday. Saudi Arabia, Russia, Qatar and Venezuela agreed on Feb. 16 in Doha that they would freeze production, if other producers followed suit, in an effort to tackle the global oversupply.
Exxon's output will be the equivalent of 4 million to 4.2 million barrels a day through 2020, compared with the previous target of 4.3 million as soon as next year, Chairman and Chief Executive Officer Rex Tillerson said at the company's annual strategy session in New York on Wednesday. Capital spending will fall about 25 percent this year to $23.2 billion and will decline again in 2017.
peakoilbarrel.com
Ves, 03/03/2016 at 8:36 amSS,here is some good news. You have heard it first from me here on POB 2 weeks ago. We are moving in direction of restoring the prices to acceptable level that major producers can live temporarily.
"The meeting of oil-producing countries will be held on March 20th in Russia, the Minister of oil of Nigeria, Emmanuel Kachikwu, announced. According to him, it will be attended by representatives of countries who are OPEC members and countries that are not members in the organization. Mr. Kachikwu noted that producers seek to restore oil prices to $50 per barrel."
Reuters
Hedge funds and other money managers held a combined net long position in the three main crude oil futures and options contracts amounting to 383 million barrels on Feb. 23.The combined net long position has increased in eight of the last 11 weeks from a recent low of 230 million barrels on Dec. 8. (tmsnrt.rs/1XUWJih)
But the increase in hedge fund and other money manager net long positions has been concentrated in Brent rather than WTI. (tmsnrt.rs/1XUWS5i)
The net long position in Brent futures and options traded on ICE Futures has jumped by more than 100 million barrels to 320 million barrels from 183 million barrels.
The net long position in WTI futures and options traded on ICE and the New York Mercantile Exchange has risen less than 20 million barrels to 63 million barrels from 47 million barrels. (tmsnrt.rs/1XUWVy1)
Extreme pessimism about the near-term outlook for prices, which reached its height in December and early January, seems to have dissipated a little.
There is more confidence that the long-awaited rebalancing of supply and demand is now underway in earnest which could help stabilize stockpiles and prices later in 2016.
U.S. shale producers seem to be finally cracking under the strain from low prices, with more than 100 oil drilling rigs idled over the past month, and many producers now openly talking about producing less in 2016.
peakoilbarrel.com
shallow sand , 02/26/2016 at 4:25 pmThere are still a few relevant 10K's to be release by E & P companies for 2015.John S , 02/26/2016 at 7:15 pmHowever, thought I would share some aggregate numbers from some large US E & P's. Keep in mind that these companies mostly have overseas operations, and I am finding that the numbers with regard to PV10 are much better for those assets than for US assets.
Anadarko, ConocoPhillips, Occidental Petroleum, EOG, Marathon Oil and Chesapeake account for over 4 million BOE.
- Ending 12/31/2015, total long term debt for these companies was $70.338 billion dollars.
- Ending 12/31/2015, standard measure PV10 for these companies was $67.205 billion dollars, using WTI of $50.28 and HH of $2.58.
In looking at smaller companies, I am finding that the majority have lower standard measure PV10 than long term debt, and the few that are higher are barely.
Thus, preliminarily, it appears that the present value of future cash flows for US non-integrated public oil and gas companies, discounted to 10% is less, in aggregate, than aggregate long term debt for these companies, at $50.28 WTI and $2.58 HH.
Finally, given we are significantly lower on both WTI, and HH at present, I will note a few companies have disclosed PV10 at lower price points. It appears to me that PV10 drops by about 50% at $30 WTI and $1.75 HH.
One can argue that in this low interest rate environment, PV10 is too high, we should use a lower discount rate, which would push the values higher. I can see merit in that argument. However, given the distress in the debt markets, E & P debt requires a very high premium to US Treasuries in most instances.
In any event. the idea that oil and natural gas will stay below $50 and $2.50 does not appear to be possible in my view. without one of the following: (1) substantially increased worldwide oil production; (2) substantially decreased worldwide oil demand.
I think Ron has shown that 1. will be very difficult, he would say impossible.
So far, since 2005, world oil demand has only fallen one time year over year. That was 2008-2009.
Oil and natural gas prices have overshot, IMO, but the market can stay irrational much longer than most can stay solvent.
Shallow,Perhaps Moody's is reading your posts carefully here at POB. Here is a link to a Bloomberg article that discusses Credit down grades for Exxon, ChevronTexaco,Marathon and ConocoPhillips.
Google matched content |
...
Society
Groupthink : Two Party System as Polyarchy : Corruption of Regulators : Bureaucracies : Understanding Micromanagers and Control Freaks : Toxic Managers : Harvard Mafia : Diplomatic Communication : Surviving a Bad Performance Review : Insufficient Retirement Funds as Immanent Problem of Neoliberal Regime : PseudoScience : Who Rules America : Neoliberalism : The Iron Law of Oligarchy : Libertarian Philosophy
Quotes
War and Peace : Skeptical Finance : John Kenneth Galbraith :Talleyrand : Oscar Wilde : Otto Von Bismarck : Keynes : George Carlin : Skeptics : Propaganda : SE quotes : Language Design and Programming Quotes : Random IT-related quotes : Somerset Maugham : Marcus Aurelius : Kurt Vonnegut : Eric Hoffer : Winston Churchill : Napoleon Bonaparte : Ambrose Bierce : Bernard Shaw : Mark Twain Quotes
Bulletin:
Vol 25, No.12 (December, 2013) Rational Fools vs. Efficient Crooks The efficient markets hypothesis : Political Skeptic Bulletin, 2013 : Unemployment Bulletin, 2010 : Vol 23, No.10 (October, 2011) An observation about corporate security departments : Slightly Skeptical Euromaydan Chronicles, June 2014 : Greenspan legacy bulletin, 2008 : Vol 25, No.10 (October, 2013) Cryptolocker Trojan (Win32/Crilock.A) : Vol 25, No.08 (August, 2013) Cloud providers as intelligence collection hubs : Financial Humor Bulletin, 2010 : Inequality Bulletin, 2009 : Financial Humor Bulletin, 2008 : Copyleft Problems Bulletin, 2004 : Financial Humor Bulletin, 2011 : Energy Bulletin, 2010 : Malware Protection Bulletin, 2010 : Vol 26, No.1 (January, 2013) Object-Oriented Cult : Political Skeptic Bulletin, 2011 : Vol 23, No.11 (November, 2011) Softpanorama classification of sysadmin horror stories : Vol 25, No.05 (May, 2013) Corporate bullshit as a communication method : Vol 25, No.06 (June, 2013) A Note on the Relationship of Brooks Law and Conway Law
History:
Fifty glorious years (1950-2000): the triumph of the US computer engineering : Donald Knuth : TAoCP and its Influence of Computer Science : Richard Stallman : Linus Torvalds : Larry Wall : John K. Ousterhout : CTSS : Multix OS Unix History : Unix shell history : VI editor : History of pipes concept : Solaris : MS DOS : Programming Languages History : PL/1 : Simula 67 : C : History of GCC development : Scripting Languages : Perl history : OS History : Mail : DNS : SSH : CPU Instruction Sets : SPARC systems 1987-2006 : Norton Commander : Norton Utilities : Norton Ghost : Frontpage history : Malware Defense History : GNU Screen : OSS early history
Classic books:
The Peter Principle : Parkinson Law : 1984 : The Mythical Man-Month : How to Solve It by George Polya : The Art of Computer Programming : The Elements of Programming Style : The Unix Hater’s Handbook : The Jargon file : The True Believer : Programming Pearls : The Good Soldier Svejk : The Power Elite
Most popular humor pages:
Manifest of the Softpanorama IT Slacker Society : Ten Commandments of the IT Slackers Society : Computer Humor Collection : BSD Logo Story : The Cuckoo's Egg : IT Slang : C++ Humor : ARE YOU A BBS ADDICT? : The Perl Purity Test : Object oriented programmers of all nations : Financial Humor : Financial Humor Bulletin, 2008 : Financial Humor Bulletin, 2010 : The Most Comprehensive Collection of Editor-related Humor : Programming Language Humor : Goldman Sachs related humor : Greenspan humor : C Humor : Scripting Humor : Real Programmers Humor : Web Humor : GPL-related Humor : OFM Humor : Politically Incorrect Humor : IDS Humor : "Linux Sucks" Humor : Russian Musical Humor : Best Russian Programmer Humor : Microsoft plans to buy Catholic Church : Richard Stallman Related Humor : Admin Humor : Perl-related Humor : Linus Torvalds Related humor : PseudoScience Related Humor : Networking Humor : Shell Humor : Financial Humor Bulletin, 2011 : Financial Humor Bulletin, 2012 : Financial Humor Bulletin, 2013 : Java Humor : Software Engineering Humor : Sun Solaris Related Humor : Education Humor : IBM Humor : Assembler-related Humor : VIM Humor : Computer Viruses Humor : Bright tomorrow is rescheduled to a day after tomorrow : Classic Computer Humor
The Last but not Least Technology is dominated by two types of people: those who understand what they do not manage and those who manage what they do not understand ~Archibald Putt. Ph.D
Copyright © 1996-2021 by Softpanorama Society. www.softpanorama.org was initially created as a service to the (now defunct) UN Sustainable Development Networking Programme (SDNP) without any remuneration. This document is an industrial compilation designed and created exclusively for educational use and is distributed under the Softpanorama Content License. Original materials copyright belong to respective owners. Quotes are made for educational purposes only in compliance with the fair use doctrine.
FAIR USE NOTICE This site contains copyrighted material the use of which has not always been specifically authorized by the copyright owner. We are making such material available to advance understanding of computer science, IT technology, economic, scientific, and social issues. We believe this constitutes a 'fair use' of any such copyrighted material as provided by section 107 of the US Copyright Law according to which such material can be distributed without profit exclusively for research and educational purposes.
This is a Spartan WHYFF (We Help You For Free) site written by people for whom English is not a native language. Grammar and spelling errors should be expected. The site contain some broken links as it develops like a living tree...
|
|
You can use PayPal to to buy a cup of coffee for authors of this site |
Disclaimer:
The statements, views and opinions presented on this web page are those of the author (or referenced source) and are not endorsed by, nor do they necessarily reflect, the opinions of the Softpanorama society. We do not warrant the correctness of the information provided or its fitness for any purpose. The site uses AdSense so you need to be aware of Google privacy policy. You you do not want to be tracked by Google please disable Javascript for this site. This site is perfectly usable without Javascript.
Last modified: March, 03, 2020


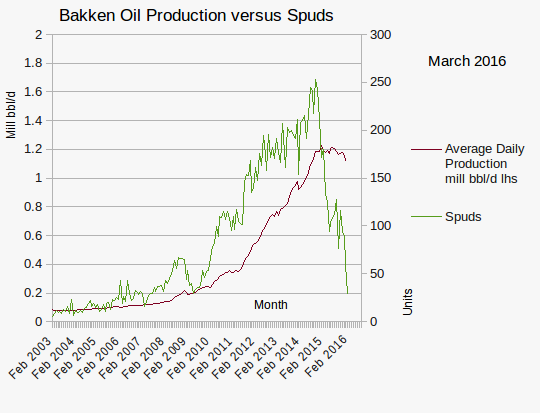
Interesting post. Presumably "Expectations" = Crude Oil Futures Contracts. If so, who controls the price of Oil futures contracts and made the decision to throw the Bakken under the bus, along with more than a few sovereign nations who rely to a significant degree on oil exports economically and to maintain domestic political stability?
Role of demand suppression from high levels of consumer debt, China's economic slowdown, ongoing fallout from the 2008 financial collapse, neoliberal government austerity policies, improvement in energy efficiency, emergence of renewables, and other factors were understated here IMO.
In the past here has also been a variable time lag between low oil prices and rising levels of economic activity.
But maybe this development is overall not such a bad thing given global warming considerations.
CG, I was thinking something similar, that "expectations" is the euphemism for speculation in the futures markets, which, as most know from this site, is now dominated by investor-speculators. The model they used refers to Killian who is one of the handful of academics who try to refute anyone who argues speculators have influenced oil (and other commodity) prices.
My own take (anyone interested can read it here) is there was a series of bubbles generated from the futures market that created the belief higher oil prices were here to stay.
Interesting blog post. Thanks, TiPS.
Noted your article was written before the Central Banks-Primary Dealer cartel renewed pumping equities on February 11 IMHO. Jury is out on whether they've jumped the shark. Also, whether they care.
'The observed drop in oil prices should have a slightly positive impact on the EU economy.'
Probably true. But likely there's a "J-curve effect."
That is, the initial deflationary shock hikes corporate bond spreads (driven by the energy sector) and feeds recession fears. Such fears encourage investors to seek the safe haven of government bonds, at the expense of stocks and credit bonds.
Later as confidence returns, the beneficial effect of lower energy costs (including bolstered consumer demand) can actually be realized.
Arguably, Jan-Feb 2016 constituted the bottom of the "J." We'll see.