|
|
Home | Switchboard | Unix Administration | Red Hat | TCP/IP Networks | Neoliberalism | Toxic Managers |
| (slightly skeptical) Educational society promoting "Back to basics" movement against IT overcomplexity and bastardization of classic Unix | |||||||
Benford's law is an observation about the leading digits of the numbers found in real-world data sets. Intuitively, one might expect that the leading digits of these numbers would be uniformly distributed so that each of the digits from 1 to 9 is equally likely to appear.
In fact, it is often the case that 1 occurs more frequently than 2, 2 more frequently than 3, and so on. This observation is a simplified version of Benford's law. More precisely, the law gives a prediction of the frequency of leading digits using base-10 logarithms that predicts specific frequencies which decrease as the digits increase from 1 to 9.
This phenomenon occurs generally in many different instances of real-world data. It becomes more pronounced and more likely when more data is combined together from different sources. Not every data set satisfies Benford's law, and it is surprisingly difficult to explain the law's occurrence in the data sets it does describe, but nevertheless it does occur consistently in well-understood circumstances.
Scientists have even begun to use versions of the law to detect potential fraud in published data (tax returns, election results) that are expected to satisfy the law.
It is difficult for humans to manually construct distributions that satisfy Benford's law. Fraudulent numerical data can often be identified by simply looking at the frequency of first digits, although often in practice more than one digit is used for a more precise check. In particular, Benford's law has been applied to entries on tax forms, election results, economic numbers, and accounting figures.
Joe Biden’s votes violate Benford’s Law, President Trump’s do not.
Benford’s law or the first-digit law, is used to check if a set of numbers are naturally occurring or manually fabricated. It has been applied to detect the voting frauds in Iranian 2009 election and various other applications including forensic investigations.
Benford’s Law, also called the Newcomb–Benford law, the law of anomalous numbers, or the first-digit law, is an observation about the frequency distribution of leading digits in many real-life sets of numerical data. The law states that in many naturally occurring collections of numbers, the leading digit is likely to be small. For example, in sets that obey the law, the number 1 appears as the leading significant digit about 30% of the time, while 9 appears as the leading significant digit less than 5% of the time. If the digits were distributed uniformly, they would each occur about 11.1% of the time. Benford’s law also makes predictions about the distribution of second digits, third digits, digit combinations, and so on.
Plots of the first digits of counts in various precincts and wards for selected counties/cities.

This is Pittsburgh.
But even cities where we know the outcome, the numbers have been manipulated such as
When this fraud is corrected the electoral map will look quite different, and may even swing a few house and senate votes.
|
|
Switchboard | ||||
| Latest | |||||
| Past week | |||||
| Past month | |||||
Nov 10, 2020 | www.breitbart.com
Stephen Dutton plagar3 • 12 hours ago
I don't think I'd go that far. There is a numerical analysis method called "Benford's Law" that has been used in the past to show instances of voter fraud in Iran. When applied to voting patterns for candidates other than Biden it shows no problems in any states. Apparently it does not show problems for Biden either in states where he lost or those obviously liberal ones that were almost bound to support him. However, when the analysis is performed on the results coming in from swing states where we are being told he pulled off some very lucky victories the picture becomes different. So different that big tech are pulling down posts about it.
Nov 09, 2020 | principia-scientific.com
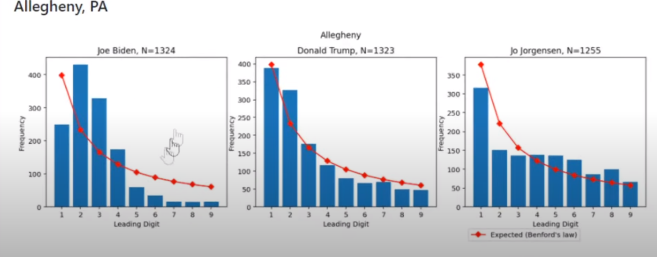
However, in the Milwaukee County of Wisconsin, which is in one of the key swing states, Joe Biden's votes violate Benford's Law while other candidates' don't. (Joe Biden 69.4%, Donald Trump 29.4%, Jo Jorgensen 0.9%. Source: theguardian.com)
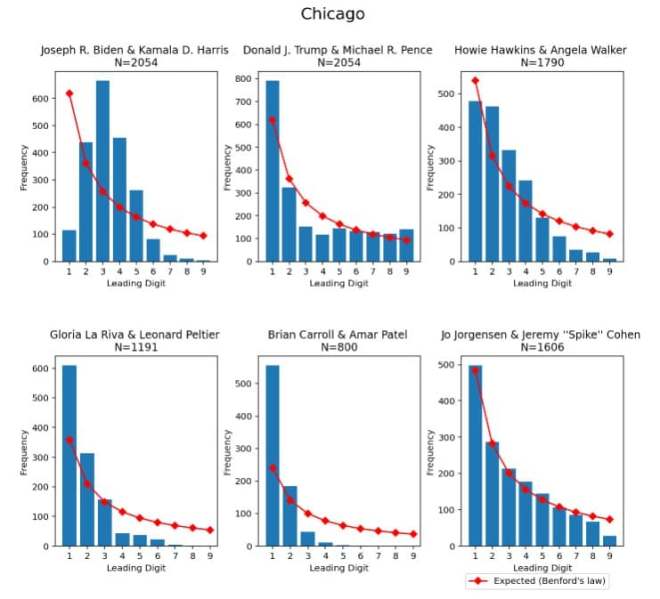
And in Chicago of Illinois, Joe Biden's votes are abnormal.
So does that of Allegheny of Pennsylvania which includes Pittsburg. (Joe Biden 59.0%, Donald Trump 39.9%, Jo Jorgensen 1.2%. Source: theguardian.com)
It looks like maybe Biden had lost big cities like Chicago and Pittsburgh, which is why the fraudulent votes need to be brought in, which skew his curve away from a normal looking one.
For those who are interested to reproduce the analysis, you can follow the instructions here and give it a go.
Read more at gnews.org
Jan 04, 2017 | www.cambridge.org
Abstract
- Joseph Deckert (a1) , Mikhail Myagkov (a1) and Peter C. Ordeshook (a1)
- DOI: https://doi.org/10.1093/pan/mpr014
- Published online by Cambridge University Press:
The proliferation of elections in even those states that are arguably anything but democratic has given rise to a focused interest on developing methods for detecting fraud in the official statistics of a state's election returns. Among these efforts are those that employ Benford's Law, with the most common application being an attempt to proclaim some election or another fraud free or replete with fraud.
This essay, however, argues that, despite its apparent utility in looking at other phenomena, Benford's Law is problematical at best as a forensic tool when applied to elections.
Looking at simulations designed to model both fair and fraudulent contests as well as data drawn from elections we know, on the basis of other investigations, were either permeated by fraud or unlikely to have experienced any measurable malfeasance, we find that conformity with and deviations from Benford's Law follow no pattern.
It is not simply that the Law occasionally judges a fraudulent election fair or a fair election fraudulent. Its "success rate" either way is essentially equivalent to a toss of a coin, thereby rendering it problematical at best as a forensic tool and wholly misleading at worst.
Jan 01, 2020 | skeptics.stackexchange.com
I'll address just the second charts, because they are straight out of How To Lie With Statistics .
As commenters have noted , the vertical scales are different. Narrow vertical scales make changes look larger. While wide vertical scales smooth out changes. Biden's graph is using a more narrow scale than Trump's.
Put them all together in one graph with the same scale and they don't look so different anymore.
I had to eyeball the numbers from the graphs, but more precise numbers won't change the outcome. I don't even know if the numbers are correct. I can say with some certainty that the graphs are deliberately constructed to sell a lie. One or the other scale is a natural choice, either 0 to max or min to max. Someone had to choose to use different vertical axes for each graph.
Disclaimer: I have not looked at the actual data.
In general, the biggest problem with applying Benford's law to district level election data is, that precincts are usually small and similar in size. For example, if all the precincts have around 800 voters and one candidate consistently takes 40-50% of votes, then it is expected, that the most frequent first digits will be 3 and 4.
Benford's law works better in cases where the values span multiple orders of magnitude, which is not the case here.
For concrete examples, it is worth looking at the several Github issues on the source of the analysis:
The disappearance of Benford's law in Milwaukee is a function of voter preference alone. If one candidate has between 60% and 80% average chance of receiving a vote, then the sizes of the wards in Milwaukee are too small to accommodate Benford's law.
More generally, several papers question the usefulness of Benford's law applied to election data:
Does the Application of Benford's Law Reliably Identify Fraud on Election Day?
Unfortunately, my analysis shows that Benford's Law is an unreliable tool. And, as one applies more sophisticated methods of estimation, the results become increasingly inconsistent. Worse still, when compared with observational data, the application of Benford's Law frequently predicts fraud where none has occurred.
Benford's Law and the Detection of Election Fraud
It is not simply that the Law occasionally judges a fraudulent election fair or a fair election fraudulent. Its "success rate" either way is essentially equivalent to a toss of a coin, thereby rendering it problematical at best as a forensic tool and wholly misleading at worst.
Looking at the actual Chicago data at https://www.chicagoelections.gov/en/election-results-specifics.asp by precinct as of late November 7, the charts for Chicago look credible but the assumption that Benford's law should apply do not, at least for Biden/Harris or the minor candidates.
Of the 2069 precincts (most of which are of broadly similar size), Biden/Harris won fewer than 100 votes in 12 precincts, and more than 999 votes in 4 precincts. All the rest (more than 99%) had three digits for their votes, violating the requirement that natural data satisfying Benford's law should span several orders of magnitude . More than half the precincts (1100) gave Biden/Harris from 300 through to 499 votes, making 3 and 4 the most common first digits (the chart reflects this and is close to showing the actual frequencies by hundreds of votes, so 300-399 was the most common).
For Trump/Pence, votes were more widely dispersed: 99 precincts with 1-9 votes, 1339 precincts with 10-99, and 633 precincts with 100 or more votes. This dispersion over orders of magnitude allowed a greater chance of coming closer to matching Benford's law.
For the minor candidates, they only reached double digits in a very small number of precincts (and got 0 votes in hundreds of precincts - not shown on the charts) so the charts are close to showing their actual vote distribution with censoring of 0 and 10+; again you would not expect Benford's law to apply.
Chicago was an odd choice to investigate for suspected cheating in 2020 where the gap in Illinois was 12 percentage points (1960 when it was 0.2 percentage points might have been more interesting). I suspect it was chosen simply because the data is publicly available and the distortions caused by similar precinct size led to this non-Benford law result. You will see this elsewhere for similar reasons: in 2019 very few British MPs won a number of votes starting with 5-9, as their constituencies are of broadly similar sizes and the winners usually got in the range from 10,000 to 49,999 votes, again failing the spanning several orders of magnitude requirement. share improve this answer follow answered yesterday Henry 12.9k 1 1 gold badge 51 51 silver badges 57 57 bronze badges
user3570982 ,
That's a good explanation, though not entirely accurate: There is no requirement for spanning several orders of magnitude, and Benford's Law can be observable even when there is not a wide span of magnitudes. If there is a wide span, Benford's Law tends apply more accurately, but it's not a requirement. What's required is that there not be a cutoff of possible leading digits (a bounding requirement). – user3570982 yesterdayAcccumulation , 2020-11-09 01:58:10
According to Wikipedia:
Benford's law, also called the Newcomb–Benford law, the law of anomalous numbers, or the first-digit law, is an observation about the frequency distribution of leading digits in many real-life sets of numerical data. The law states that in many naturally occurring collections of numbers, the leading digit is likely to be small.
...
It tends to be most accurate when values are distributed across multiple orders of magnitude, especially if the process generating the numbers is described by a power law (which is common in nature).Beford's Law is not some universal phenomenon, and it failing to hold is not "proof" of fraud. For instance, we can play this game with the vote percentages that Donald Trump received in 2016: 11 first digit of 3, 19 first digit of 4, 16 first digit of 5, 9 first digit of , and 1 first digit of 7 (yes, this adds up to 56; some states don't assign electors based on state-wide totals, and there's also DC). Clearly, Trump's vote percentages were fraudulent! In the reddit thread, u/Three-Twelve says
In the case of the Milwaukee data and Detroit cited in the pictures above, the number of votes per voting area does not span over several orders of magnitude, so Benford's Law is not applicable.
The size of a precinct is likely a stronger predictor of the number of votes for Biden, than Biden's support is. If these people want to claim that this is evidence that the number of voters per precinct is not random, that would be more supported by the evidence, but also much more vacuous (it's hardly earth shattering news that some precinct sizes are preferred over others).
The amount by which a candidate's level of support predicts their vote count, compared to how well precinct size does, will increase the more that level of support varies (as a percentage of that support). Thus, if Biden's support varies between 90% and 95%, and Trump's varies from 5% to 10%, Biden's support is varying by a bit more than 5% (the math is a bit confusing, as this is a percentage of a percentage; 5% is a bit more than 5% of 90%), and Trump's support is varying by 100% (5% is 100% of 5%). So Trump's vote totals will vary more than Biden's, and thus Trump's totals will have more variance across orders of magnitude, and Beford's Law will be more applicable (note that Jo Jorgensen, who has even less support than Trump, has a distribution that is also closer to Benford). For an apples to apples comparison, we'd want to compare to places where Trump was the favored candidate, but those are rural areas, and I would expect precinct sizes to vary more in rural areas than in cities.
The Wikipedia article further says:
Based on the plausible assumption that people who fabricate figures tend to distribute their digits fairly uniformly, a simple comparison of first-digit frequency distribution from the data with the expected distribution according to Benford's law ought to show up any anomalous results.
Biden's distribution is consistent neither with Benford, nor with a uniform distribution. It is, however, a very good fit for a Poisson or lognormal distribution.
Whenever you have a statistical analysis, it's important to remember that the what it can tell you is that the observed data is unlikely given your null hypothesis. Going from that to that the null definitely is false requires further justification, and assuming that because the null is false that means that your favored alternative is true is a false dichotomy. If someone has a model in which this voting data is unlikely, all that is an argument for is that their model is false. Democrats engaging is fraud is just one possible way the model could be false. share improve this answer follow edited 20 hours ago answered 20 hours ago Acccumulation 2,003 1 1 gold badge 10 10 silver badges 14 14 bronze badges
KT,
Do vote counts for Joe Biden in the 2020 election violate Benford's Law?
Simple, uninformative answer: They apparently considerably deviate from it, at least on one of the presented charts.
Caveat: This observation alone is not sufficient to jump to any conclusions yet. Two additional questions need to be answered before attempting any jumps:
How (im)probable is this observation under our "normal worldview"?
Although a commonly observed pattern in election datasets, there are no guarantees for Benford's law to necessarily always emerge. It is therefore important to understand when it is expected to emerge and how far can we expect a given district to deviate from it. This can be done by, for example, analyzing previous elections ( assuming those represent "normal voting"). We can model each district's vote distribution based on historical data and measure the expected degree of deviation from Benford's law. Once this is done, we may assess the probability of seeing the observed deviations under these "normal conditions" (a.k.a. the "p-value"). If this probability ends up being low, we will be able to say that "we are very surprised" by our observations.
What is the cause of the deviation?
If the analysis in step 1 happens to result in a "sufficietly low" p-value, i.e the data does not match a "normal" worldview, our next order of business is to come up with an explanation - a model of a "new" worldview, which fits the data better (e.g. by including a particular voting fraud process). Only then we can try to jump to any conclusions.
Metacaveat: Although this all would be pretty standard, textbook-approved methodology of data analysis, give up your hopes that this could help anyone "learn the Truth". Both steps include enormous amounts of subjective judgement and, in the end, it is still one's own beliefs that determine which conclusion to jump towards.
The first step ("modeling normality"), despite relying on mathy techniques and bearing resemblance to hard science, is, none the less, a form of art. Depending on which historical data one picks and how one processes it, it may be possible to end up with the p-value estimate ranging between "unbelievable" to "totally expected".
The second step ("modeling abnormality") is even more subjective - one can usually find hundreds of valid explanations, ranging from data errors to seasonal abnormalities to various types of fraud, and the final decision will be determined by one's prior beliefs as to which of these explanations "seem more plausible".
Given how politically charged the question is, convincing someone else in any chosen judgement's "objectivity" here is probably hopeless. However, I would be extremely interested if anyone actually attempted a systematic analysis and suggested a tentative p-value estimate for the observations. share improve this answer follow edited 23 hours ago answered yesterday KT. 153 2 2 bronze badges New contributor
user1781498 ,
This answer is based on original data analysis or non-verifiable data. It is up to the answerer to provide valid, verifiable and potentially replicable evidence. Answers which are wholly based on "original research" are generally downvoted and may be deleted. See FAQ: What constitutes original research?
The charts for this question are from this repo . I created a fork of the repo here . I did chi-squared statistics tests on all the counties and all the counties have in the repo have statistically significant data for deviations from Benford's law.
My understanding is that the chi-squared test should be valid for sample sizes over 50. Which is what the benford statistical testing module I'm using says. They use Donald Trump's 2016 election vote data as an example. It did not violate Benford's law. Quote from the module's README:
Dataset should preferably cover at least 1000 samples. Though Benford's law has been shown to hold true for datasets containing as few as 50 numbers.
I think the graphs' weird proportions are mostly just to make the text display correctly. I think it's mostly due to laziness and not thinking about the weird proportions.
There's discussion in the main repo's issues page on how accurate Benford's law is or is not for detecting election fraud. There's also people saying in the issues saying that using the second digit instead of the first is more accurate for detecting election fraud. I don't know whether that's true or not. share improve this answer follow edited yesterday answered yesterday user1781498 33 2 2 bronze badges New contributor
user1781498 ,
Such a naive approach is probably misleading. You might want to read this: researchgate.net/publication/ – BKE 23 hours ago
Nov 09, 2020 | www.tigerdroppings.com
Benford's Law catches Biden red handed: a repost Posted on 11/6/20 at 8:59 pm
63
6 Look at these fricks in Milwaukee. Trump "lost" by 20,000 votes when there was a 100,000+ only Biden vote dump at 4 in the morning.
This post was edited on 11/6 at 9:01 pm
Nov 09, 2020 | lenbilen.com
Two Statistical Curiosities That Allowed Biden To Pull Ahead In PA: A Limerick and more.
The votes that was tallied in Philly
were not added up willy-nilly.
For the fraud is state-wide
leaving no place to hide.
It's treason; deny it is silly.
Two Statistical Curiosities That Allowed Biden To Pull Ahead In PA:
A brief note. I've been asked to examine the Pennsylvania votes. That work is ongoing. Update See below for a serious critique of Benford's law.
I'm showing here (with permission) the one analysis I found most curious.
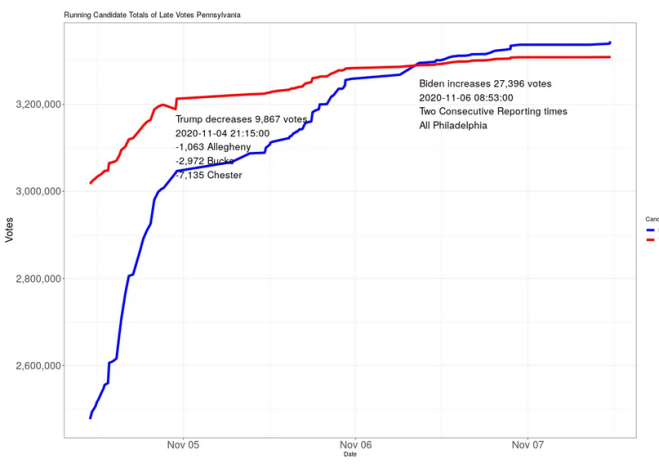
This is official county-level timed voting data that started at 2020-11-04 11:00:00, a day after the election, to 2020-11-07 11:29:00 which is Saturday night. That is, these are all late vote counts. They start, county by county, where the vote left off on election night.
This is a picture of the running totals by the time the votes were added, summed across all counties, during those time periods. They do not start at 0, but at the totals given after election night.
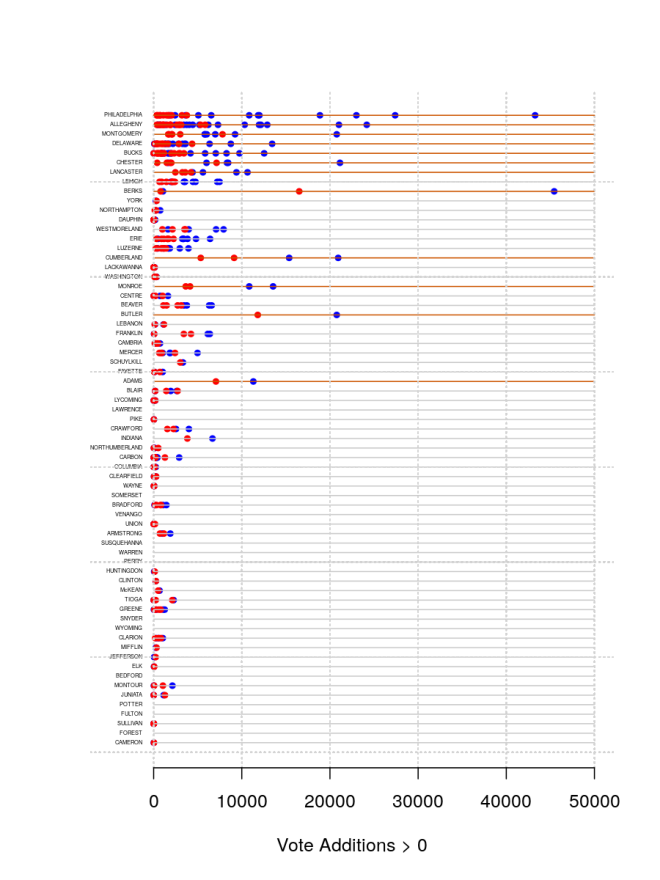
The early gains for Biden are from, mainly, Philadelphia, Allegheny, Montgomery, Chester and Berks counties. A simple plot
shows the size of vote additions for both candidates, when new vote totals (greater than 0) were added by county (and not all counties added votes after election day).
All goes well for Trump until 2020-11-04 21:15:00 when he loses just under 10,000 votes, but curiously from three different counties simultaneously: -1,063 Allegheny; -2,972 Bucks; -7,135 Chester. Biden never lost any votes (at least, in this late voting).
Understand that this does not mean the decreases happened at this time, but that they were recorded in the official data as happening at that time. And the same is true for our next observation.
Biden's next curiosity was the big increase of 27,396 votes at 2020-11-06 08:53:00 over one consecutive reporting period. This bump is just like the blue-red F-memes you have seen: this only seems more spread out because of the finer time scale used.
These two curiosities account for a 37,263 vote swing for Biden. Biden's total, as of the end of this data, was 3,344,528, and Trump's 3,310,326. Biden therefore "won", in this dataset anyway, by 34,202 votes.
Biden could not have pulled ahead without the curiosities noted above.
There is more to come. Stick around.
Update Benford's law is only useful in uncovering multiple and on-going instances of cheating. As in somebody consistently cooking financial books. As I showed above, assuming the curiosities are cheats, it only took two instances to tip the balance. Benford's law will never pick this up: never.
I'm skeptical of what I'm seeing in other analyses, because if somebody turns something up with Benford, it implies that many, many vote totals were tampered with, which increases the possibilities of getting caught. And you don't need to tamper with many. Only a few.
Nov 09, 2020 | lenbilen.com
his is a map of the extent to which Dominion voting machines software is presently used. When votes are tallied it produces results that are not credible according to statistical science.
Joe Biden's votes violate Benford's Law, President Trump's do not.
Benford's law or the first-digit law, is used to check if a set of numbers are naturally occurring or manually fabricated. It has been applied to detect the voting frauds in Iranian 2009 election and various other applications including forensic investigations.
Benford's Law , also called the Newcomb–Benford law, the law of anomalous numbers, or the first-digit law, is an observation about the frequency distribution of leading digits in many real-life sets of numerical data. The law states that in many naturally occurring collections of numbers, the leading digit is likely to be small. For example, in sets that obey the law, the number 1 appears as the leading significant digit about 30% of the time, while 9 appears as the leading significant digit less than 5% of the time. If the digits were distributed uniformly, they would each occur about 11.1% of the time. Benford's law also makes predictions about the distribution of second digits, third digits, digit combinations, and so on.
Plots of the first digits of counts in various precincts and wards for selected counties/cities.
This is Pittsburgh.
But even cities where we know the outcome, the numbers have been manipulated such as
When this fraud is corrected the electoral map will look quite different, and may even swing a few house and senate votes.
Nov 09, 2020 | www.truthorfiction.com
Hoft linked to a November 7 2020 GNews.org item with the headline "Joe Biden's votes violate Benford's Law (Mathematics)," which began with a cascade of pseudointellectual lies:
As the vote counting for the 2020 Presidential Election continues, various facts suggest rampant frauds in Joe Biden's votes. So does mathematics in terms of the votes from precincts.
Benford's law or the first-digit law, is used to check if a set of numbers are naturally occurring or manually fabricated. It has been applied to detect the voting frauds in Iranian 2009 election and various other applications including forensic investigations.
On Gab , a blog post written by Hoft was atop its list of trending topics, featuring the following headline:
UPDATE: Facebook and Twitter Suspend Accounts That Posted on Benford's Law Showing Biden's Implausible Vote Totals -- LABELING IT "SEXUAL EXPLOITATION"
This part appears to be legitimate; we are contacting Facebook for details. However, that warning appears to be more a reaction to previous claims made by Hoft and his ilk. We have contacted Facebook for comment.
In that November 8 2020 post, Hoft primarily accused Facebook and Twitter of censoring shares of his tweet and the GNews.org post, writing:
We have heard from many readers who told us once they retweeted this tweet or tried to post it on Facebook their account was suspended! The social media giants are preventing Americans from posting this mathematical evidence that proves Joe Biden's numbers violate the Benford Law of normal distributions!
In a prescient November 6 2020 analysis by the Election Integrity Partnership ("Vote Data Patterns Used to Delegitimize the Election Results"), claims about Benford's Law were one of several topics discussed in relation to potential efforts to delegitimize the final vote tallies with social media-enabled election interference.
The Election Integrity Project also displayed two charts, one called "Vote Tallies Projected against Benford's Law," and the other, "Final Vote Tallies Projected against Benford's Law." Contrasting the two, they wrote:
The figure above ["Vote Tallies Projected against Benford's Law"] shows the leading digit of reported vote tallies across select counties. For instance, the final tally in Dane County, Wisconsin was 338,946. This would count for one county in the 3 column. But why would anyone care to look at this kind of frequency distribution? Data forensic experts use these distributions to investigate fraud. They look at whether empirical distributions of leading digits deviate from a special distribution described by Benford's Law. The law posits that leading digits of numbers are more likely to be smaller numbers (e.g., 1) than larger numbers (e.g., 9).
Armchair investigators during the election have already begun to argue that too many of the submitted vote totals begin with larger single digit numbers (7 or 8 for example), which is being spun as evidence of voter fraud. We caution against this conclusion. Having the distribution of leading digits stray from the expected percentages predicted by Benford's Law can happen by chance, though it is more common when the law's assumptions are violated, as they often are with vote tallies. Benford's Law, and other math-based inquiries, can be used to detect voter fraud, but the vast majority of these violations are not conclusive evidence of fraud.
[ ]
Returning to our voting tally in Figure 1, you will see that the tallies deviate from the line of expectation. So, does this mean fraud? Does it mean that vote counters were up to something nefarious? In this case, absolutely not. First, the example above is a simulation based on a computer script, rather than one based on real voter data. If we consider the final output of this 72 county simulation, it ends up looking like Figure 2 ["Final Vote Tallies Projected against Benford's Law"]:
These final results are more predictable and follow the expected counts more closely, but still exhibit expected deviations. These same deviations are occurring in the voting counts currently being reported in the 2020 election. Our aim in this post is to prepare the public and journalists for these misleading arguments and to provide context for the claims already being made online.
In their conclusion, the Election Integrity Partnership noted that claims about Benford's Law "proving" election fraud were based on early, incomplete data -- not to mention a fundamental misunderstanding of how it works. Essentially, claimants citing Benford's Law were cherry picking early or incomplete results to stake their claim:
At this stage, the assumptions that lead to Benford's law are violated leading to the patterns generated in the Figure 1 above. Only once all counties have been counted does the distribution approach something consistent with Benford's law, seen in Figure 2. Even at this stage, the distribution of county sizes still makes it unlikely to exactly match expectations. A more complete model might include non-random voting patterns whereby rural counties lean a different direction than urban ones. This, compared with the relationship between the rate of vote counting and county or precinct size would probably cause more drastic violations of assumptions. As this is a rapid response, incorporating this complexity was impractical.
Unsurprisingly, a spike in interest involving one particular mathematical principle (Benford's Law) led to drama over on the topic's Wikipedia page. On the "Talk" page for "Benford's Law," one section ("Benford, QAnon, and the 2020 election") began:
Following the 2020 United States presidential election result, a number of QAnon folks have been promoting a theory on social media that the failure of voting numbers for Biden to match Benford is a demonstration of likely electoral fraud. This is likely why there has been a big increase in interest in this page, and in particular the electoral fraud section. The short answer is no. These claims are baseless, and come from a misapplication of Benford's law to particular cities in a county, or wards in a city, as opposed to all counties/cities in the US (which is how Benford detected possible fraud in Iran. If you do this analysis in the US you find that yes, all the numbers fit Benford perfectly). Of course, this cannot be posted in the article as it would constitute original research, but it is worth keeping a close eye on the article as there may be misleading edits made in support of the conspiracy theory over the next few days. Awoma (talk) 09:46, 8 November 2020
Application (or misapplication) of Benford's Law to the 2020 election eventually made an appearance in a massive , regularly updated Twitter thread by political reporter Isaac Saul cataloging disinformation around the results of the 2020 election:
https://platform.twitter.com/embed/index.html?creatorScreenName=kimlacapria&dnt=true&embedId=twitter-widget-1&frame=false&hideCard=false&hideThread=false&id=1324435797374808066&lang=en&origin=https%3A%2F%2Fwww.truthorfiction.com%2Fdoes-benfords-law-prove-election-fraud-in-biden-votes%2F&siteScreenName=erumors&theme=light&widgetsVersion=ed20a2b%3A1601588405575&width=550px
On November 5 2020, Saul first mentioned Benford's Law, noting that he was not initially familiar with the principle nor its purported relation to current election fraud claims:
https://platform.twitter.com/embed/index.html?creatorScreenName=kimlacapria&dnt=true&embedId=twitter-widget-2&frame=false&hideCard=false&hideThread=false&id=1324502597064105989&lang=en&origin=https%3A%2F%2Fwww.truthorfiction.com%2Fdoes-benfords-law-prove-election-fraud-in-biden-votes%2F&siteScreenName=erumors&theme=light&widgetsVersion=ed20a2b%3A1601588405575&width=550px
Saul eventually cited a 2011 paper ("Benford's Law and the Detection of Election Fraud") from Political Analysis , vol. 19, no. 3. Its abstract explained:
The proliferation of elections in even those states that are arguably anything but democratic has given rise to a focused interest on developing methods for detecting fraud in the official statistics of a state's election returns. Among these efforts are those that employ Benford's Law, with the most common application being an attempt to proclaim some election or another fraud free or replete with fraud. This essay, however, argues that, despite its apparent utility in looking at other phenomena, Benford's Law is problematical at best as a forensic tool when applied to elections. Looking at simulations designed to model both fair and fraudulent contests as well as data drawn from elections we know, on the basis of other investigations, were either permeated by fraud or unlikely to have experienced any measurable malfeasance, we find that conformity with and deviations from Benford's Law follow no pattern . It is not simply that the Law occasionally judges a fraudulent election fair or a fair election fraudulent. Its "success rate" either way is essentially equivalent to a toss of a coin, thereby rendering it problematical at best as a forensic tool and wholly misleading at worst.
A 2006 paper [ PDF ] presented at a political methodology conference addressed the application of Benford's Law alone to evidence claims of election fraud:
Another important issue concerns whether Benford's Law should be expected to apply to all the digits in reported vote counts. In particular, for precinct-level data there are good reasons to doubt that the first digits of vote counts will satisfy Benford's Law. Brady (2005) develops a version of this argument. The basic point is that often precincts are designed to include roughly the same number of voters. If a candidate has roughly the same level of support in all the precincts, which means the candidate's share of the votes is roughly the same in all the precincts, then the vote counts will have the same first digit in all of the precincts. Imagine a situation where all precincts contain about 1,000 voters each, and a candidate has the support of roughly fifty percent of the voters in every precinct. Then most of the precinct vote totals for the candidate will begin with the digits '4' or '5.' This result will hold no matter how mixed the processes may be that get the candidate to roughly fifty percent support in each precinct. For Benford's Law to be satisfied for the first digits of vote counts clearly depends on the occurrence of a fortuitous distribution of precinct sizes and in the alignment of precinct sizes with each candidate's support. It is difficult to see how there might be some connection to generally occurring political processes. So we may turn to the second significant digits of the vote counts, for which at least there is no similar knock down contrary argument.
On skeptics.stackexchange.com, one reader asked about the Benford's Law and Biden votes rumor. Another commenter reiterated that such claims were predicated on cherry-picked early numbers, and promoters of the claim were lying with graphs :
I'll address just the second charts, because they are straight out of How To Lie With Statistics.
As commenters have noted, the vertical scales are different. Narrow vertical scales make changes look larger. While wide vertical scales smooth out changes. Biden's graph is using a more narrow scale than Trump's.
Put them all together in one graph with the same scale and they don't look so different anymore.
[Graph]
I had to eyeball the numbers from the graphs, but more precise numbers won't change the outcome. I don't even know if the numbers are correct. I can say with some certainty that the graphs are deliberately constructed to sell a lie. One or the other scale is a natural choice, either 0 to max or min to max. Someone had to choose to use different vertical axes for each graph.
Rumor's that Biden's victory was impossible because it somehow "violated" Benford's Law gained further traction after Biden's victory was called on November 7 2020, promoted by disinformation purveyors like Jim Hoft. Under even the slightest scrutiny, the claims dissolved for a number of reasons -- such as their basis on early or single-district results, and general existing indications that Benford's Law was a poor model with which to "prove" election fraud across the board.
Google matched content |