|
|
Home | Switchboard | Unix Administration | Red Hat | TCP/IP Networks | Neoliberalism | Toxic Managers |
| (slightly skeptical) Educational society promoting "Back to basics" movement against IT overcomplexity and bastardization of classic Unix | |||||||
| “Diagnosing problems on unfamiliar operating
systems is like traveling is a foreign country: they do things differently there.” |
|
|
|
|
Note: Most of the material below was borrowed from Solaris Troubleshooting and Performance Tuning page at the time it was maintained by Scott Cromar. See also his class notes (August 2007)...
Troubleshooting generally consists of the following steps. Different methodologies may call them by slightly different names, but the similarities are pretty obvious.
The problem statement must be broad enough to describe the problem, but narrow enough to focus the investigation. It should not contain value judgments. It should be a factual answer to the question "What is wrong?"
Gather all symptoms, including error messages, core dumps, descriptions of any service outages, and contrasting descriptions of what still works. As near as possible, we need to identify the time of the incident.
Identify differences between the faulted system and any similar working systems. Also identify any recent changes to the system.
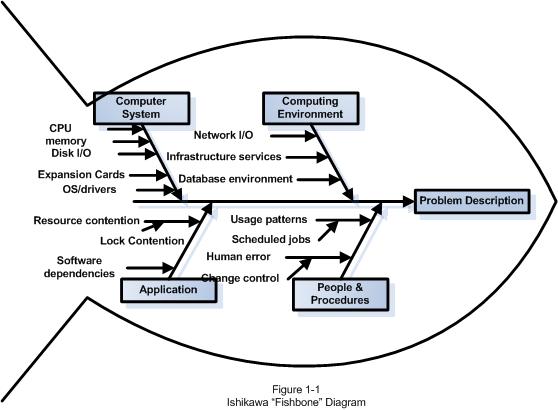
In this stage, we need to come up with as many possible explanations for the problem as possible. It is sometimes helpful (especially in a group setting) to use an Ishikawa diagram to organize our thoughts so that we don't leave any possibilities unconsidered.
Generate an Ishikawa diagram by drawing a “backbone” arrow pointing to the right at the problem statement. Then attach 4-6 “ribs,” each of which represents a major broad category of items which may contribute to the problem. Each of our components should fit on one or another of these ribs.
We need to consider how likely each potential cause is. We should only eliminate hypotheses when they are absolutely disproven.
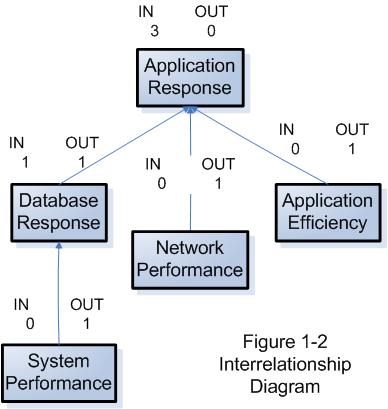
For more complex problems, something like an Interrelationship Diagram may be useful in identifying which potential cause may be might be a root cause.
Interrelationship Diagrams use boxes containing phrases describing the potential causes. Arrows between the potential causes demonstrate influence relationships between these issues. Each relationship can only have an arrow pointing in one direction. (Where the relationship's influence runs in both directions, the troubleshooters must decide which one is predominant.) Items with more “out” arrows than “in” arrows are causes. Items with more “in” arrows are effects.
We need to perform testing in the least disruptive fashion possible. Data should be backed up if possible before testing proceeds.
The best approach is to schedule testing of the most likely hypotheses immediately. Then start to perform any non-disruptive or minimally disruptive testing of hypotheses. If several of the most likely hypotheses can be tested non-disruptively, so much the better. Start with them.
In some cases, it may be possible to test the hypothesis directly in some sort of test environment. This may be as simple as running an alternative copy of a program without overwriting the original. Or it may be as complex as setting up a near copy of the faulted system in a test lab. If a realistic test can be carried out without too great a cost in terms of money or time, it can really help nail down whether we have identified the root cause of the problem.
Depending on the situation, it may even be appropriate to test out the hypotheses by directly applying the fix associated with that problem. If this approach is used, it is important to only perform one test at a time, and back out the results of each failed hypotheses before trying the next one. Otherwise, you will not have a good handle on the root cause of the problem, and you may never be confident that it will not re-emerge at the worst possible moment.
The fix needs to be implemented in the least-disruptive, lowest-cost manner possible. Ideally, the fix should be performed in a way that will completely verify that the fix itself has resolved the problem.
We need to check that the problem is resolved, and also that we have not introduced any new problems. Each service in your environment should have a test suite associated with it so that you can quickly eliminate the possibility that we have introduced a new problem.
Part of this verification should include a root-cause analysis to make sure that the real problem has been resolved. Band-Aid solutions are not really solutions.
Over time, the collection of data on resolved problems can become a valuable resource. It can be referenced to deal with similar problems. It can be used to track recurring problems over time, which can help with a root cause analysis. Or it can be used to continue the troubleshooting process if it turns out that the problem was not really resolved after all.
Intermittent problems are extremely difficult to troubleshoot. Any reproducible problem can be troubleshot, if for no other reason than that each individual component can be proven to not be the problem through experimentation. Problems that are not reproducible cannot be approached in the same way.
Problems present as intermittent for one of two reasons:
The first possibility should be addressed by going back to brainstorming hypotheses.
It may be helpful to bring a fresh perspective into the brainstorming session, either by bringing in different people, or by sleeping on the problem.
The second problem is tougher. There are hardware diagnostics tests that can be run to try to identify the failing piece of hardware.
The first thing to do is to perform general maintenance on the system. Re-seat memory chips, processors, expansion boards and hard drives.
Once general maintenance has been performed, test suites like SunVTS can perform stress-testing on a system to try to trigger the failure and identify the failing part.
It may be the case, however, that the costs associated with this level of troubleshooting are prohibitive. In this case, we may want to attempt to shotgun the problem.
Shotgunning is the practice of replacing potentially failing parts without having identified them as actually being flaky. In general, parts are replaced by price point, with the cheapest parts being replaced first.
Though we are likely to inadvertently replace working parts, the cost of the replacement may be cheaper than the costs of the alternatives (like the downtime cost associated with stress testing).
When parts are removed during shotgunning, it is important to discard them rather than keep them as spares. Any part you remove as part of a troubleshooting exercise is questionable. (After all, what if a power surge caused multiple parts to fail? Or what if there was a cascading failure?) It does not make sense to have questionable parts in inventory; such parts would be useless for troubleshooting, and putting questionable parts into service just generates additional downtime down the road.
This practice may violate your service contract if performed without the knowledge and consent of your service provider.
Regardless of the method used to deal with intermittent problems, it is essential to keep good records. Relationships between our problem and other events may only become clear when we look at patterns over time. We may only be confident that we have really resolved the problem if we can demonstrate that we've gone well beyond the usual re-occurrence frequency without the problem re-emerging.
Sometimes we end up "fixing" the same problem over and over. Root Cause Analysis helps us make sure that we have actually resolved the root cause of the problem.
For most problems, we can get to the root cause by drilling into proposed explanations by repeatedly asking "Why?" The 5 Whys method was developed by the Toyota Motor Corporation. It is based on the observation that five iterations of asking "Why?" is usually enough to get to the root cause of most real world problems.
For example:
Problem Statement: The system crashed. (Why?)
A memory chip failed. (Why?)
The machine room temperature exceeds recommendations. (Why?)
The HVAC unit is undersized given our heat load. (Why?)
Our projections for heat load were lower than what has been observed. (Why?)
We did the heat load projections ourselves rather than bringing in a qualified expert.
Some disadvantages of the 5 Whys method are:
The CRT's primary components are boxes describing symptoms and arrows representing relationships between them. Symptoms are divided into Undesirable Effects (UDE) and Neutral Effects (NE). This allows us to recognize the effects of things in our environment that are not viewed as undesirable, but which may contribute to a UDE.
Arrows may flow in both directions if necessary. In particular, this allows us to identify a negative feedback loop.
Two or more symptoms may have their arrows combined with an ellipse. This means that the combination of those symptoms is sufficient to provoke the following UDE, but that all of them are required.
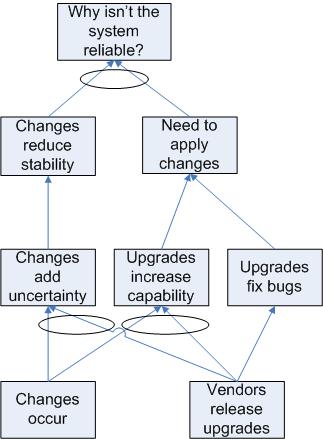
To build a CRT, we ask a Key Question with our Problem Statement. The question will usually be of the form "Why is this happening?" Next, we need to create a list of several Undesirable Effects which are related to the Key Question. Each symptom (UDE or NE) gets a box. Wherever we can say something like "If A, then B," we would draw an arrow from A to B. Where we can say something like "If A is combined with B, then we get C," we would draw arrows from A and B to C, then group the arrows with an ellipse.
At the lowest level of the CRT, we should ask "Why?" and continue to build the tree down until we are at the Root Causes, also known as "Problems." If the lowest level boxes are still just symptoms of an underlying problem, build down as far as possible by asking "Why?" at each stage.
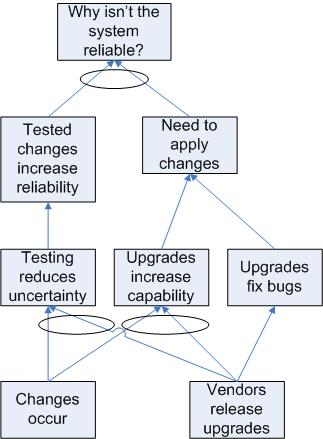
Some cases, like the one diagrammed here, end up with the root cause ending in a conflict between two Neutral Effects.
The Evaporating Cloud refers to Goldratt's method for dealing with conflicts. In particular, Goldratt discusses the Core Conflict Cloud representing the Core Conflict in our CRT.
In an Evaporating Cloud Diagram, the end goal (aka the Systemic Objective) is placed in a box on the left. The two conflicting Prerequisite Conditions are placed in boxes at the right hand side of the drawing, with a lightning bolt arrow between them. The Necessary Conditions for the Systemic Objective are placed in boxes next to their respective conflicting prerequisite conditions.
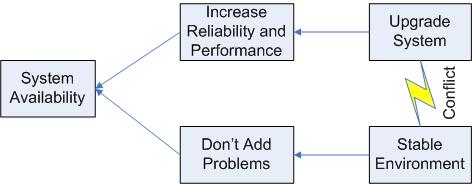
The Evaporating Cloud Diagram illustrates the age-old conflict between upgrades and system stability. On the one hand, upgrades will increase the system reliability and performance. Neglecting upgrades for too long will eventually result in system problems. On the other hand, changes always carry some risk, so there is a strong desire to avoid the pain of changes, including upgrades.
In this case, we need to recognize the end goal of providing a reliable service. Upgrades need to be performed, but should be performed in a way that allows for adequate planning and testing in order to avoid introducing problems to a working system. This sort of solution "evaporates" the cloud.
We can use this solution to build a Future Reality Tree, which is like a Current Reality Tree, but with our solution injected into the diagram:
See also The Solaris Troubleshooting Blog.
|
|
Switchboard | ||||
| Latest | |||||
| Past week | |||||
| Past month | |||||
About:
Expect-lite is a wrapper for expect, created to make expect programming even easier. The wrapper permits the creation of expect script command files by using special character(s) at the beginning of each line to indicate the expect-lite action. Basic expect-lite scripts can be created by simply cutting and pasting text from a terminal window into a script, and adding '>' 'Release focus: Major feature enhancements
Changes:
The entire command script read subsystem has changed. The previous system read directly from the script file. The new system reads the script file into a buffer, which can be randomly accessed. This permits looping (realistically only repeat loops). Infinite loop protection has been added. Variable increment and decrement have been added to support looping.Author:
Craig Miller [contact developer]
scsiinfo'
extracts formatting and other parameters from SCSI hard disk drives that aren't
listed in /etc/format.dat and can optionally create entries to be added
to your system's format.dat file.. Might be useful for old boxes.
$Id: ANNOUNCEMENT,v 1.24 2001/07/16 16:03:14 jdd Exp $

Version 4.7 of scsiinfo is now available.

New in release 4.7:
	o support for Sun's PLN fibre-channel SCSI host adapter.
        o support for Sun's simple SCSI target (sst) driver.
        o -O support (Solaris 2.x) to check for devices already open.
        o autodetection of host adapter include files.
	o Solaris 8 support.

For those unfamiliar with scsiinfo:

Scsiinfo displays information about SCSI devices attached to a given system,
as seen by a supported SCSI device driver.  For each target known to the SCSI
host adapter, scsiinfo reports SCSI transfer information for the device.  In
particular, when a target supports synchronous transfer, the negotiated
maximum transfer rate (in MB/sec) is reported.  Scsiinfo can also report the
type and speed of each supported host adapter attached to the system.  In
addition, it supports querying SCSI disks for geometry and formatting and
optionally generates a format.dat entry based on these values.  Finally,
scsiinfo supports querying SCSI devices for vendor, product, and revision
information, in the style of the Sun OpenBoot prom's probe-scsi and
probe-scsi-all commands.

Only suns with esp, isp, fas, ptisp and glm SCSI controllers
(sun4c/4m/4e/4d/4u) running SunOS 4.1 or later are supported.  The isp, fas
and glm controllers are only supported under SunOS 5.x.

Scsiinfo version 4.7 is available for anonymous ftp from:
	ftp://ftp.cs.toronto.edu/pub/jdd/scsiinfo/scsiinfo-4.7.shar
memconf' is a Perl script which determines the configuration of the RAM modules in Sun workstations. It uses the SunOS 5.x 'prtconf' and 'prtdiag' utilities extract relevent information and present it in more user-friendly format.
There are so many commands in Solaris that it is difficult to separate the cool ones from the mundane. For example, there are commands to report how much time a program spends in each system call, and commands to dynamically show system activities, and most of these commands are included with Solaris 8 as well as Solaris 9. This month, I'm highlighting some of the commands that you might find particularly useful.
Systems administrators are tool users. Through experience, we have learned that the more tools we have, the better able we are to diagnose problems and implement solutions. The commands included in this column are gleaned from experience, friends, acquaintances, and from attendance at the SunNetwork 2002 conference in September. "The /procodile Hunter" talk by Solaris kernel developers Brian Cantrill and Mike Shapiro was especially enlightening and frightening because Cantrill wrote code to illustrate a point faster than Shapiro could explain the point they were trying to illustrate!
Useful Solaris Commands
truss -c (Solaris >= 8): This astounding option to truss provides a profile summary of the command being trussed:
$ truss -c grep asdf work.doc
syscall              seconds   calls  errors
_exit                    .00       1
read                     .01      24
open                     .00       8      4
close                    .00       5
brk                      .00      15
stat                     .00       1
fstat                    .00       4
execve                   .00       1
mmap                     .00      10
munmap                   .01       3
memcntl                  .00       2
llseek                   .00       1
open64                   .00       1
                        ----     ---    ---
sys totals:              .02      76      4
usr time:                .00
elapsed:                 .05
It can also show profile data on a running process. In this case, the data shows what the process did between when truss was started and when truss execution was terminated with a control-c. It's ideal for determining why a process is hung without having to wade through the pages of truss output.
truss -d and truss -D (Solaris >= 8): These truss options show the time associated with each system call being shown by truss and is excellent for finding performance problems in custom or commercial code. For example:
$ truss -d who
Base time stamp:  1035385727.3460  [ Wed Oct 23 11:08:47 EDT 2002 ]
 0.0000 execve("/usr/bin/who", 0xFFBEFD5C, 0xFFBEFD64)  argc = 1
 0.0032 stat("/usr/bin/who", 0xFFBEFA98)                = 0
 0.0037 open("/var/ld/ld.config", O_RDONLY)             Err#2 ENOENT
 0.0042 open("/usr/local/lib/libc.so.1", O_RDONLY)      Err#2 ENOENT
 0.0047 open("/usr/lib/libc.so.1", O_RDONLY)            = 3
 0.0051 fstat(3, 0xFFBEF42C)                            = 0
. . .
truss -D is even more useful, showing the time delta between system calls:
Dilbert> truss -D who
 0.0000 execve("/usr/bin/who", 0xFFBEFD5C, 0xFFBEFD64)  argc = 1
 0.0028 stat("/usr/bin/who", 0xFFBEFA98)                = 0
 0.0005 open("/var/ld/ld.config", O_RDONLY)             Err#2 ENOENT
 0.0006 open("/usr/local/lib/libc.so.1", O_RDONLY)      Err#2 ENOENT
 0.0005 open("/usr/lib/libc.so.1", O_RDONLY)            = 3
 0.0004 fstat(3, 0xFFBEF42C)                            = 0
In this example, the stat system call took a lot longer than the others.
truss -T: This is a great debugging help. It will stop a process at the execution of a specified system call. ("-U" does the same, but with user-level function calls.) A core could then be taken for further analysis, or any of the /proc tools could be used to determine many aspects of the status of the process.
truss -l (improved in Solaris 9): Shows the thread number of each call in a multi-threaded processes. Solaris 9 truss -l finally makes it possible to watch the execution of a multi-threaded application.
Truss is truly a powerful tool. It can be used on core files to analyze what caused the problem, for example. It can also show details on user-level library calls (either system libraries or programmer libraries) via the "-u" option.
pkg-get: This is a nice tool (http://www.bolthole.com/solaris) for automatically getting freeware packages. It is configured via /etc/pkg-get.conf. Once it's up and running, execute pkg-get -a to get a list of available packages, and pkg-get -i to get and install a given package.
plimit (Solaris >= 8): This command displays and sets the per-process limits on a running process. This is handy if a long-running process is running up against a limit (for example, number of open files). Rather than using limit and restarting the command, plimit can modify the running process.
coreadm (Solaris >= 8): In the "old" days (before coreadm), core dumps were placed in the process's working directory. Core files would also overwrite each other. All this and more has been addressed by coreadm, a tool to manage core file creation. With it, you can specify whether to save cores, where cores should be stored, how many versions should be retained, and more. Settings can be retained between reboots by coreadm modifying /etc/coreadm.conf.
pgrep (Solaris >= 8): pgrep searches through /proc for processes matching the given criteria, and returns their process-ids. A great option is "-n", which returns the newest process that matches.
preap (Solaris >= 9): Reaps zombie processes. Any processes stuck in the "z" state (as shown by ps), can be removed from the system with this command.
pargs (Solaris >= 9): Shows the arguments and environment variables of a process.
nohup -p (Solaris >= 9): The nohup command can be used to start a process, so that if the shell that started the process closes (i.e., the process gets a "SIGHUP" signal), the process will keep running. This is useful for backgrounding a task that should continue running no matter what happens around it. But what happens if you start a process and later want to HUP-proof it? With Solaris 9, nohup -p takes a process-id and causes SIGHUP to be ignored.
prstat (Solaris >= 8): prstat is top and a lot more. Both commands provide a screen's worth of process and other information and update it frequently, for a nice window on system performance. prstat has much better accuracy than top. It also has some nice options. "-a" shows process and user information concurrently (sorted by CPU hog, by default). "-c" causes it to act like vmstat (new reports printed below old ones). "-C" shows processes in a processor set. "-j" shows processes in a "project". "-L" shows per-thread information as well as per-process. "-m" and "-v" show quite a bit of per-process performance detail (including pages, traps, lock wait, and CPU wait). The output data can also be sorted by resident-set (real memory) size, virtual memory size, execute time, and so on. prstat is very useful on systems without top, and should probably be used instead of top because of its accuracy (and some sites care that it is a supported program).
trapstat (Solaris >= 9): trapstat joins lockstat and kstat as the most inscrutable commands on Solaris. Each shows gory details about the innards of the running operating system. Each is indispensable in solving strange happenings on a Solaris system. Best of all, their output is good to send along with bug reports, but further study can reveal useful information for general use as well.
vmstat -p (Solaris >= 8): Until this option became available, it was almost impossible (see the "se toolkit") to determine what kind of memory demand was causing a system to page. vmstat -p is key because it not only shows whether your system is under memory stress (via the "sr" column), it also shows whether that stress is from application code, application data, or I/O. "-p" can really help pinpoint the cause of any mysterious memory issues on Solaris.
pmap -x (Solaris >= 8, bugs fixed in Solaris >= 9): If the process with memory problems is known, and more details on its memory use are needed, check out pmap -x. The target process-id has its memory map fully explained, as in:
# pmap -x 1779
1779:   -ksh
 Address  Kbytes     RSS    Anon  Locked Mode   Mapped File
00010000     192     192       -       - r-x--  ksh
00040000       8       8       8       - rwx--  ksh
00042000      32      32       8       - rwx--    [ heap ]
FF180000     680     664       -       - r-x--  libc.so.1
FF23A000      24      24       -       - rwx--  libc.so.1
FF240000       8       8       -       - rwx--  libc.so.1
FF280000     568     472       -       - r-x--  libnsl.so.1
FF31E000      32      32       -       - rwx--  libnsl.so.1
FF326000      32      24       -       - rwx--  libnsl.so.1
FF340000      16      16       -       - r-x--  libc_psr.so.1
FF350000      16      16       -       - r-x--  libmp.so.2
FF364000       8       8       -       - rwx--  libmp.so.2
FF380000      40      40       -       - r-x--  libsocket.so.1
FF39A000       8       8       -       - rwx--  libsocket.so.1
FF3A0000       8       8       -       - r-x--  libdl.so.1
FF3B0000       8       8       8       - rwx--    [ anon ]
FF3C0000     152     152       -       - r-x--  ld.so.1
FF3F6000       8       8       8       - rwx--  ld.so.1
FFBFE000       8       8       8       - rw---    [ stack ]
-------- ------- ------- ------- -------
total Kb    1848    1728      40       -
Here we see each chunk of memory, what it is being used for, how much space it is taking (virtual and real), and mode information.
df -h (Solaris >= 9): This command is popular on Linux, and just made its way into Solaris. df -h displays summary information about file systems in human-readable form:
$ df -h Filesystem size used avail capacity Mounted on /dev/dsk/c0t0d0s0 4.8G 1.7G 3.0G 37% / /proc 0K 0K 0K 0% /proc mnttab 0K 0K 0K 0% /etc/mnttab fd 0K 0K 0K 0% /dev/fd swap 848M 40K 848M 1% /var/run swap 849M 1.0M 848M 1% /tmp /dev/dsk/c0t0d0s7 13G 78K 13G 1% /export/homeConclusionEach administrator has a set of tools used daily, and another set of tools to help in a pinch. This column included a wide variety of commands and options that are lesser known, but can be very useful. Do you have favorite tools that have saved you in a bind? If so, please send them to me so I can expand my tool set as well. Alternately, send along any tools that you hate or that you feel are dangerous, which could also turn into a useful column!
Check the logfiles. On Solaris you find the standard logs in /var/log/syslog and /var/adm/messages.
Are there are other runaway processes that may cause a problem? Use prstat(1M) is useful to spot them. Make sure you are looking at this from the global zone if possible.
$ prstat -Z
The DNLC stores directory lookup information for files whose names are shorter than 30 characters. (The restriction on file name length was lifted in Solaris 7 and 8.)
sar -areports on the activity of this cache. In this output,namei/sreports the name lookup rate andiget/sreports the number of directory lookups per second. Note that anigetis issued for each component of a file's path, so the hit rate cannot be calculated directly from thesar -aoutput. Thesar -aoutput is useful, however, when looking at cache efficiency in a more holistic sense.For our purposes, the most important number is the
total name lookupsline in thevmstat -soutput. This line reports a cache hit percentage. If this percentage is not above 90%, the DNLC should be resized.DNLC size is determined by the
ncsizekernel parameter. By default, this is set to(17xmaxusers)+90(Solaris 2.5.1) or4x(maxusers + max_nprocs)+320(Solaris 2.6-8). It is not recommended that it be set any higher than a value which corresponds to amaxusersvalue of 2048.(Note that the AnswerBooks and Cockroft report the incorrect algorithm for
ncsizeandufs_ninode. The above formula comes from Sun's kernel support group.)To set
ncsize, add a line to the/etc/systemas follows:
set ncsize=10000The DNLC can be disabled by setting ncsize to a negative number (Solaris 2.5.1-7) or a non-positive number (Solaris 8).
Troubleshooting - Folder Shared from Box.net - Free Online File Storage
adb ever written. I just wish they would update the darn thing!
Or that Sun would hire them to re-write their debugger manual...)Society
Groupthink : Two Party System as Polyarchy : Corruption of Regulators : Bureaucracies : Understanding Micromanagers and Control Freaks : Toxic Managers : Harvard Mafia : Diplomatic Communication : Surviving a Bad Performance Review : Insufficient Retirement Funds as Immanent Problem of Neoliberal Regime : PseudoScience : Who Rules America : Neoliberalism : The Iron Law of Oligarchy : Libertarian Philosophy
Quotes
War and Peace : Skeptical Finance : John Kenneth Galbraith :Talleyrand : Oscar Wilde : Otto Von Bismarck : Keynes : George Carlin : Skeptics : Propaganda : SE quotes : Language Design and Programming Quotes : Random IT-related quotes : Somerset Maugham : Marcus Aurelius : Kurt Vonnegut : Eric Hoffer : Winston Churchill : Napoleon Bonaparte : Ambrose Bierce : Bernard Shaw : Mark Twain Quotes
Bulletin:
Vol 25, No.12 (December, 2013) Rational Fools vs. Efficient Crooks The efficient markets hypothesis : Political Skeptic Bulletin, 2013 : Unemployment Bulletin, 2010 : Vol 23, No.10 (October, 2011) An observation about corporate security departments : Slightly Skeptical Euromaydan Chronicles, June 2014 : Greenspan legacy bulletin, 2008 : Vol 25, No.10 (October, 2013) Cryptolocker Trojan (Win32/Crilock.A) : Vol 25, No.08 (August, 2013) Cloud providers as intelligence collection hubs : Financial Humor Bulletin, 2010 : Inequality Bulletin, 2009 : Financial Humor Bulletin, 2008 : Copyleft Problems Bulletin, 2004 : Financial Humor Bulletin, 2011 : Energy Bulletin, 2010 : Malware Protection Bulletin, 2010 : Vol 26, No.1 (January, 2013) Object-Oriented Cult : Political Skeptic Bulletin, 2011 : Vol 23, No.11 (November, 2011) Softpanorama classification of sysadmin horror stories : Vol 25, No.05 (May, 2013) Corporate bullshit as a communication method : Vol 25, No.06 (June, 2013) A Note on the Relationship of Brooks Law and Conway Law
History:
Fifty glorious years (1950-2000): the triumph of the US computer engineering : Donald Knuth : TAoCP and its Influence of Computer Science : Richard Stallman : Linus Torvalds : Larry Wall : John K. Ousterhout : CTSS : Multix OS Unix History : Unix shell history : VI editor : History of pipes concept : Solaris : MS DOS : Programming Languages History : PL/1 : Simula 67 : C : History of GCC development : Scripting Languages : Perl history : OS History : Mail : DNS : SSH : CPU Instruction Sets : SPARC systems 1987-2006 : Norton Commander : Norton Utilities : Norton Ghost : Frontpage history : Malware Defense History : GNU Screen : OSS early history
Classic books:
The Peter Principle : Parkinson Law : 1984 : The Mythical Man-Month : How to Solve It by George Polya : The Art of Computer Programming : The Elements of Programming Style : The Unix Hater’s Handbook : The Jargon file : The True Believer : Programming Pearls : The Good Soldier Svejk : The Power Elite
Most popular humor pages:
Manifest of the Softpanorama IT Slacker Society : Ten Commandments of the IT Slackers Society : Computer Humor Collection : BSD Logo Story : The Cuckoo's Egg : IT Slang : C++ Humor : ARE YOU A BBS ADDICT? : The Perl Purity Test : Object oriented programmers of all nations : Financial Humor : Financial Humor Bulletin, 2008 : Financial Humor Bulletin, 2010 : The Most Comprehensive Collection of Editor-related Humor : Programming Language Humor : Goldman Sachs related humor : Greenspan humor : C Humor : Scripting Humor : Real Programmers Humor : Web Humor : GPL-related Humor : OFM Humor : Politically Incorrect Humor : IDS Humor : "Linux Sucks" Humor : Russian Musical Humor : Best Russian Programmer Humor : Microsoft plans to buy Catholic Church : Richard Stallman Related Humor : Admin Humor : Perl-related Humor : Linus Torvalds Related humor : PseudoScience Related Humor : Networking Humor : Shell Humor : Financial Humor Bulletin, 2011 : Financial Humor Bulletin, 2012 : Financial Humor Bulletin, 2013 : Java Humor : Software Engineering Humor : Sun Solaris Related Humor : Education Humor : IBM Humor : Assembler-related Humor : VIM Humor : Computer Viruses Humor : Bright tomorrow is rescheduled to a day after tomorrow : Classic Computer Humor
The Last but not Least Technology is dominated by two types of people: those who understand what they do not manage and those who manage what they do not understand ~Archibald Putt. Ph.D
Copyright © 1996-2021 by Softpanorama Society. www.softpanorama.org was initially created as a service to the (now defunct) UN Sustainable Development Networking Programme (SDNP) without any remuneration. This document is an industrial compilation designed and created exclusively for educational use and is distributed under the Softpanorama Content License. Original materials copyright belong to respective owners. Quotes are made for educational purposes only in compliance with the fair use doctrine.
FAIR USE NOTICE This site contains copyrighted material the use of which has not always been specifically authorized by the copyright owner. We are making such material available to advance understanding of computer science, IT technology, economic, scientific, and social issues. We believe this constitutes a 'fair use' of any such copyrighted material as provided by section 107 of the US Copyright Law according to which such material can be distributed without profit exclusively for research and educational purposes.
This is a Spartan WHYFF (We Help You For Free) site written by people for whom English is not a native language. Grammar and spelling errors should be expected. The site contain some broken links as it develops like a living tree...
|
|
You can use PayPal to to buy a cup of coffee for authors of this site |
Disclaimer:
The statements, views and opinions presented on this web page are those of the author (or referenced source) and are not endorsed by, nor do they necessarily reflect, the opinions of the Softpanorama society. We do not warrant the correctness of the information provided or its fitness for any purpose. The site uses AdSense so you need to be aware of Google privacy policy. You you do not want to be tracked by Google please disable Javascript for this site. This site is perfectly usable without Javascript.
Last modified: March 12, 2019
If you are working with Solaris 10 or later systems, you should always run svcs -x to see which services are not running, It will even provide you log locations to see if the bad event that caused any problems left info about the failure.
svc:/application/print/server:default (LP print server)
State: disabled since Wed Jul 11 08:11:44 2007
Reason: Disabled by an administrator.
See: http://sun.com/msg/SMF-8000-05
See: lpsched(1M)
Impact: 1 dependent service is not running. (Use -v for list.)