|
|
Home | Switchboard | Unix Administration | Red Hat | TCP/IP Networks | Neoliberalism | Toxic Managers |
| (slightly skeptical) Educational society promoting "Back to basics" movement against IT overcomplexity and bastardization of classic Unix | |||||||
|
|
To restart framework use odadmin command:
odadmin shudtdown all && odadmin start all
See General troubleshooting procedure for details. the folllowing are typical steps:
|
|
Step 1: Get the output of the following three commands
- odadmin environ get
- odadmin odinfo
- odadmin odlist -- Lists the managed nodes in a Tivoli region and configures different aspects of how the object dispatcher communicates, such as defining IP addresses and interconnected regions.
Step 2: Check the value of flags in odadmin odlist: they should be "ct- " :
# odadmin odlist
Region Disp Flags Port IPaddr Hostname(s)
1034227612 1 ct- 94 10.201.13.227 nti2171...
- The key here is the value of flags: they should be "ct- "
Step 3: run:
odstat -c
The three most commonly used command when troubleshooting framework are:
for example odadmin help shutdown
You can execute the odadmin command without parameters and it will output information about the local object dispatcher. The key here is the value of flags: they should be "ct- "
# odadmin odlist
Region Disp Flags Port IPaddr Hostname(s)
1034227612 1 ct- 94 10.201.13.227 nti2171...
The key here is the value of flags: they should be
"ct- "
The next step is to analyze logs which can be found in the database directory (locatable via $DBDIR):
Note: On each TMA endpoint, there is also a logfile in the /lcf/dat/1 path -- lcfd.log.
Important: When start troubleshooting ensure that you source your Tivoli environment
The second thing is to go to $DBDIR. first check if there are too many files in this directory
# ls | wc -l
Look at odb.log -- it should "pulse" from zero to some value:
odb.log -- transactions that TMR server should do next
-rw------- 1 root sys 8362 Nov 18 16:37 odb.log
There are also a couple of commands to review and modify transaction status:
- tmcmd
- Forces a specified transaction or subtransaction to a particular state.
- tmstat
- Displays the status of current transactions and locks.
If y gathering information for support, use this list of steps whenever you begin to troubleshoot your Tivoli environment.
To assess the situation and re-create the problem, follow these steps:
- To obtain information about the connected managed nodes, enter the following command:
odadmin odlistThe output shows you the status of the managed node, its IP address, the port, and the alias for the host name. It also includes flags which indicate the status of the node in the Tivoli environment. For more information about the odadmin command and odlist option, see Listing active managed nodes.
- To obtain information on the local object dispatcher, including port range restrictions, enter the following command:
odadminFor more information about the odadmin command, , see Viewing data for a Tivoli region.
- Determine the method environment that the object dispatcher is using. The method environment is the environment variables that are set inside the process of the method when the method executes. To determine the method environment that the object dispatcher is using, enter the following command:
odadmin environ get- To determine which machine is causing the problem, run the odstat command, and then review the parent thread IDs in the output and examine suspect machines. The parent thread ID is the dispatcher number of the machines within the Tivoli region. For more information about the odstat command, see Listing the Status of Current and Recent Object Calls.
To gather data from each machine where you suspect there are problems, follow these steps:
- Log on as administrator or as a Tivoli administrator. This helps ensure you are not experiencing authority problems.
- To enable tracing for error conditions on the current object dispatcher, enter the following command:
odadmin trace errors- To enable tracing for all object calls on the current object dispatcher, enter the following command:
odadmin trace objcalls- To enable tracing for object service calls on the current object dispatcher, enter the following command:
odadmin trace services- Re-create the problem.
To assess the situation on the Tivoli region, follow these steps:
- To see what operations the object dispatcher is currently running, enter the following command:
odstat -cNoteTo obtain process IDs, use the odstat -cv command.
- Enter the following command:
odstat >odstat.txt- To flush the database files for the current object dispatcher, enter the following command:
odadmin db_sync- To collect information to debug methods, enter the following command:
wtrace -jHk $DBDIR >wtrace.txt- Collect the text files from steps 2 and 3, the oservlog file, and any useful system logs to use in analyzing the problems.
- To revert to the default of only logging errors, enter the following command:
odadmin trace errorsTo analyze the output from these steps, see the logs and commands described in the following sections. For detailed command descriptions, see the Tivoli Management Framework Reference Manual.
Tivoli Management Framework provides several logs that are generated in response to system activities and resources in the Tivoli environment. By viewing these logs, you can begin to identify when, where, and why certain problems are occurring. These logs can help you pinpoint if there is a problem in the Tivoli environment, if the operating system is causing problems, or if there is a user error. These logs can provide a large amount of detail including listing each method called by applications in your Tivoli environment. Logs include the following data:
These logs can be found in the database directory that is located through the following variable names:
Tivoli Management Framework provides these log files (grouped in categories):
During installations, Tivoli performs default logging in the following locations:
For more installation information, see the Tivoli Enterprise Installation Guide.
Some log files are reset each time the process is restarted; other log files have information appended to them and can grow indefinitely. Therefore, monitor these log files for growth and truncate or archive them on a regular basis. When truncating or archiving log files, you should shut down the process that is writing to the log file, move or rename the log file, and then restart the process. The process will create a new log file when it starts. By moving or renaming the log file, you can delete or archive the file at a later time. Examples of log files that log indefinitely are: epmgrlog, gatelog, and oservlog.
The following sections describe the Tivoli logs and the type of information contained within each log.
The epmgrlog file is a text file that records status information about the endpoint manager and transactions between the endpoint manager, gateway, and endpoint. You can find useful information in the epmgrlog file, such as endpoint login information and gateway assignments. Other types of information often found in this file include the following:
The epmgrlog file is located in the /db directory on the Tivoli server. This file grows indefinitely unless modified. Truncate the epmgrlog file regularly.
The gatelog file is a text file that records status information about the gateway and the transactions between the endpoint manager, gateway, and endpoint. The gatelog file is useful for debugging problems with endpoint login, distributions to endpoints, monitoring of endpoints, and other endpoint activities.
The gatelog file is located in the /db directory on the computer that hosts the gateway. This text file exists on any managed node that is defined as a gateway, including the Tivoli server.
The amount of information logged in this file depends on the logging level set by the wgateway set_debug_level command. For more information about how to set the logging level for the gatelog file, see the wgateway manual page. This file grows indefinitely unless modified. It is recommended that you truncate the gatelog file regularly.
The endpoint manager, notices, and object dispatchers use the gw_oid.log, notice.log, and odb.log files, respectively. Do not erase these binary transaction files because the files can contain transaction data. These three files enable you to roll back database transactions on the gwdb.bdb, notice.bdb, and odb.bdb database files in the event that a transaction failed or was stopped. They can increase in size while transactions are still pending, but after transactions are completed or committed, they should return to zero. For more information about transaction troubleshooting, see Displaying the Status of Current Transactions and Locks.
An odadmin db_sync command flushes the object database state, which should zero the log file. This synchronization process occurs automatically in the object dispatcher every three minutes.
You can use the logls command to output a readable version of a transaction log file. It is primarily a diagnostic tool for debugging the transaction manager and assists you by tailoring the information displayed from that file. Some of the command options provide the ability to view only log headers, to retrieve a maximum amount of data from the file, or to view only "old pages" log records.
Working with transactions is not a common problem determination technique, so the output will not be meaningful to you unless you are already familiar with Tivoli transactions.
The gw_oid.log file is located in the epmgr.bdb directory on the Tivoli server and a cached copy of the file resides on the gateways.
It is important to back up the odb.log file on a regular basis using the wbkupdb command. If this task is not performed, incomplete transactions will be left in the database, resulting in an inconsistent database on restore.
Attention:Do not modify Tivoli transactions as a routine method of problem determination. Altering transaction data can have serious and irreversible effects on the operation of a Tivoli region. It is recommended that you use this information to find out more about the status of the Tivoli region and to use other methods to attempt to rectify problems.
The odtrace.log file is composed of a log of object dispatcher errors, object method invocations, and object dispatcher services. To set the maximum size of the odtrace.log file, use the oserv -t command. In addition, it is important to note that the odtrace.log file cannot be read by normal editors; it is parsed by the wtrace command. For more information about the odtrace.log file, see Retrieving Information to Debug Methods.
Each object dispatcher process maintains an error log that is located in the Tivoli database directory. The oservlog file provides information about the object dispatcher, such as when it started, when it shut down, and what error and information messages were displayed.
Some entries in the oservlog file are passed to syslogd (the system log facility). You can use the syslogd command to collect oservlog messages from different systems and store the messages in a single location. You also can use the syslogd command to filter messages below a specified priority level. The object dispatcher service uses the syslog facility. Refer to the syslogd and syslog.conf manual pages for information about how to collect and filter oservlog messages.
You can use the oservlog file to help locate errors. Some entries in the oservlog file are time stamped. If an error occurs, you should look for an error message with a time stamp close to the time the error occurred.
NoteWindows operating systems do not have a syslog facility. For Tivoli Management Framework, you must read the object dispatcher error log from the oservlog file.
You can use the syslogd command to redirect messages of a specified severity to terminals or files that you set up. The object dispatcher is used when updating the syslog file.
The oservlog file uses the following symbols:
In addition to these errors, the object dispatcher shutdown messages are also forwarded to the syslog file.
The oservlog file grows indefinitely unless modified. Truncate the oservlog file regularly.
NoteFor descriptions of common oservlog error messages, see Tivoli Object Dispatcher (oserv).
The lcfd.log file is located in the /Tivoli/lcf/dat/1 directory on the computer that hosts the endpoint. This file contains information about endpoint logins and any upcall or downcall methods to or from the gateway. The amount of data recorded depends on the logging or debug level. The lcfd.log file grows until the endpoint daemon is restarted, at which point the information stored in the lcfd.log file overwrites existing information in the lcfd.bk file, and a new lcfd.log file is created.
The following information is recorded in the lcfd.log file:
You can change the debug level during startup of the endpoint with the lcfd -d option. For more information about the lcfd command, see the Tivoli Management Framework Reference Manual.
Tivoli has complex, very convoluted directory structure with path to some components so deeply nested in a maze of directories that this depth nesting itself defies any developer logic and might suggest problems with architectural thinking within IBM. Also internal are not documented and that creates a lot of confusion and actually negative affect IBM ability to sell the product as troubleshooting is very complex indeed. The good thing is that TMF 4.1.1 and TEC 3.9 with latest fixpack are reasonably stable and such need does not arise often.
In problem-solving situations, you need to understand what are the major processes involved if Tivoli Framework the interactions of the product components, how to interpret messages and trace output, and what actions you can take to resolve a problem. The key IBM publication for this topic is Tivoli Management Framework Maintenance and Troubleshooting Guide and most of material on this page is adapted from it.
The first thing in troubleshooting any complex system and Tivoli a very complex system is to have baseline and backup. Among baselines that are useful the first and most important is the map of all tivoli processes that are running on the server.
UID PID PPID C STIME TTY TIME CMD
root 438 1 0 Feb 15 ? 0:08 /opt/tivoli/TMF/bin/solaris2/bin/oserv -p 94 -k /opt/tivoli/TMF/db/nti246.db
root 441 438 0 Feb 15 ? 3:25 /TMF/LCF/gateway
root 377 1 0 Feb 15 ? 0:00 /usr/lib/im/htt -port 9010 -syslog -message_locale C
root 414 410 0 Feb 15 ? 0:00 mibiisa -r -p 32842
root 440 438 0 Feb 15 ? 0:00 /TMF/LCF/ep_mgr
root 425 1 0 Feb 15 ? 0:00 /usr/lib/dmi/snmpXdmid -s nti246
nobody 442 438 0 Feb 15 ? 0:00 TMF_sched
db2inst1 662 536 0 Feb 15 ? 0:00 db2sysc
root 444 438 0 Feb 15 ? 0:00 tec_server
root 445 1 0 Feb 15 ? 0:44 /opt/tivoli/lcf/bin/solaris2/mrt/lcfd
nobody 590 438 0 Feb 15 ? 0:00 RIM_DB2_prog
nobody 482 438 0 Feb 15 ? 0:00 rptm
root 488 1 0 Feb 15 ? 4:47 /opt/IBM/db2/V8.1/bin/db2fmcd
db2inst1 532 531 0 Feb 15 ? 0:01 db2sysc
root 626 444 0 Feb 15 ? 10:34 tec_dispatch -config /opt/tivoli/TMF/bin/solaris2/TME/TEC/.tec_config
root 483 1 0 Feb 15 ? 0:00 /bin/sh /opt/tivoli/lcf/bin/solaris2/TME/TEC/adapters/bin/init.tecad_logfile st
root 527 477 0 Feb 15 ? 0:00 dtgreet -display :0
root 531 1 0 Feb 15 ? 0:00 db2sysc
db2inst1 654 536 0 Feb 15 ? 0:00 db2sysc
root 625 444 0 Feb 15 ? 28:46 tec_rule -config /opt/tivoli/TMF/bin/solaris2/TME/TEC/.tec_config
root 510 483 1 Feb 15 ? 156:35 bin/tecad_logfile -n -c /opt/tivoli/lcf/dat/1/../../bin/solaris2/TME/TEC/adapte
root 627 444 0 Feb 15 ? 6:42 tec_reception -config /opt/tivoli/TMF/bin/solaris2/TME/TEC/.tec_config
db2inst1 592 538 0 Feb 15 ? 0:14 db2sysc
root 533 532 0 Feb 15 ? 0:00 db2sysc
... ... ...
db2inst1 537 532 0 Feb 15 ? 0:00 db2sysc
... ... ...
dasusr1 574 1 0 Feb 15 ? 0:00 /export/home/dasusr1/das/adm/db2dasrrm
dasusr1 562 1 0 Feb 15 ? 0:00 /export/home/dasusr1/das/bin/db2fmd -i dasusr1 -m /export/home/dasusr1/das/lib/
nobody 629 590 0 Feb 15 ? 0:05 RIM_DB2_Agent
root 628 444 0 Feb 15 ? 0:35 tec_task -config /opt/tivoli/TMF/bin/solaris2/TME/TEC/.tec_config
nobody 668 590 0 Feb 15 ? 2:29 RIM_DB2_Agent
nobody 26061 438 0 Apr 05 ? 0:01 tec_ui_server
root 1025 438 0 Feb 15 ? 0:04 tec_gateway
The key process is /opt/tivoli/TMF/bin/solaris2/bin/oserv All Managed Nodes run the oserv daemon which coordinates communication between systems within the Tivoli environment. The oserv daemon is from old days when CORBA was popular and is an implementation of a CORBA compliant Object Request Broker (ORB).
Tivoli Framework provides a number of log files and tracing utilities that help to determine the source of problems. See Using log files
Among other relevant topics from Tivoli Management Framework Maintenance and Troubleshooting Guide are
Key commands:
# wep help
wep [help [subcommand]] Get general or subcommand help messages
wep ls [-i <info>][-d <del>][-g <gw_label>] Lists endpoints
wep sync_gateways Sync gateways with the Endpoint Manager
wep <label> Show ep info for endpoint named <label>
wep <label> set field value Sets endpoint data
wep <label> get <info> [-d <del>] Displays endpoint data
wep <label> migrate [-f] <gw_label> Migrate endpoint to gateway
wep migrate_to_pref [-f] {-d|-a|-n} [-m <max>] [-g <gw_label>]
Migrate endpoints to their preferred gateways
Advanced Commands:
wep boot_method add <tag> <prototype_object> <method_name> <endpoint_object...>
wep boot_method list <tag> <endpoint_object>
wep boot_method remove <tag> <endpoint_object...>
wep boot_method test <tag> <endpoint_object>
wep del <ep_oid> <gw_label> Low level delete CAREFUL!
wep view <ep_oid> <gw_label> Low level display ep info
Rescue Commands: (These commands contact the endpoint)
wep <label> status
wep set gateway {-g <gw_label> | -e <ep_label>}
wep set interfaces {-g <gw_label> | -e <ep_label>} interfaces
wep <label> set_label [-s] <new_label> Changes the label of an endpoint
wep <label> set_config field=value Changes endpoint configuration parameter
When you install TFM on UNIX, huge maze of directories populated with strange files are created. Also some existing files are modified, and several system variables are defined.
Among created directories is the /tmp/.tivoli directory. It contains files that are used by the object dispatcher process. Do not delete this directory or any of its contents unless explicitly directed to by IBM support (On Solaris the directory will be cleaned on reboot automatically as /tmp is mapped into memory). Disk clean-up jobs should not remove this directory or its contents.
The TFM installation process installs the convoluted maze of directories that contain:
You can install these directories in the root directory (/) or in an installation directory that you create. These files are installed in the directories shown in the following figure.
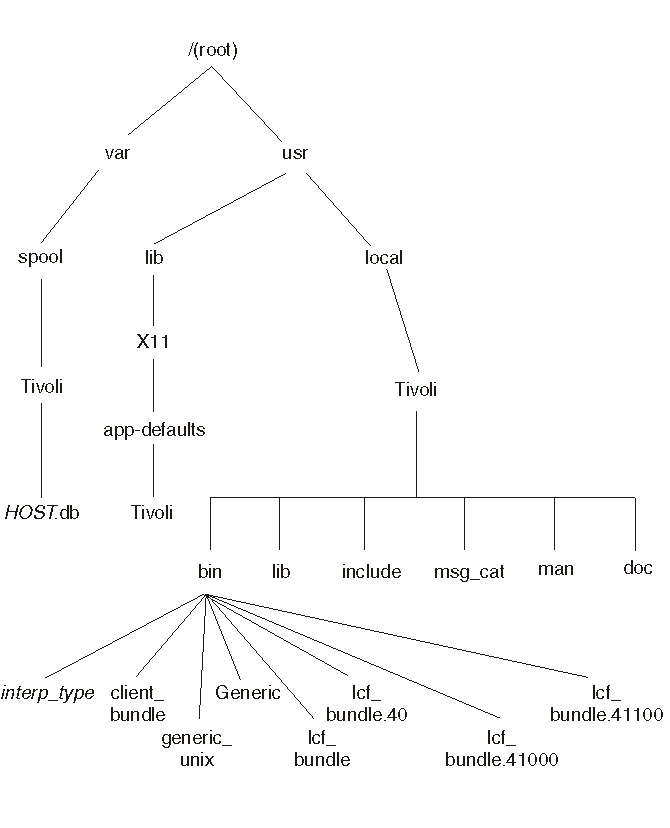
The Tivoli environment setup files are created in the /etc/Tivoli directory. This directory contains the following subdirectories:
The following files are created during installation in the /etc/Tivoli directory:
The following system startup files are added or modified during the installation of a UNIX managed node or Tivoli server.
| Operating system | Files modified |
|---|---|
| AIX | /etc/rc.nfs /etc/services /etc/inetd.conf |
| HP-UX | /sbin/rc0.d/K100Tivoli /sbin/rc1.d/K100Tivoli /sbin/rc2.d/K100Tivoli /sbin/rc3.d/S500Tivoli |
| Solaris | /etc/init.d/Tivoli /etc/rc3.d/S99Tivoli /etc/rc2.d/K50Tivoli /etc/rc0.d/K50Tivoli /etc/rc1.d/K50Tivoli /etc/services /etc/inetd.conf |
| SuSE Linux | /etc/rc.d/rc2.d/S99Tivoli /etc/rc.d/rc3.d/S99Tivoli /etc/rc.d/rc4.d/S99Tivoli /etc/rc.d/rc5.d/S99Tivoli /etc/rc.d/rc2.d/K10Tivoli /etc/rc.d/rc3.d/K10Tivoli /etc/rc.d/rc4.d/K10Tivoli /etc/rc.d/rc5.d/K10Tivoli |
| Other types of Linux | /etc/rc.d/rc2.d/S99Tivoli /etc/rc.d/rc3.d/S99Tivoli /etc/rc.d/rc4.d/S99Tivoli /etc/rc.d/rc5.d/S99Tivoli /etc/rc.d/rc0.d/K10Tivoli /etc/rc.d/rc1.d/K10Tivoli /etc/rc.d/rc6.d/K10Tivoli |
The following system variables are set when you run either of the setup scripts contained in the /etc/Tivoli directory. If you have previously set system variables, the Tivoli setup program overrides these variables: BINDIR, DBDIR, INTERP, LIBDIR, o_dispatch, EtcTivoli, TMR, and WLOCALHOST. For LD_LIBRARY_PATH, LIBPATH, SHLIB_PATH, MANPATH, NLSPATH, and PATH, the Tivoli settings are added to your existing variable.
| System variable | Default setting |
|---|---|
| BINDIR | /usr/local/tivoli/bin/interp_type |
| DBDIR | /var/spool/tivoli/host.db |
| INTER | interp_type
Refer to the TFM Release Notes for a complete list of interpreter types. |
LD_LIBRARY_PATH LIBPATH (AIX only) SHLIB_PATH (HP-UX only) |
"$LIBDIR":/usr/lib:/usr/ucblib |
| LIBDIR | /usr/local/tivoli/lib/interp_type |
| MANPATH | /usr/local/tivoli/man/interp_type:$MANPATH |
| NLSPATH | /usr/local/tivoli/msg_cat/%L/%N.cat |
| PATH | "$BINDIR/bin:$BINDIR/ADE:$BINDIR/AEF :$BINDIR/kerberos:$PATH" |
| XKEYSYMDB | /usr/lib/X11/XKeysymDB |
| XUSERFILESEARCHPATH | /usr/lib/X11/app-defaults/%L/%N.cat |
| o_dispatch | 94 |
| TISDIR | $BINDIR/../generic |
| TMR | region_number |
| WLOCALHOST | Host name to listen on |
Audience: Level 2 & 3 Support, Services, GTS, ITD, GBS, Business Partners, Sales, or Customers Abstract: This STE will cover: - Operating System Tuning - Network Tuning - Tivoli Tuning - Endpoint Communication Reliability - Gateway Log Messages - Endpoint Log Messages Presented by: Linda E. Miller-Plumley Date: August 4, 2009 11:00 AM Eastern US
Tivoli Management Framework provides commands to help you in troubleshooting systems. The most commonly used commands are as follows:
- odadmin
- Lists the managed nodes in a Tivoli region and configures different aspects of how the object dispatcher communicates, such as defining IP addresses and interconnected regions.
- odstat
- Lists currently running methods and method histories.
- wtrace
- Parses the odtrace.log file, which is created when tracing object calls, services, or errors (tracing is invoked with odadmin trace options).
Also described in this chapter are the commands to review and modify transaction status:
- tmcmd
- Forces a specified transaction or subtransaction to a particular state.
- tmstat
- Displays the status of current transactions and locks.
The odadmin command is the object dispatcher administration interface. This command provides configuration information about the server and allows you to change this information.
The following table provides the context and authorization roles required for this command:
Activity Context Required Role View and change configuration information about the object dispatcher. Tivoli region super, senior For information about how to use the odadmin command to start and stop the object dispatcher, see Stopping and starting the object dispatcher. For more information about the odadmin command, see the Tivoli Management Framework Reference Manual.
If you enter the odadmin command without options, output similar to the following is displayed for the local object dispatcher:
Region = 1264987995
Dispatcher = 1
Interpreter type = w32-ix86
Database directory = C:\Tivoli\db\aliburdi.db
Install directory = C:\Tivoli\bin
Inter-dispatcher encryption level = simple
Kerberos in use = FALSE
Remote client login allowed = TRUE
Force socket bind to a single address = FALSE
Perform local hostname lookup for IOM connections = FALSE
Use Single Port BDT = FALSE
Use communication channel check = FALSE
Communication check timeout = default (180 secs)
Communication check response timeout = default (180 secs)
Oserv connection validation timeout = 0
Port range = (not restricted)
State flags in use = TRUE
State checking in use = TRUE
State checking every 180 seconds
Dynamic IP addressing allowed = FALSE
Transaction manager will retry messages 4 times.
For a description of odadmin output, see Viewing data for a Tivoli region.
For obtaining information about connected managed nodes, you can use the odadmin odlist command. This command shows you the status of the managed node, its IP address, the port, and the host name alias. The odadmin odlist command also includes values indicating the status of its Tivoli region connection. For more information about the odadmin command and odlist option, see Listing active managed nodes.
Tivoli Management Framework provides the odstat command, which displays the currently running operations and the previous 200 operations for a specific managed node. Your support provider might ask you to run this command and send its output to assist in problem diagnosis. You can use the wtrace command to retrieve all data contained within an odstat output. Using the odstat command, however, is a much more explicit way to view this data. Use the wtrace output when you understand what is going on through examining the odstat output.
The following is an example output of the odstat command:
tid type ptid state std O std E start err Method 2
O+
bhdoq
run 0 0
Tue
11:57
1366474158.1.158#TMF Scheduler:: scheduler#start 3
O
+bhdoqs
run 0 0
Tue
11:57
1366474158.1.508#TMF_LCF::EpMgr#epmgr_boot 6
O+
bhdoqs
run 0 0
Tue
11:57
1366474158.1.583#TMF_Gateway::Gateway #gateway_boot 51
O+
hdoqs
run 0 0
Fri
11:41
1366474158.1.528#TMF_UI::Extnd_Desktop#uiserver 54
O+
hdoq
1-51 run 0 0 13:18:04 1366474158.1.179#TMF_Administrator:: Configuration_GUI#launch 167
O+
hdoq
1-51 run 0 0 13:18:06 1366474158.1.196#TMF_PolicyRegion::GUI#launch 307
O+
hdoqs
run 0 0 13:19:47 1366474158.1.643#TMF_UI::Extnd_Desktop#uiserver 310
O+
hdoq
1-307 run 0 0 13:20:08 1366474158.1.641#TMF_Administrator:: Configuration_GUI#launch 400
O+
hdoq
1-51 run 0 0 13:20:10 1366474158.1.644#TMF_CCMS:: ProfileManager#launch 410 O+ run 0 0 13:22:32 1366474158.1.2#query odstat The output contains the following information:
- tid
- Specifies the thread ID. When you start an object call, two threads are generated: one for the object call itself and one for the method being invoked.
- type
- Lists the thread type. The thread type flags include the following:
- O
- Object call thread (attached to an object request), indicating that the method was invoked here but is running elsewhere.
- M
- Method thread. The object call occurred on a different system, but the object is located on the local system.
- O+
- Object call and method threads are the same, indicating that the caller and method are both local.
Method type flags include the following:
- a
- Asynchronous object call
- q
- Queueing method
- o
- Per-object method
- b
- One-way object call
- h
- Helperless method
- d
- Daemon method
- ptid
- Lists the parent thread ID or the thread ID of the object call whose method made the current object call. If this field is blank, the object call is external. The number before the dash (-) is the dispatcher number where the parent thread resides. The number after the dash is the thread ID in the parent object dispatcher.
- state
- Lists the following states of the object call thread:
- init
- The thread has been initialized.
- ali
- The thread is performing a lookup on the Tivoli server object database.
- mwait
- The thread is waiting for the associated method thread to complete.
- rwait
- The thread is waiting for the caller to collect the results of an asynchronous object call.
- done
- The object call is complete.
- coord
- The method is serving as a transaction coordinator.
- err
- An internal error terminated the thread.
Method thread states include the following:
- init
- The thread has been initialized.
- gmeth
- The thread is obtaining the method code from another object dispatcher.
- hdwt
- The thread is waiting for the daemon-method process (the nonqueueing daemon) to be ready to accept another request.
- run
- The method is running.
- serv
- The thread is performing an object services call.
- done
- The method is complete.
- twait
- The method is waiting on transaction status to commit or abort.
- std O
- Lists the number of bytes written to standard output.
- std E
- Lists the number of bytes written to standard error by the method. Most threads do not write to standard error.
- start
- Lists the time that the thread started. Entries can be one of the following depending on the age of the thread:
- Time-The thread started on this day.
- Day and Time-The thread started before this day, but within in the current week.
- Month and day (UNIX operating systems only)-The thread started before the current week.
- Month (Windows operating systems only)-The thread started before the current week.
- err
- Lists the error status of the thread. If this field is blank, no error occurred.
Error types include the following:
- e=n
- The method returned n as its exit code. Error codes 0 through 21 are reserved for system-defined errors. Tivoli error codes start with 22.
- s=n
- The method failed due to signal n.
- S=n
- The method failed due to signal n and produced a core file. Contact your support provider if you want to debug using this core file.
- XXX
- An uppercase word indicates an error in the object dispatcher.
Exit codes (e=) can come from the system on which the Tivoli desktop is running, Tivoli Management Framework, or an application. It might be necessary to look at different sets of error documentation to find out which is the most likely source. You might be able to use system documentation to obtain help regarding system-produced errors. Most UNIX operating systems include an error file that lists the system error codes and often a short description. On OS/2 operating systems, enter help n, where n is the number of the error message (for example, help 5). On Windows operating systems, enter the net helpmsg n command (for example, net helpmsg 5).
- method
- Lists the text of the method invocation. The first value is the object ID of the object in which context the method was invoked. The format is either three numbers separated by periods or three numbers separated by periods followed by a pound sign (#), the class name, and another pound sign. The next entry is the name of the method followed by its options.
The following is an example of a method listed in the odstat output.
1242184237.1.516#TMF_SysAdmin::InstanceManager# _get_interfacesAny action that you perform can generate several methods. Use the thread and parent thread ID relationship to determine the order in which the methods started. This is important because the Tivoli environment is multitasking and several administrators might be performing tasks from several different locations. Looking at the thread IDs helps you determine which processes are yours and where an error occurred. When tracking errors, read the odstat file from the bottom to the top and use the thread and parent thread IDs to determine which action caused the problem.
The odstat output is listed by order of time and thread. Only the first 80 characters of the method invocation are displayed. IDL-generated method options are not viewable with odstat. For more information about IDL-generated methods, see the wtrace command in the Tivoli Management Framework Reference Manual.
Tivoli Management Framework supports an object tracing mode that records in a log file either all operations or only those that fail. You can use this file later to diagnose problems. This file provides very detailed information and should be used in conjunction with an odstat listing. You can find an error in an odstat listing and use the thread ID associated with it to find additional information in a wtrace file.
The wtrace command reads the file in the database directory, called odtrace.log, that was generated by the object dispatcher. This file is static and 1 MB in size. It resides in the Tivoli database directory $DBDIR (%DBDIR% for Windows or OS/2). You can use the -t option on the oserv command to change the trace file size. However, you must manually start the object dispatcher to specify this option.
Information is written to the odtrace.log file and parsed with the wtrace command. This is important to remember because, unlike the odstat command, the wtrace command can provide debugging information if the object dispatcher is down or has been recycled.
Use the wtrace command to interpret trace log records and print the interpreted information in a user-friendly format. The trace log is a circular buffer that contains (by default) the last 512 trace records. A trace record can be either an operation request or an error from an operation request. Your support provider might ask you to enable tracing or print the trace output and send it to assist in problem diagnosis.
The wtrace output contains everything that is also found in odstat output; however, it is quite detailed and can be hard to read. Having corresponding odstat output can make reading the wtrace output much easier. For more information, see Listing the Status of Current and Recent Object Calls.
By default, only errors are saved in the odtrace.log file. If you want to save more tracing information, use the odadmin trace command with either the objcalls or services option. Tracing all object operations and services reduces the performance of the Tivoli service. Only enable such tracing for limited periods of time as you troubleshoot systems.
The rate at which odadmin data is written to the file depends on the the trace level of the object dispatcher. Various types of methods can be tracked by the object dispatcher in the trace set with the odadmin trace command:
- errors
- Records errors in the oservlog file. This is the default setting.
- objcalls
- Usual setting to use for problem determination. Traces object method invocation.
- services
- Tracks authentication, location, and inheritance (ALI) services requested of the Tivoli server. This tracking quickly fills a trace file.
If you are having problems that are not easily resolved by the messages Tivoli Management Framework provides, follow these steps:
Note
- To set the tracing option, use the following options (in the following order):
- odadmin trace errors: Turns on error tracing (recommended).
- odadmin trace objcalls: Turns on object call tracing (recommended).
- odadmin trace services: Turns on service tracing (optional).
- Run the odstat command. This helps separate the methods that are involved in the problem by inserting two object calls into the trace (as shown). After you are familiar with reviewing traces, you might want to skip this step and rely solely on finding process IDs or some other method.
355 O+ done 15 0 23:53:56 0.0.0 get_oserv 356 O+ done 2103 0 23:53:58 1480943038.1.2 query odstat- Re-create the problem.
- Enter the following command, where odstat_output is the name of the file containing output from the odstat command:
odstat -v> /path/odstat_output- Enter one of the following commands:
wtrace -jk $DBDIR > /path/wtrace_output
wtrace -jk $DBDIR >> odstat_output
Optionally, use -jHk if the trace mentions binary hex data to get the hex data output with an attempted ASCII translation.
- If needed, refer to the oservlog file.
- Turn off the trace with the following command:
odadmin trace off- Turn on the default tracing with the following command:
odadmin trace errors- Review the odstat_output file you created in step 4 and begin analyzing the output starting with the query odstat line, as illustrated in step 2.
After investigating a system, you should always return to tracing errors only. Leaving other tracing enabled has a negative performance impact. For example, each time a single method is invoked, an average of 3 to 5 service calls are made. This introduces an impact on the object dispatcher because the object dispatcher has to record each step.
The following scenario shows odstat and wtrace examples of a managed node subscription to a profile manager. For each record in the wtrace output, the first line contains the method thread ID, the thread and method flags, the parent thread ID, if one exists, and any error codes. Subsequent lines are similar to the rest of the data in an odstat output as shown. Also provided in the trace data is the name of the Tivoli principal that effectively called the method and the path of the method executable.
The odstat output includes the following:
347 O+ahdoq  1-342  done     9     0 23:53:50 \
     1480943038.1.348#TMF_ManagedNode::Managed_Node# add_subscription
The wtrace output includes the following:
loc-ic            347  M-hdoq    1-342      153
      Time run:    [Thu 01-Jun 23:53:50]
      Object ID:   1480943038.1.348#TMF_ManagedNode::Managed_Node#
      Method:      add_subscription
      Principal:   root@spot (0/60001)
      Path:        /solaris2/TAS/CCMS/profile_organizer
       Trans Id:
         {
           1480943038:1,1480943038:1,4:190
         },
         {
           1480943038:1,1480943038:1,4:192
         }
         #3
  Input Data: (encoded):
         {
           {
             {
               "1480943038.1.580#TMF_CCMS::ProfileManager#" "SwPacks"
             }
             "OBJECT_NIL" "" ""
           }
           0 false
           {
             0
           }
         }
In the wtrace output, you can find the type of data block being viewed. The loc line element refers to a local method. The rem line element refers to a remote method. These elements include the following type codes:
- ic
- Input object call
- is
- Input service call
- oc
- Output object call
- os
- Output service call
After you have set up tracing and generated the output, you might need to investigate a method listed in the output. To find a method, follow these steps:
- From the odstat output, identify the thread ID (tid) where the error occurred. For more information about thread IDs, see Listing the Status of Current and Recent Object Calls.
- Find the same thread ID in the wtrace output.
- Identify the method, input data, and results for that method.
- You can then identify the principal that ran the method, for example:
Principal: root@spot (0/60001)The first part is the user that ran the method, and the numbers in the parentheses are the user ID and group ID actually used to run the method.Note
For HP-UX systems, when the numbers in parentheses are less than 0, the method is run as nobody.- After you gain experience running this test, you can manually run the method by using the objcall or idlcall commands to reproduce the problem and run tests.
Note
Typically, you should use the objcall and idlcall commands only under the guidance of authorized support personnel. If you are going to invoke any methods manually, be sure to review the Tivoli Management Framework Planning for Deployment Guide and the Tivoli Management Framework Reference Manual.
Use the tmcmd command to force a specified transaction or subtransaction to a particular state. Your support provider might ask you to run the tmcmd command to assist in problem diagnosis. The tmcmd command is primarily useful when testing and debugging the transaction manager, which is linked inside the object dispatcher. Support might ask you to run this command to recover from a severe or unusual problem.
Attention:Run this command only with the direction and assistance of Customer Support, as this command can crash your object dispatcher or corrupt your database if used inappropriately.
If you are using Application Development Environment to create your own transactions, use the tmcmd command to force a specified transaction or subtransaction to a particular state.
You can examine current pending transactions, locks, and their states by using the tmstat command. Your support provider might ask you to run the tmstat command and send its output to assist in diagnosing problems.
Locks are used to ensure data consistency on a given resource. To determine if you have a process lock problem, you can monitor the odb.log file. If this file stays at a constant size or more importantly, consistently grows in size for no obvious reason, you could have a lock problem.
If you are gathering information for support, use this list of steps whenever you begin to troubleshoot your Tivoli environment.
To assess the situation and re-create the problem, follow these steps:
- To obtain information about the connected managed nodes, enter the following command:
odadmin odlistThe output shows you the status of the managed node, its IP address, the port, and the alias for the host name. It also includes flags which indicate the status of the node in the Tivoli environment. For more information about the odadmin command and odlist option, see Listing active managed nodes.
- To obtain information on the local object dispatcher, including port range restrictions, enter the following command:
odadminFor more information about the odadmin command, , see Viewing data for a Tivoli region.
- Determine the method environment that the object dispatcher is using. The method environment is the environment variables that are set inside the process of the method when the method executes. To determine the method environment that the object dispatcher is using, enter the following command:
odadmin environ get- To determine which machine is causing the problem, run the odstat command, and then review the parent thread IDs in the output and examine suspect machines. The parent thread ID is the dispatcher number of the machines within the Tivoli region. For more information about the odstat command, see Listing the Status of Current and Recent Object Calls.
To gather data from each machine where you suspect there are problems, follow these steps:
- Log on as administrator or as a Tivoli administrator. This helps ensure you are not experiencing authority problems.
- To enable tracing for error conditions on the current object dispatcher, enter the following command:
odadmin trace errors- To enable tracing for all object calls on the current object dispatcher, enter the following command:
odadmin trace objcalls- To enable tracing for object service calls on the current object dispatcher, enter the following command:
odadmin trace services- Re-create the problem.
To assess the situation on the Tivoli region, follow these steps:
- To see what operations the object dispatcher is currently running, enter the following command:
odstat -cNoteTo obtain process IDs, use the odstat -cv command.
- Enter the following command:
odstat >odstat.txt- To flush the database files for the current object dispatcher, enter the following command:
odadmin db_sync- To collect information to debug methods, enter the following command:
wtrace -jHk $DBDIR >wtrace.txt- Collect the text files from steps 2 and 3, the oservlog file, and any useful system logs to use in analyzing the problems.
- To revert to the default of only logging errors, enter the following command:
odadmin trace errorsTo analyze the output from these steps, see the logs and commands described in the following sections. For detailed command descriptions, see the Tivoli Management Framework Reference Manual.
This IBM Redbook is an update of the existing Tivoli Enterprise Internals and Problem Determination, SG24-2034 redbook. The material is revised and updated for TFM and applications post Version 3.6. Some of the applications that are covered from the troubleshooting point of view in this redbook are:
TFM and related concepts
Tivoli Enterprise Console
IBM Tivoli Monitoring
Tivoli Business Systems Manager
Tivoli Enterprise Data Warehouse
Tivoli Workload Scheduler
IBM Tivoli Configuration Manager
Tivoli Remote Control
IBM Tivoli Access Manager for Operating SystemsAnother subject that is associated with troubleshooting is proper maintenance of your Tivoli environment, because proper Tivoli maintenance procedures eliminate many potential Tivoli problems. In addition to the troubleshooting information, this redbook briefly touches on some best practices information for maintaining your Tivoli environment, mostly from the troubleshooting perspective.
Google matched content |
Troubleshooting Tivoli Using the Latest Features, SG24-6614-00
Redbooks, published 6 March 2003, last updated
24 October 2003, Rating:
 (based on 11 reviews)
When determining problems with the endpoint, it is important to remember that the endpoint operates in conjunction with two other components of the Tivoli environment: the endpoint manager and the gateway. Therefore, you need to assess the state of several TFM components when troubleshooting endpoints: the endpoint itself, the gateways it can connect to, and the endpoint manager that is on the Tivoli server.
This chapter contains the following sections:
Society
Groupthink : Two Party System as Polyarchy : Corruption of Regulators : Bureaucracies : Understanding Micromanagers and Control Freaks : Toxic Managers : Harvard Mafia : Diplomatic Communication : Surviving a Bad Performance Review : Insufficient Retirement Funds as Immanent Problem of Neoliberal Regime : PseudoScience : Who Rules America : Neoliberalism : The Iron Law of Oligarchy : Libertarian Philosophy
Quotes
War and Peace : Skeptical Finance : John Kenneth Galbraith :Talleyrand : Oscar Wilde : Otto Von Bismarck : Keynes : George Carlin : Skeptics : Propaganda : SE quotes : Language Design and Programming Quotes : Random IT-related quotes : Somerset Maugham : Marcus Aurelius : Kurt Vonnegut : Eric Hoffer : Winston Churchill : Napoleon Bonaparte : Ambrose Bierce : Bernard Shaw : Mark Twain Quotes
Bulletin:
Vol 25, No.12 (December, 2013) Rational Fools vs. Efficient Crooks The efficient markets hypothesis : Political Skeptic Bulletin, 2013 : Unemployment Bulletin, 2010 : Vol 23, No.10 (October, 2011) An observation about corporate security departments : Slightly Skeptical Euromaydan Chronicles, June 2014 : Greenspan legacy bulletin, 2008 : Vol 25, No.10 (October, 2013) Cryptolocker Trojan (Win32/Crilock.A) : Vol 25, No.08 (August, 2013) Cloud providers as intelligence collection hubs : Financial Humor Bulletin, 2010 : Inequality Bulletin, 2009 : Financial Humor Bulletin, 2008 : Copyleft Problems Bulletin, 2004 : Financial Humor Bulletin, 2011 : Energy Bulletin, 2010 : Malware Protection Bulletin, 2010 : Vol 26, No.1 (January, 2013) Object-Oriented Cult : Political Skeptic Bulletin, 2011 : Vol 23, No.11 (November, 2011) Softpanorama classification of sysadmin horror stories : Vol 25, No.05 (May, 2013) Corporate bullshit as a communication method : Vol 25, No.06 (June, 2013) A Note on the Relationship of Brooks Law and Conway Law
History:
Fifty glorious years (1950-2000): the triumph of the US computer engineering : Donald Knuth : TAoCP and its Influence of Computer Science : Richard Stallman : Linus Torvalds : Larry Wall : John K. Ousterhout : CTSS : Multix OS Unix History : Unix shell history : VI editor : History of pipes concept : Solaris : MS DOS : Programming Languages History : PL/1 : Simula 67 : C : History of GCC development : Scripting Languages : Perl history : OS History : Mail : DNS : SSH : CPU Instruction Sets : SPARC systems 1987-2006 : Norton Commander : Norton Utilities : Norton Ghost : Frontpage history : Malware Defense History : GNU Screen : OSS early history
Classic books:
The Peter Principle : Parkinson Law : 1984 : The Mythical Man-Month : How to Solve It by George Polya : The Art of Computer Programming : The Elements of Programming Style : The Unix Hater’s Handbook : The Jargon file : The True Believer : Programming Pearls : The Good Soldier Svejk : The Power Elite
Most popular humor pages:
Manifest of the Softpanorama IT Slacker Society : Ten Commandments of the IT Slackers Society : Computer Humor Collection : BSD Logo Story : The Cuckoo's Egg : IT Slang : C++ Humor : ARE YOU A BBS ADDICT? : The Perl Purity Test : Object oriented programmers of all nations : Financial Humor : Financial Humor Bulletin, 2008 : Financial Humor Bulletin, 2010 : The Most Comprehensive Collection of Editor-related Humor : Programming Language Humor : Goldman Sachs related humor : Greenspan humor : C Humor : Scripting Humor : Real Programmers Humor : Web Humor : GPL-related Humor : OFM Humor : Politically Incorrect Humor : IDS Humor : "Linux Sucks" Humor : Russian Musical Humor : Best Russian Programmer Humor : Microsoft plans to buy Catholic Church : Richard Stallman Related Humor : Admin Humor : Perl-related Humor : Linus Torvalds Related humor : PseudoScience Related Humor : Networking Humor : Shell Humor : Financial Humor Bulletin, 2011 : Financial Humor Bulletin, 2012 : Financial Humor Bulletin, 2013 : Java Humor : Software Engineering Humor : Sun Solaris Related Humor : Education Humor : IBM Humor : Assembler-related Humor : VIM Humor : Computer Viruses Humor : Bright tomorrow is rescheduled to a day after tomorrow : Classic Computer Humor
The Last but not Least Technology is dominated by two types of people: those who understand what they do not manage and those who manage what they do not understand ~Archibald Putt. Ph.D
Copyright © 1996-2021 by Softpanorama Society. www.softpanorama.org was initially created as a service to the (now defunct) UN Sustainable Development Networking Programme (SDNP) without any remuneration. This document is an industrial compilation designed and created exclusively for educational use and is distributed under the Softpanorama Content License. Original materials copyright belong to respective owners. Quotes are made for educational purposes only in compliance with the fair use doctrine.
FAIR USE NOTICE This site contains copyrighted material the use of which has not always been specifically authorized by the copyright owner. We are making such material available to advance understanding of computer science, IT technology, economic, scientific, and social issues. We believe this constitutes a 'fair use' of any such copyrighted material as provided by section 107 of the US Copyright Law according to which such material can be distributed without profit exclusively for research and educational purposes.
This is a Spartan WHYFF (We Help You For Free) site written by people for whom English is not a native language. Grammar and spelling errors should be expected. The site contain some broken links as it develops like a living tree...
|
|
You can use PayPal to to buy a cup of coffee for authors of this site |
Disclaimer:
The statements, views and opinions presented on this web page are those of the author (or referenced source) and are not endorsed by, nor do they necessarily reflect, the opinions of the Softpanorama society. We do not warrant the correctness of the information provided or its fitness for any purpose. The site uses AdSense so you need to be aware of Google privacy policy. You you do not want to be tracked by Google please disable Javascript for this site. This site is perfectly usable without Javascript.
Last modified: March 12, 2019