Linux Performance Tuning
You should be very careful in your optimization attempts, always measure the results "before" and
"after" and the main criteria is "not do any harm" rather then "achieve spectacular improvements".
Make a full backup of the system before introducing any significant optimization-related change.
You should be very careful in your optimization attempts, always
measure the results "before" and "after" and the main criteria is "not do any harm"
rather then "to achieve spectacular improvements".
Remember:
- The best performance first of all means avoiding blunders in installation and configuration.
In a way it comes from the unnecessary work you don't do.
- Much depends on the level of qualification of a particular DBA or system administrator.
- The higher the level qualification is, the more probable is that actions taken will have positive,
not negative effect.
- Excessive zeal is the main danger. Usually it backfires. The key to database tuning
is ability to objectively measure the performance. Good ideas without measurement of performance
in optimization space are often turn to be useless or even bad ideas.
| The best performance first of all means avoiding blunders in installation and configuration.
In a way it comes from the unnecessary work you don't do.
Much depends on the level of qualification of a particular DBA or system administrator.
The higher the level qualification is the more probably that actions taken will have
positive, not negative effect.
Excessive zeal is another danger. The key to database tuning is ability to objectively
measure the performance. Good ideas without measurement of performance in optimization space
are often turn to be useless or even bad ideas. |
There is no free lunch and the more optimized system is, the more specialized for a particular application
it became; as a result any changes in application can disproportionally affect performance. We can
categorized the effects of performance tuning (aka optimization) in two categories:
- Performance impact. Performance impact or benefit explains the level of potential performance
gain by performing a specific tuning action:
- Low: Single digits improvement
- Medium: Between 10% to 33% improvement
- High: 33% to 100% improvement
- Dramatic: Over 100% improvement. several time or order of magnitude performance improvement
- Risk. There is no free lunch and each tuning action entails some risk including the risk
that some tuning actions may actually degrade performance. The tuning risks can be categorized as:
- Zero This is not expected to cause any problems.
- Low Safe change to make
- Medium You need to check that the game is worth the candles
- High This can cause problems or even reduce performance in some cases different from
those you are optimizing. You are normally not expected to use these options since involve a
large risk to stability and stability is more important factor then performance. However, they
may be used if:
- You have tried everything else and performance is still inadequate.
- You fully understand what this tuning option do.
- You run the benchmark and see such a dramatic improvement of performance that justifies
the risk.
There are three major areas of optimization:
- Hardware optimization (there is a big difference is io performce of a local subsystem
which uses 15K RPM disks and dual channel controller 1 GB RAM cache with battery backup and 7200RPM
disks with primitive controller. The most basic optimization is selection of the system that has
higher transaction benchmark (TCP, for example
TCP-C). Solid state disks can make dramatic improvement if the database is mainly used for reading.
SAN are necessary for large databases (not only from performance standpoint, but also backup and
recovery standpoint).
- Operating system based optimization (generally requires careful measurements, for example
using D-trace on Solaris)
- Application level optimization . Here the most dramatic improvements are possible; that's
why open source applications can generally beat closed-source application; but understanding the
application on the level that makes possible its tuning is often limited by the brainpower available;
this is especially true for complex, off-the-shelf applications)
As we go down the list we generally can get higher returns on the efforts. But risks also generally
increase. Also not all application are open source so application level optimization if often limited
to the contains of the particular implementation.
|
The level of optimization available to the organization
usually are dependent of the qualification of the staff. The higher the qualification of staff
the more levels of optimization are available and the more is the potential return.
|
The best performance specialists are good at what they do for two basic reasons:
- They know internals of the OS. They are intimately familiar with the way that memory
is used, how the scheduler works, when and how cache comes into play and how I/O is managed. They
also understand the operations that underlie file systems and network communications. In other words,
the numbers are not simply numbers to them.
- They know how application they are benchmarking works. They have developed a "feel" for
how their systems normally perform and for how much performance varies. For those of us less well
equipped to turn numbers into insights, there are several tools that can facilitate the analysis
of what seems to be too much data.
One of the simplest performance monitoring
packages for linux is Sysstat which includes
sar
Here are major areas for tuning (adapted from
Server Oriented System Tuning
Info ):
Some of the default kernel parameters for system performance are geared more towards workstation performance
that file server/large disk I/O type of operations. For example, for
pure file server applications like web and samba servers, you probably want to disable the "atime" option
on the most used filesystem. This disabled updating the "atime" value for the
file, which indicates that the last time a file was accessed. Since this info isn't very useful in this
situation, and causes extra disk hits, its typically disabled. To do this, just edit /etc/fstab
and add "notime" as a mount option for the filesystem.
For example:
/dev/rd/c0d0p3 /test ext2 noatime 1 2
The disk i/o
elevators is another kernel tuneable that can be tweaked for improved disk i/o in some cases.
- For fast disk subsystems, it is desirable to use large flushes of dirty memory pages.
The value stored in /proc/sys/vm/dirty_background_ratio defines
at what percentage of main memory the pdflush daemon should
write data out to the disk.
If larger flushes are desired then increasing the default value of 10% to a larger value will
cause less frequent flushes.
As in the example above the value can be changed to 25 as shown in
# sysctl -w vm.dirty_background_ratio=25
- Another related setting in the virtual memory subsystem is the ratio at which dirty pages
created by application disk writes will be flushed out to disk.
The default value 10 means
that data will be written into system memory until the file system cache has a size of 10% of the
server’s RAM.
The ratio at which dirty pages are written to disk can be altered as follows to a setting of
20% of the system memory
# sysctl -w vm.dirty_ratio=20
See also TCP Performance TuningMost
benchmarks benefit heavily from making sure the NIC's that you use has a good chipset and is well supported,
with a well written driver. Examples include Intel NIC cards and Broadcom NIC cards.
Making sure the cards are running in full duplex mode is also very often critical to benchmark performance.
Depending on the networking hardware used, some of the cards may not autosense properly and may not
run full duplex by default.
Many cards include module options that among other things can be used to force the cards
into full duplex mode. Some examples for common cards include
alias eth0 eepro100
options eepro100 full_duplex=1
alias eth1 tulip
options tulip full_duplex=1
Though full duplex gives the best overall performance, I've seen some circumstances where setting
the cards to half duplex will actually increase thoughput, particularly in cases where the data flow
is heavily one sided.
For all other parameters, even if you think that your in a situation that change will improve performance,
I would suggest benchmarking the results. Many such changes recommended in the literature does
not give desired effect or worse decrease performance.
For servers that are serving up huge numbers of concurrent sessions, there are some TCP options that
should probably be enabled. With a large # of clients doing their best to kill the server, its probably
not uncommon for the server to have 20000 or more open sockets.
In order to optimize TCP performance for this situation, I would suggest tuning the following parameters.
echo 1024 65000 > /proc/sys/net/ipv4/ip_local_port_range
Allows more local ports to be available. Generally not a issue, but in a benchmarking scenario you often
need more ports available. A common example is clients running `ab` or `http_load` or similar software.
In the case of firewalls, or other servers doing NAT or masquerading, you may not be able to use
the full port range this way, because of the need for high ports for use in NAT.
Increasing the amount of memory associated with socket buffers can often improve performance. Things
like NFS in particular, or apache setups with large buffer configured can benefit from this.
echo 262143 > /proc/sys/net/core/rmem_max
echo 262143 > /proc/sys/net/core/rmem_default
This will increase the amount of memory available for socket input queues. The "wmem_*" values do the
same for output queues.
Note: With 2.4.x kernels, these values are supposed to "autotune" fairly well, and some people
suggest just instead changing the values in:
/proc/sys/net/ipv4/tcp_rmem
/proc/sys/net/ipv4/tcp_wmem
There are three values here, "min default max".
These reduce the amount of work the TCP stack has to do, so is often helpful in this situation.
echo 0 > /proc/sys/net/ipv4/tcp_sack
echo 0 > /proc/sys/net/ipv4/tcp_timestamps
SCSI tuning is highly dependent on the particular scsi cards and drives in questions. The most effective
variable when it comes to SCSI card performance is tagged command queuing.
You probably want to check the driver documentation for your particular scsi modules for more info.
For example, the Adaptec aic7xxx series cards (2940's, 7890's, *160's, etc) this can be enabled with
a module option like:
aic7xx=tag_info:{{0,0,0,0,}}
This enabled the default tagged command queuing on the first device, on the first 4 scsi ids.
options aic7xxxaic7xxx=tag_info:{{24.24.24.24.24.24}}
in /etc/modules.conf will set the TCQ depth to 24
See also NFS performance
tuning
But the basic tuning steps include:
Try using NFSv3 if you are currently using NFSv2. There
can be very significant performance increases with this change.
Increasing the read write block size. This is done with the rsize and wsize mount options.
They need to the mount options used by the NFS clients. Values of 4096 and 8192 reportedly increase
performance. But see the notes in the HOWTO about experimenting and measuring the performance implications.
The limits on these are 8192 for NFSv2 and 32768 for NFSv3
Another approach is to increase the number of nfsd threads running. This is normally controlled by
the nfsd init script. On Red Hat Linux machines, the value "RPCNFSDCOUNT" in the nfs init script
controls this value. The best way to determine if you need this is to experiment. The HOWTO mentions
a way to determine thread usage, but that doesn't seem supported in all kernels.
Another good tool for getting some handle on NFS server performance is `nfsstat`. This util
reads the info in /proc/net/rpc/nfs[d] and displays it in a somewhat readable format. Some
info intended for tuning Solaris, but useful for it's description of the
nfsstat format
See also the tcp
tuning info
Make sure you starting several initial daemons if you want good benchmark scores.
Something like:
#######
MinSpareServers 20
MaxSpareServers 80
StartServers 32

# this can be higher if apache is recompiled
MaxClients 256

MaxRequestsPerChild 10000
Note: Starting a massive amount of httpd processes is really a benchmark hack. In most real world
cases, setting a high number for max servers, and a sane spare server setting will be more than adequate.
It's just the instant on load that benchmarks typically generate that the StartServers helps with.
The MaxRequestPerChild should be bumped up if you are sure that your httpd processes do
not leak memory. Setting this value to 0 will cause the processes to never reach a limit.
One of the best resources on tuning these values, especially for app servers, is the
mod_perl performance tuning
documentation.
Bumping the number of available httpd processes
Apache sets a maximum number of possible processes at compile time. It is set to 256 by default,
but in this kind of scenario, can often be exceeded.
To change this, you will need to change the hardcoded limit in the apache source code, and recompile
it. An example of the change is below:
--- apache_1.3.6/src/include/httpd.h.prezab     Fri Aug  6 20:11:14 1999
+++ apache_1.3.6/src/include/httpd.h    Fri Aug  6 20:12:50 1999
@@ -306,7 +306,7 @@
  * the overhead.
  */
 #ifndef HARD_SERVER_LIMIT
-#define HARD_SERVER_LIMIT 256
+#define HARD_SERVER_LIMIT 4000
 #endif

 /*
To make usage of this many apache's however, you will also need to boost the number of processes
support, at least for 2.2 kernels. See the
section on kernel
process limits for info on increasing this.
The biggest scalability problem with apache, 1.3.x versions at least, is it's model of using one process
per connection. In cases where there large amounts of concurrent connections, this can require a large
amount resources. These resources can include RAM, scheduler slots, ability to grab locks, database
connections, file descriptors, and others.
In cases where each connection takes a long time to complete, this is only compunded. Connections
can be slow to complete because of large amounts of cpu or i/o usage in dynamic apps, large files being
transferred, or just talking to clients on slow links.
There are several strategies to mitigate this. The basic idea being to free up heavyweight apache
processes from having to handle slow to complete connections.
Static Content Servers
If the servers are serving lots of static files (images, videos, pdf's, etc), a common approach is to
serve these files off a dedicated server. This could be a very light apache setup, or any many cases,
something like thttpd, boa, khttpd, or TUX. In some cases it is possible to run the static server on
the same server, addressed via a different hostname.
For purely static content, some of the other smaller more lightweight web servers can offer very
good performance. They arent nearly as powerful or as flexible as apache, but for very specific performance
crucial tasks, they can be a big win.
Boa: http://www.boa.org/
thttpd: http://www.acme.com/software/thttpd/
mathopd: http://mathop.diva.nl/
If you need even more ExtremeWebServerPerformance, you probabaly want to take a look at TUX,
written by Ingo Molnar. This is the current
world record holder for
SpecWeb99.
It probabaly owns the right to be called the worlds fastest web server.
Proxy Usage For servers that are serving dynamic content, or ssl content, a better approach is
to employ a reverse-proxy. Typically, this would done with either apache's mod_proxy, or Squid. There
can be several advantages from this type of configuration, including content caching, load balancing,
and the prospect of moving slow connections to lighter weight servers.
The easiest approache is probabaly to use mod_proxy and the "ProxyPass" directive to pass content
to another server. mod_proxy supports a degree of caching that can offer a significant performance boost.
But another advantage is that since the proxy server and the web server are likely to have a very fast
interconnect, the web server can quickly serve up large content, freeing up a apache process, why the
proxy slowly feeds out the content to clients. This can be further enhanced by increasing the amount
of socket buffer memory thats for the kernel. See the
section on tcp tuning for info
on this.
proxy links
ListenBacklog
One of the most frustrating thing for a user of a website, is to get "connection refused" error messages.
With apache, the common cause of this is for the number of concurent connections to exceed the number
of available httpd processes that are available to handle connections.
The apache ListenBacklog paramater lets you specify what backlog paramater is set to listen(). By
default on linux, this can be as high as 128.
Increasing this allows a limited number of httpd's to handle a burst of attempted connections.
There are some experimental patches from SGI that accelerate apache. More info at:
http://oss.sgi.com/projects/apache/
I havent really had a chance to test the SGI patches yet, but I've been told they are pretty effective.
Depending on the type of tests, there are a number of tweaks you can do to samba to improve its performace
over the default. The default is best for general purpose file sharing, but for extreme uses, there
are a couple of tweaks.
The first one is to rebuild it with mmap support. In cases where you are serving up a large amount
of small files, this seems to be particularly useful. You just need to add a "--with-mmap" to the configure
line.
You also want to make sure the following options are enabled in the /etc/smb.conf file:
read raw = no
read prediction = true
level2 oplocks = true
One of the better resources for tuning samba is the "Using Samba" book from O'reily. The
chapter on performance
tuning is available online.
The most important tuning aspect for OpenLDAP is deciding what attributes you want to build indexes
on.
I use the values:
cachesize 10000
dbcachesize 100000
sizelimit 10000
loglevel 0
dbcacheNoWsync

index cn,uid
index uidnumber
index gid
index gidnumber
index mail
If you add the following parameters to /etc/openldap/slapd.conf before entering the info
into the database, they will all get indexed and performance will increase.
Some applications, databases in particular, sometimes need large amounts of SHM segments and semaphores.
This tuning is well explained in Oracle documentation.
Lies, damn lies, and statistics.
But aside from that, a good set of benchmarking utilities are often very helpful in doing system
tuning work. It is impossible to duplicate "real world" situations, but that isnt really the goal of
a good benchmark. A good benchmark typically tries to measure the performance of one particular thing
very accurately. If you understand what the benchmarks are doing, they can be very useful tools.
Some of the common and useful benchmarks include:
Bonnie
Bonnie has been around forever,
and the numbers it produces are meaningful to many people. If nothing else, it's good tool for
producing info to share with others. This is a pretty common utility for testing driver performance.
It's only drawback is it sometimes requires the use of huge datasets on large memory machines
to get useful results, but I suppose that goes with the territory.
Check Doug Ledford's
list of benchmarks for more info on Bonnie. There is also a somwhat newer version of Bonnie
called Bonnie++ that fixes a
few bugs, and includes a couple of extra tests.
Dbench
http_load
dkftpbench
tiobench
A multithread disk io benchmarking utility. Seems to do an a good job at pounding on the disks.
Comes with some useful scripts for generating reports and graphs.
The tiobench site.
dt
dt does a lot. disk io, process creation, async io, etc.
dt is available at The dt
page
ttcp
A tcp/udp benchmarking app. Useful for getting an idea of max network bandwidth of a device.
Tends to be more accurate than trying to guestimate with ftp or other protocols.
netperf
Netperf is a benchmark that can be used to measure the performance of many different
types of networking. It provides tests for both unidirecitonal throughput, and end-to-end latency.
The environments currently measureable by netperf include: TCP and UDP via BSD Sockets,
DLPI, Unix Domain Sockets, Fore ATM API, HiPPI.
Info: http://www.netperf.org/netperf/NetperfPage.html
Download: ftp://ftp.sgi.com/sgi/src/netperf/
Info provided by Bill Hilf.
httperf
httperf is a popular web server benchmark tool for measuring web server performance. It provides
a flexible facility for generating various HTTP workloads and for measuring server performance.
The focus of httperf is not on implementing one particular benchmark but on providing a robust,
high-performance tool that facilitates the construction of both micro- and macro-level benchmarks.
The three distinguishing characteristics of httperf are its robustness, which includes the ability
to generate and sustain server overload, support for the HTTP/1.1 protocol, and its extensibility
to new workload generators and performance measurements.
Info:
http://www.hpl.hp.com/personal/David_Mosberger/httperf.html
Download: ftp://ftp.hpl.hp.com/pub/httperf/
Info provided by Bill Hilf.
Autobench
Autobench is a simple Perl script for automating the process of benchmarking a web server (or
for conducting a comparative test of two different web servers). The script is a wrapper around
httperf. Autobench runs httperf a number of times against each host, increasing the number of
requested connections per second on each iteration, and extracts the significant data from the
httperf output, delivering a CSV or TSV format file which can be imported directly into a spreadsheet
for analysis/graphing.
Info: http://www.xenoclast.org/autobench/
Download: http://www.xenoclast.org/autobench/downloads/
Info provided by Bill Hilf.
General benchmark Sites
- 20200218 : Articles on Linux by Ken Hess ( Jul 13, 2019 , www.linuxtoday.com )
- 20190325 : How to Monitor Disk IO in Linux Linux Hint ( Mar 25, 2019 , linuxhint.com )
- 20181213 : Red Hat Linux Professional Users Groups ( Dec 13, 2018 , www.linkedin.com )
- 20130308 : SUSE Linux Enterprise Server System Analysis and Tuning Guide ( Jun 25, 2012 )
- 20111023 : Optimal Usage of SSDs Under Linux: Optimize Your I/O Subsystem ( Optimal Usage of SSDs Under Linux: Optimize Your I/O Subsystem, Oct 23, 2011 )
- 20111023 : LinuxCon Europe 2011 HDD H-O Caching With SSDs Linux Foundation Events ( Hans Reinecke, SUSE )
- 20110809 : Creating a Linux ramdisk ( Creating a Linux ramdisk, Aug 09, 2011 )
- 20110623 : likwid ( freshmeat.net )
- 20110531 : RHEL Tuning and Optimization for Oracle V11 ( RHEL Tuning and Optimization for Oracle V11, May 31, 2011 )
- 20110126 : Monitor Linux file system events with inotify ( Monitor Linux file system events with inotify, Jan 26, 2011 )
- 20110126 : Tuning LAMP systems, Part 1: Understanding the LAMP architecture ( Tuning LAMP systems, Part 1: Understanding the LAMP architecture, Jan 26, 2011 )
- 20110126 : Tuning LAMP systems, Part 3: Tuning your MySQL server ( Tuning LAMP systems, Part 3: Tuning your MySQL server, Jan 26, 2011 )
- 20110126 : Five simple ways to tune your LAMP application by John Mertic, Software Engineer, SugarCRM ( Five simple ways to tune your LAMP application, Jan 26, 2011 )
- 20101130 : Life As A Sys Admin Best Networking Tweaks for Linux by Michael Adams ( Nov 29, 2010 , Network World )
- 20100818 : The Top 12 Native Linux System Monitoring Tools ( The Top 12 Native Linux System Monitoring Tools, Aug 18, 2010 )
- 20100407 : nmon for Linux Main - HomePage ( nmon for Linux Main - HomePage, Apr 07, 2010 )
- 20100407 : Tuning Oracle Database 10g for ext3 file systems ( Tuning Oracle Database 10g for ext3 file systems, )
- 20100407 : Oracle Performance Tuning, 2nd Edition Chapter 10. Diagnostic and Tuning Tools ( Oracle Performance Tuning, 2nd Edition Chapter 10. Diagnostic and Tuning Tools, )
- 20100407 : b10752 ( b10752, )
- 20100407 : Tuning Oracle Database ( Tuning Oracle Database, )
- 20100314 : UNIX Performance Management by Jaqui Lynch (Boston College) ( UNIX Performance Management, Mar 14, 2010 )
- 20100313 : CertCities.com Column A System Monitoring Tool Primer ( CertCities.com Column A System Monitoring Tool Primer, Mar 13, 2010 )
- 20100303 : Five Tools for Measuring and Improving Linux System Performance Linux.com ( Five Tools for Measuring and Improving Linux System Performance Linux.com, Mar 3, 2010 )
- 20100303 : Watching Hard Drive Activity With iotop On Ubuntu 8.10 And Debian Lenny HowtoForge - Linux Howtos and Tutorials ( Watching Hard Drive Activity With iotop On Ubuntu 8.10 And Debian Lenny HowtoForge - Linux Howtos and Tutorials, )
- 20100303 : I-O usage per process on Linux ( September 11, 2009 , Levent Serinol's Blog )
- 20100303 : IBM Redbooks Linux Performance and Tuning Guidelines ( IBM Redbooks Linux Performance and Tuning Guidelines, )
- 20091111 : FROSUG perf horrors ( FROSUG perf horrors, Nov 11, 2009 )
- 20090225 : How to troubleshoot RHEL performance bottlenecks by Ken Milberg ( 09.30.2008 )
- 20090223 : Deployment_Guide ( Deployment_Guide, Feb 23, 2009 )
- 20090212 : Choosing an I-O Scheduler for Red Hat Enterprise Linux 4 and the 2.6 Kernel ( redhat.com )
- 20090211 : What Is the Linux Kernel Parameter vm.swappiness ( What Is the Linux Kernel Parameter vm.swappiness, Feb 11, 2009 )
- 20081027 : sysprof 1.0.11 ( sysprof 1.0.11, Oct 27, 2008 )
- 20081009 : .. so I got one of the new Intel SSDs ( .. so I got one of the new Intel SSD's, Oct 9, 2008 )
- 20071106 : freshmeat.net Project details for sarvant ( freshmeat.net Project details for sarvant, Nov 6, 2007 )
- 20071106 : Stress-testing the Linux kernel ( Stress-testing the Linux kernel, Nov 6, 2007 )
- 20071106 : Tutorial: Monitor a Linux System with Sysstat ( Tutorial: Monitor a Linux System with Sysstat, Nov 6, 2007 )
- 20071106 : SYSSTAT tutorial ( SYSSTAT tutorial, Nov 6, 2007 )
Monitoring Specific Storage Devices or Partitions with iostat:
By default, iostat monitors all the storage devices of your computer. But, you can monitor
specific storage devices (such as sda, sdb etc) or specific partitions (such as sda1, sda2,
sdb4 etc) with iostat as well.
For example, to monitor the storage device sda only, run iostat as follows:
$ sudo iostat
sda
Or
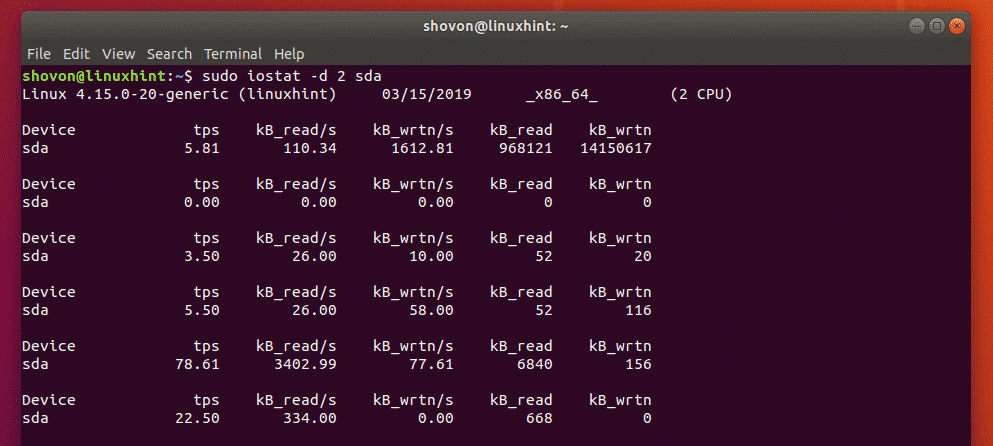
$ sudo iostat -d 2 sda
As you can see, only the storage device sda is monitored.
You can also monitor multiple storage devices with iostat.
For example, to monitor the storage devices sda and sdb , run iostat as follows:
$ sudo
iostat sda sdb
Or
$ sudo iostat -d 2 sda sdb

If you want to monitor specific partitions, then you can do so as well.
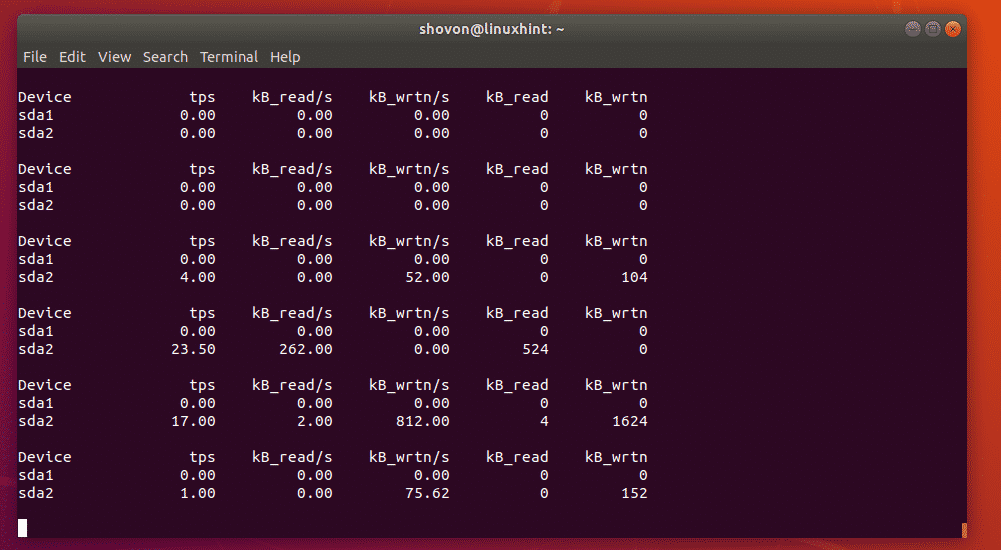
For example, let's say, you want to monitor the partitions sda1 and sda2 , then run iostat
as follows:
$ sudo iostat sda1 sda2
Or
$ sudo iostat -d 2 sda1 sda2

As you can see, only the partitions sda1 and sda2 are monitored.
Monitoring
LVM Devices with iostat:
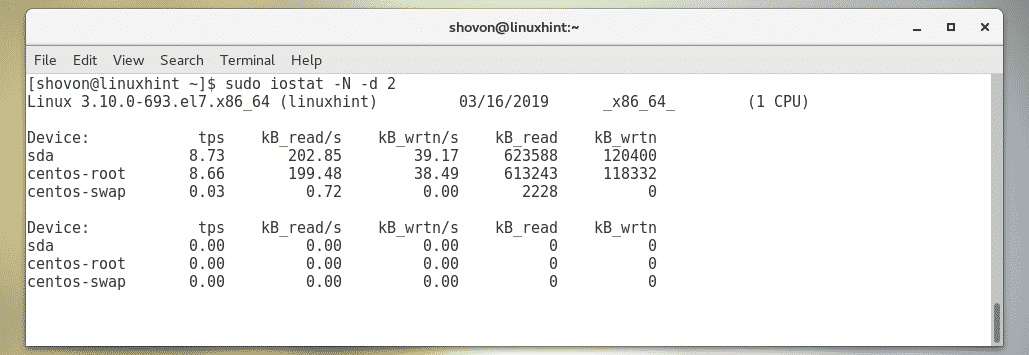
You can monitor the LVM devices of your computer with the -N option of iostat.
To monitor the LVM devices of your Linux machine as well, run iostat as follows:
$ sudo
iostat -N -d 2
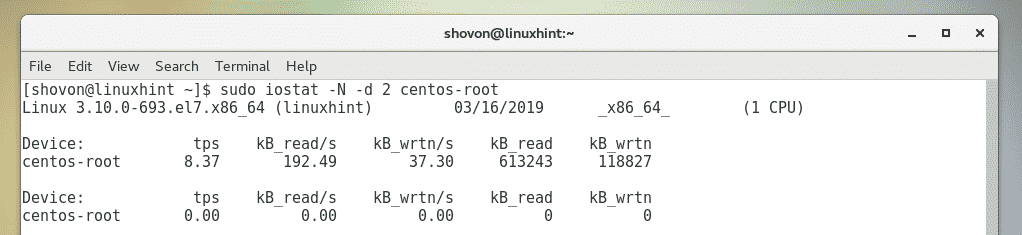
You can also monitor specific LVM logical volume as well.
For example, to monitor the LVM logical volume centos-root (let's say), run iostat as
follows:
$ sudo iostat -N -d 2 centos-root
Changing
the Units of iostat:
By default, iostat generates reports in kilobytes (kB) unit. But there are options that you
can use to change the unit.
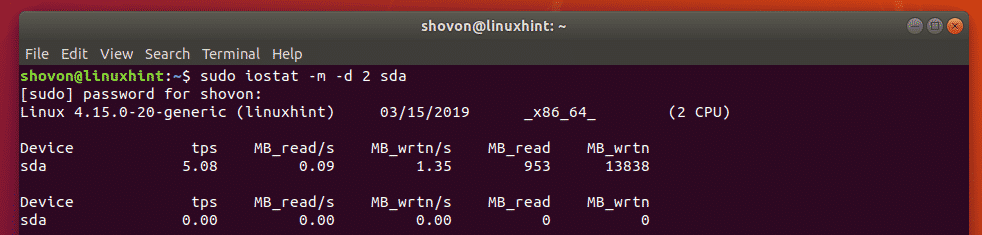
For example, to change the unit to megabytes (MB), use the -m option of iostat.
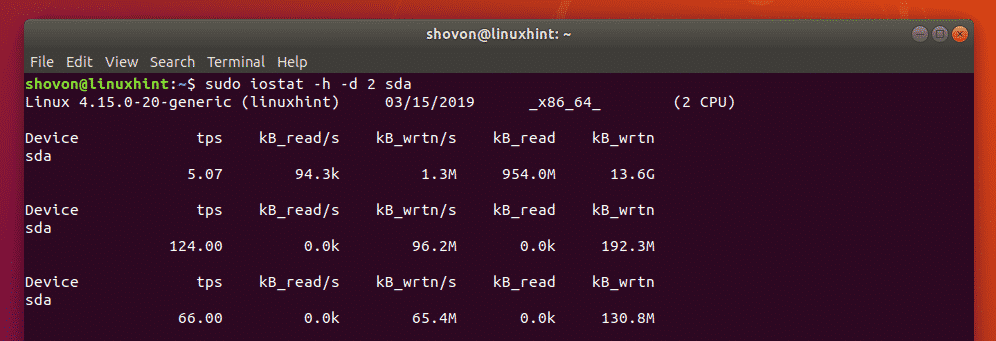
You can also change the unit to human readable with the -h option of iostat. Human readable
format will automatically pick the right unit depending on the available data.
To change the unit to megabytes, run iostat as follows:
$ sudo iostat -m -d 2 sda
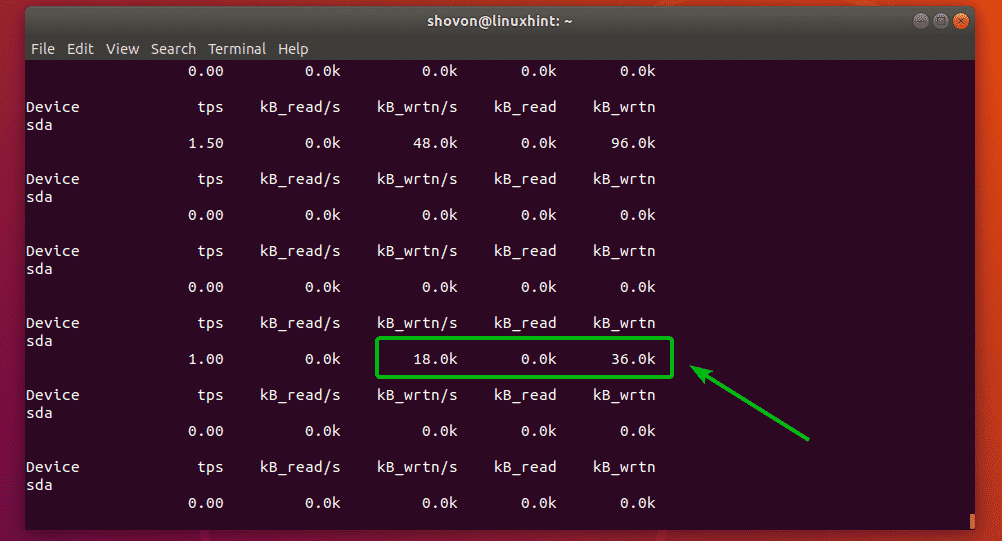
To change the unit to human readable format, run iostat as follows:
$ sudo iostat -h -d 2
sda
I copied as file and as you can see, the unit is now in megabytes (MB).
It changed to kilobytes (kB) as soon as the file copy is over.
Extended
Display of iostat:
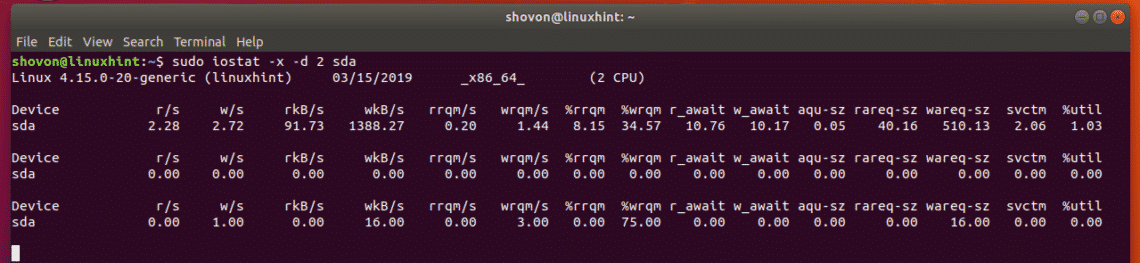
If you want, you can display a lot more information about disk i/o with iostat. To do that,
use the -x option of iostat.
For example, to display extended information about disk i/o, run iostat as follows:
$
sudo iostat -x -d 2 sda
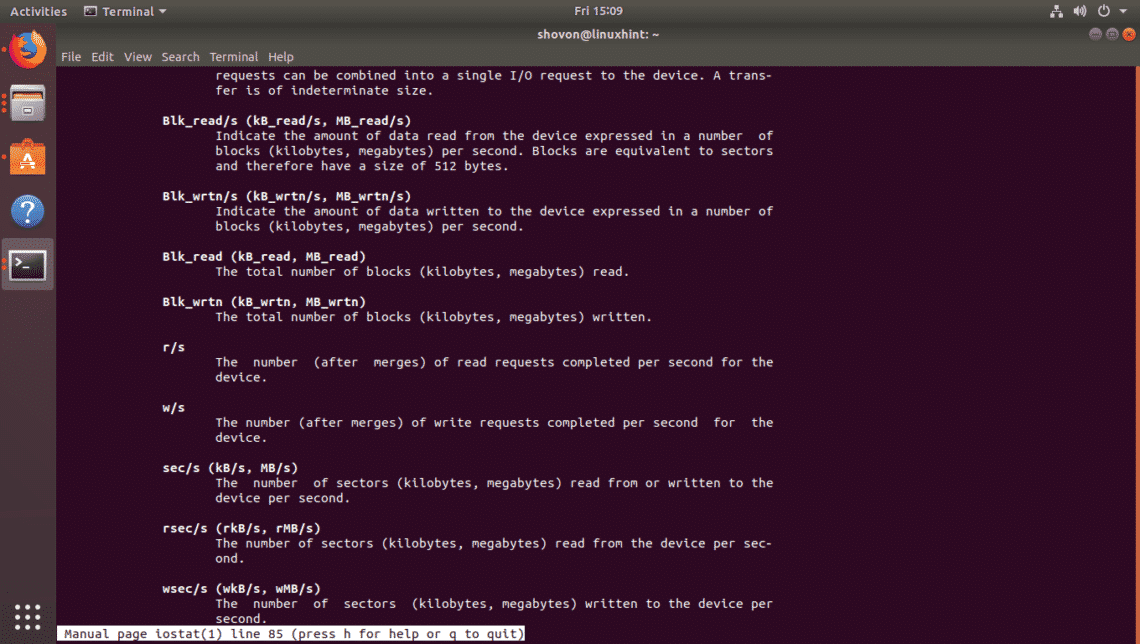
You can find what each of these fields (rrqm/s, %wrqm etc) means in the man page of
iostat.
Getting
Help:
If you need more information on each of the supported options of iostat and what each of the
fields of iostat means, I recommend you take a look at the man page of iostat.
You can access the man page of iostat with the following command:
$ man iostat
So, that's how you use iostat in Linux. Thanks for reading this article.
Compare with Oracle recommendations. Some setting might be wrong. Oracle recommendes, see
Oracle kernel parameters tuning on Linux
Oracle recommmendations:
| ip_local_port_range |
Minimum:9000 Maximum: 65000 |
|
/proc/sys/net/ipv4/ip_local_port_range |
| rmem_default |
262144 |
|
/proc/sys/net/core/rmem_default |
| rmem_max |
4194304 |
|
/proc/sys/net/core/rmem_max |
| wmem_default |
262144 |
|
/proc/sys/net/core/wmem_default |
| wmem_max |
1048576 |
|
/proc/sys/net/core/wmem_max |
| tcp_wmem |
262144 |
|
/proc/sys/net/ipv4/tcp_wmem |
| tcp_rmem |
4194304 |
|
/proc/sys/net/ipv4/tcp_rmem |
Minesh Patel , Site Reliability Engineer, Austin, Texas Area
TCP IO setting on Red hat will reduce your intermittent or random slowness problem or there issue if you have TCP IO of default
settings.
For Red Hat Linux: 131071 is default value.
Double the value from 131071 to 262144
cat /proc/sys/net/core/rmem_max
131071 → 262144
cat /proc/sys/net/core/rmem_default
129024 → 262144
 cat /proc/sys/net/core/wmem_default
129024 → 262144
 cat /proc/sys/net/core/wmem_max
131071 → 262144
To improve fail over performance in a RAC cluster, consider changing the following IP kernel parameters as well:
net.ipv4.tcp_keepalive_time
net.ipv4.tcp_keepalive_intvl
net.ipv4.tcp_retries2
net.ipv4.tcp_syn_retries
# sysctl -w net.ipv4.ip_local_port_range="1024 65000"
To make the change permanent, add the following line to the /etc/sysctl.conf file, which is used during the boot process:
net.ipv4.ip_local_port_range=1024 65000
The first number is the first local port allowed for TCP and UDP traffic, and the second number is the last port number.
Jun 25, 2012
Copyright © 2006–2012 Novell, Inc. and contributors. All rights reserved.
Over the past few years, Linux has made its way into the data centers of many corporations all
over the globe. The Linux operating system has become accepted by both the scientific and enterprise
user population. Today, Linux is by far the most versatile operating system. You can find Linux
on embedded devices such as firewalls and cell phones and mainframes. Naturally, performance of
the Linux operating system has become a hot topic for both scientific and enterprise users. However,
calculating a global weather forecast and hosting a database impose different requirements on the
operating system. Linux has to accommodate all possible usage scenarios with the most optimal performance.
The consequence of this challenge is that most Linux distributions contain general tuning parameters
to accommodate all users.
IBM® has embraced Linux, and it is recognized as an operating system suitable for enterprise-level
applications running on IBM systems. Most enterprise applications are now available on Linux, including
file and print servers, database servers, Web servers, and collaboration and mail servers.
With use of Linux in an enterprise-class server comes the need to monitor performance and, when
necessary, tune the server to remove bottSUSE Linux Enterprise Server is used for a broad range
of usage scenarios in enterprise and scientific data centers. SUSE has ensured SUSE Linux Enterprise
Server is set up in a way that it accommodates different operation purposes with optimal performance.
However, SUSE Linux Enterprise Server must meet very different demands when employed on a number
crunching server compared to a file server, for example.
Generally it is not possible to ship a distribution that will by default be optimized for all kinds
of workloads. Due to the simple fact that different workloads vary substantially in various aspects-most
importantly I/O access patterns, memory access patterns, and process scheduling. A behavior that
perfectly suits a certain workload might t reduce performance of a completely different workload
(for example, I/O intensive databases usually have completely different requirements compared to
CPU-intensive tasks, such as video encoding). The great versatility of Linux makes it possible to
configure your system in a way that it brings out the best in each usage scenario.
This manual introduces you to means to monitor and analyze your system. It describes methods to
manage system resources and to tune your system. This guide does not offer recipes for special scenarios,
because each server has got its own different demands. It rather enables you to thoroughly analyze
your servers and make the most out of them.
General Notes on System Tuning
Tuning a system requires a carefully planned proceeding. Learn which steps are necessary to successfully
improve your system.
Part II, "System Monitoring"
Linux offers a large variety of tools to monitor almost every aspect of the system. Learn how to
use these utilities and how to read and analyze the system log files.
Part III, "Kernel Monitoring"
The Linux kernel itself offers means to examine every nut, bolt and screw of the system. This part
introduces you to SystemTap, a scripting language for writing kernel modules that can be used to
analyze and filter data. Collect debugging information and find bottlenecks by using kernel probes
and use perfmon2 to access the CPU's performance monitoring unit. Last, monitor applications with
the help of Oprofile.
Part IV, "Resource Management"
Learn how to set up a tailor-made system fitting exactly the server's need. Get to know how to use
power management while at the same time keeping the performance of a system at a level that matches
the current requirements.
Part V, "Kernel Tuning"
The Linux kernel can be optimized either by using sysctl or via the /proc file system. This part
covers tuning the I/O performance and optimizing the way how Linux schedules processes. It also
describes basic principles of memory management and shows how memory management could be fine-tuned
to suit needs of specific applications and usage patterns. Furthermore, it describes how to optimize
network performance.
Part VI, "Handling System Dumps"
This part enables you to analyze and handle application or system crashes. It introduces tracing
tools such as strace or ltrace and describes how to handle system crashes using Kexec and Kdump.
lenecks that affect users. This IBM Redpaper describes the methods you can use to tune Linux, tools
that you can use to monitor and analyze server performance, and key tuning parameters for specific
server applications. The purpose of this redpaper is to understand, analyze, and tune the Linux
operating system to yield superior performance for any type of application you plan to run on these
systems.
The tuning parameters, benchmark results, and monitoring tools used in our test environment were
executed on Red Hat and Novell SUSE Linux kernel 2.6 systems running on IBM System x servers and
IBM System z servers. However, the information in this redpaper should be helpful for all Linux
hardware platforms.
Solid-state drives (SSDs) gain popularity, their prices are falling. They outperform conventional
hard drives in both random and streaming access patterns and open new possibilities. SSDs work in
Linux out-of-the-box, but their performance and endurance can be highly optimized through various
tunings: File systems like Ext4, Btrfs or XFS allow online and batched discard to trim unused sectors
and have special features like pre-discard on file system initialization. Over-provisioning a SSD
compensates possible drawbacks when discard is not possible. Additional
tweaks like using the noatime mount option, tmpfs for volatile data, native command queuing, and
some more tunings finally provide altogether I/O never seen before. Attendees know
how to manage device mapper, LVM, software RAID, and Ext4. They want to solve I/O bottlenecks on
Linux servers or simply accelerate their Linux laptop by using SSDs in the best possible way.
Werner Fischer, Thomas-Krenn.AG Werner Fischer is a technology specialist at Thomas-Krenn.AG
and chief editor of the Thomas Krenn Wiki. His current main focus is hardware-monitoring and I/O
optimization, especially with Flash-based storage. Besides that Werner mainly deals with virtualization
and high availability. He is a regular speaker about all these topics at many conferences, including
LinuxTag, Open Source Data Center Conference, Profoss, Open Source Meets Business, Security Forum
Hagenberg and other conferences (see www.wefi.net) and has written articles for the German ADMIN
Magazin, Linux Technical Review, network Computing, and LANline Magazin. Before joining Thomas Krenn
in 2005, Werner worked at IBM in Germany and Austria. Together with other IBMers he wrote two IBM
Redbooks in the HA and storage area. Werner holds a graduate degree in computer and media security
from the University of Applied Sciences of Upper Austria in Hagenberg.
SSDs are becoming more and more common, but they are still restricted in size and in lifetime.
This makes their useability as the main hard drive rather limited. So instead it would make more
sense to use them for caching I/O accesses to a normal HDD. In this talk I will be presenting two
approaches to this, 'flashcache' and 'ssdcache'. The first is an existing implementation currently
in use at taobao (cf taobao.com). It's using an on-disk bitmap format to store the block references
and implements both write-through and write-back caching. The second is a re-implementation from
me using a different paradigm: - Metadata will not be stored on disk, but rather in a persistent
memory region - latency is minimized, preferring fast I/O to expensive cache lookups. I'll be giving
some results for both of them and will be discussing the pros and cons of both approaches.
Hans Reinecke, SUSE
Studied Physics with main focus image processing in Heidelberg from 1990 until 1997, followed
by a PhD in Edinburgh 's Heriot-Watt University in 2000. Worked as sysadmin during the studies,
mainly in the Mathematical Institute in Heidelberg. Linux addict since the earliest days (0.95);
various patches to get Linux up and running. Now working for SUSE Linux Products GmbH as senior
engineer with focus on storage and mainframe support. Main points of interest are all the nifty
things you can do with storage: (i)SCSI, multipathing, FCoE and the like. And S/390, naturally.
Plus occasionally maintaining the aic79xx driver.
While performing some testing a few weeks ago, I needed to create a ramdisk on one of my redhat
AS 4.0 servers. I knew Solaris supported tmpfs, and after a bit of googling was surprised to find
that Linux supported the tmpfs pseudo-file system as well. To create a ramdisk on a Linux host,
you first need to find a suitable place to mount the tmpfs file system. For my tests, I used mkdir
to create a directory valled /var/ramdisk:
$ mkdir /var/ramdisk
Once the mount point is identified, you can use the mount command to mount a tmpfs file system
on top of that mount point:
$ mount -t tmpfs none /var/ramdisk -o size=28m
Now each time you access /var/ramdisk, your reads and writes will be coming directly from memory.
Nice!
[Jun 23, 2011] likwid
Likwid is a set of easy to use command line tools for Linux. It supports programmers in developing
high performance multi-threaded programs. "Likwid" stands for "Like I knew what I am doing". It
contains the following tools: likwid-topology, which shows thread and cache topology; likwid-perfCtr,
which measures hardware performance counters on Intel and AMD processors; likwid-features, which
shows and toggles hardware prefetch control bits on Intel Core 2 processors; likwid-pin, which pins
a threaded application without touching its code (it supports pthreads, Intel OpenMP, and gcc OpenMP),
and likwid-bench, a low level benchmarking framework.
It works with any standard Linux kernel. Likwid is lightweight and adds no overhead during measurements.
The Completely Fair Queuing (CFQ) scheduler is the default algorithm in Red Hat Enterprise Linux
4 which is suitable for a wide variety of applications and provides a good compromise between throughput
and latency. In comparison to the CFQ algorithm, the Deadline scheduler
caps maximum latency per request and maintains a good disk throughput which is best for disk-intensive
database applications.
Hence, the Deadline scheduler is recommended for database systems.
Also, at the time of this writing there is a bug in the CFQ scheduler which affects heavy I/O, see
Metalink Bug:5041764. Even though this bug report talks about OCFS2 testing, this bug can also happen
during heavy IO access to raw or block devices and as a consequence could evict RAC nodes.
To switch to the Deadline scheduler, the boot parameter elevator=deadline
must be passed to the kernel that is being used.
Edit the /etc/grub.conf file and add the following parameter to the kernel that is being used,
in this example 2.4.21-32.0.1.ELhugemem:
title Red Hat Enterprise Linux Server (2.6.18-8.el5)
root (hd0,0)
kernel /vmlinuz-2.6.18-8.el5 ro root=/dev/sda2 elevator=deadline initrd /initrd-2.6.18-8.el5.img
This entry tells the 2.6.18-8.el5 kernel to use the Deadline scheduler. Make sure to reboot the
system to activate the new scheduler.
Changing Network Adapter Settings
To check the speed and settings of network adapters, use the
ethtool command which
works now
for most network interface cards. To check the adapter settings of
eth0 run:
# ethtool eth0
To force a speed change to 1000Mbps, full duplex mode, run:
# ethtool -s eth0 speed 1000 duplex full autoneg off
To make a speed change permanent for
eth0, set or add the
ETHTOOL_OPT environment
variable in
/etc/sysconfig/network-scripts/ifcfg-eth0
:
ETHTOOL_OPTS="speed 1000 duplex full autoneg off"
This environment variable is sourced in by the network scripts each time the
network service is
started.
Changing Network Kernel Settings
Oracle now uses User Datagram Protocol (UDP) as the default protocol on Linux
for interprocess
communication, such as cache fusion buffer transfers between the instances.
However, starting with
Oracle 10g network settings should be adjusted for standalone databases as well.
Oracle recommends the default and maximum send buffer size (
SO_SNDBUF
socket option) and
receive buffer size (
SO_RCVBUF
socket option) to be set to 256 KB. The receive buffers are used
by TCP and UDP to hold received data until it is read by the application. The
receive buffer cannot
overflow because the peer is not allowed to send data beyond the buffer size
window. This means that
datagrams will be discarded if they do not fit in the socket receive buffer.
This could cause the sender
to overwhelm the receiver.
The default and maximum window size can be changed in the proc file system without
reboot:
The default setting in bytes of the socket receive buffer
# sysctl -w net.core.rmem_default=262144
The default setting in bytes of the socket send buffer
# sysctl -w net.core.wmem_default=262144
The maximum socket receive buffer size which may be set by using the SO_RCVBUF
socket option
# sysctl -w net.core.rmem_max=262144
The maximum socket send buffer size which may be set by using the SO_SNDBUF socket option
# sysctl -w net.core.wmem_max=262144
To make the change permanent, add the following lines to the
/etc/sysctl.conf file,
which is used
during the boot process:
net.core.rmem_default=262144
net.core.wmem_default=262144
net.core.rmem_max=262144
net.core.wmem_max=262144
To improve fail over performance in a RAC cluster, consider changing the following
IP kernel
parameters as well:
net.ipv4.tcp_keepalive_time
net.ipv4.tcp_keepalive_intvl
net.ipv4.tcp_retries2
net.ipv4.tcp_syn_retries
Changing these settings may be highly dependent on your system, network, and
other applications.
For suggestions, see Metalink Note:249213.1 and Note:265194.1.
On Red Hat Enterprise Linux systems the default range of IP port numbers that
are allowed for TCP
and UDP traffic on the server is too low for 9i and 10g systems. Oracle recommends
the following port
range:
# sysctl -w net.ipv4.ip_local_port_range="1024 65000"
To make the change permanent, add the following line to the /etc/sysctl.conf
file, which is used during
the boot process:
net.ipv4.ip_local_port_range=1024 65000
The first number is the first local port allowed for TCP and UDP traffic, and
the second number is the last port number.
10.3. Flow Control for e1000 Network Interface Cards
The e1000 network interface card family do not have flow control enabled in
the 2.6 kernel on Red Hat
Enterprise Linux 4 and 5. If you have heavy traffic, then the RAC interconnects
may lose blocks, see
Metalink Bug:5058952. For more information on flow control, see Wikipedia
Flow control1.
To enable Receive flow control for e1000 network interface cards, add the following
line to the
/etc/
modprobe.conf
file:
options e1000 FlowControl=1
The e1000 module needs to be reloaded for the change to take effect. Once the
module is loaded with
flow control, you should see e1000 flow control module messages in
/var/log/messages.
Verifying Asynchronous I/O Usage
To verify whether
$ORACLE_HOME/bin/oracle
was linked with asynchronous I/O, you can use the
Linux commands
ldd
and nm.
In the following example,
$ORACLE_HOME/bin/oracle was relinked with asynchronous I/O:
$ ldd $ORACLE_HOME/bin/oracle | grep libaio
libaio.so.1 => /usr/lib/libaio.so.1 (0x0093d000)
$ nm $ORACLE_HOME/bin/oracle | grep io_getevent
w io_getevents@@LIBAIO_0.1
$
In the following example,
$ORACLE_HOME/bin/oracle has NOT been relinked with asynchronous
I/
O:
$ ldd $ORACLE_HOME/bin/oracle | grep libaio
$ nm $ORACLE_HOME/bin/oracle | grep io_getevent
w io_getevents
$
If
$ORACLE_HOME/bin/oracle
is relinked with asynchronous I/O it does not necessarily mean that
Oracle is really using it. You also have to ensure that Oracle is configured
to use asynchronous I/O
calls, see Enabling Asynchronous I/O Support.
To verify whether Oracle is making asynchronous I/O calls, you can take a look
at the
/proc/
slabinfo
file assuming there are no other applications
performing asynchronous I/O calls on the
system. This file shows kernel slab cache information in real time.
On a Red Hat Enterprise Linux 3 system where Oracle does
not make asynchronous
I/O calls, the
output looks like this:
$ egrep "kioctx|kiocb" /proc/slabinfo
kioctx 0 0 128 0 0 1 : 1008 252
kiocb 0 0 128 0 0 1 : 1008 252
$
Once Oracle makes asynchronous I/O calls, the output on a Red Hat Enterprise
Linux 3 system will
look like this:
$ egrep "kioctx|kiocb" /proc/slabinfo
kioctx 690 690 128 23 23 1 : 1008 252
kiocb 58446 65160 128 1971 2172 1 : 1008 252
Use inotify when you need efficient, fine-grained, asynchronous monitoring of Linux file system
events. Use it for user-space monitoring for security, performance, or other purposes. (On 10 September
2010, the downloadable sample code for this article was refreshed to correct a typo. - Ed.)
Applications using the LAMP (Linux, Apache, MySQL, PHP/Perl) architecture are constantly being developed
and deployed. But often the server administrator has little control over the application itself
because it's written by someone else. This series of three articles discusses many of the server
configuration items that can make or break an application's performance. This first article covers
the LAMP architecture, some measurement techniques, and some basic Linux kernel, disk, and file
system tweaks. Successive articles investigate tuning the Apache, MySQL, and PHP components. Applications
using the LAMP (Linux, Apache, MySQL, PHP/Perl) architecture are constantly being developed and
deployed. But often the server administrator has little control over the application itself because
it's written by someone else. This series of three articles discusses many of the server configuration
items that can make or break an application's performance. This second article focuses on steps
you can take to optimize Apache and PHP.
Applications using the LAMP (Linux, Apache, MySQL, PHP/Perl) architecture are constantly being developed
and deployed. But often the server administrator has little control over the application itself
because it's written by someone else. This series of three articles discusses many of the server
configuration items that can make or break an application's performance. This third article, the
last in the series, focuses on tuning the database layer for maximum efficiency.
Summary: The Linux, Apache, MySQL, and PHP (LAMP) architecture is one of the most
popular choices for web server architectures in use today. Author John Mertic examines five things
every LAMP application should take advantage of for optimum performance.
A Linux system can be tweaked to a degree
Windows users may envy (or fear) especially for networking. Tweaking a Linux box for networking
is a bit more mundane than other platforms: there are specific driver settings one can work with
but its best flexibility comes from a mix of OS-level modifications and adherence to different
RFCs.
ifconfig (interface) txqueuelen #
Software buffers for network adapters on Linux start off at a conservative 1000 packets.
Network
researchers and scientists
have mucked around with this, and figured out that we should be using 10,000 for anything decent
on a LAN; more if you're running GB or 10GE stuff. Slow interfaces, such as modems and WAN links,
can default to 0-100, but don't be
afraid to bump it up towards 1000 and see if your performance improves. Bumping up this setting
does use memory, so be careful if you're using an embedded router or something (I've used 10,000
on 16MB RAM OpenWRT units, no prob).
You can edit /etc/rc.local, add an "up" command to /etc/networking/interfaces, or whatever your
distribution suggests and it's best to put a command like this at startup.
/etc/sysctl.conf
This file governs default behavior for many network and file operation settings on Linux and
other *nix-based systems. If you deploy Ubuntu or Fedora systems, you'll notice they will add their
own tweaks (usually security or file-oriented) to the file: don't delete those, unless you read
up on them, or see any that are contradicted by the suggested additions here...
net.ipv4.tcp_rfc1337=1
net.ipv4.tcp_window_scaling=1
net.ipv4.tcp_workaround_signed_windows=1
net.ipv4.tcp_sack=1
net.ipv4.tcp_fack=1
net.ipv4.tcp_low_latency=1
net.ipv4.ip_no_pmtu_disc=0
net.ipv4.tcp_mtu_probing=1
net.ipv4.tcp_frto=2
net.ipv4.tcp_frto_response=2
net.ipv4.tcp_congestion_control=illinois
1. RFC 1337, TIME-WAIT Assassination
Hazards in TCP, a fix written in 1992 for some theoretically-possible failure modes for TCP connections.
To this day this RFC still has people confused if it negatively impacts performance or not or is
supported by any decent router. Murphy's Law is that the only router that it would even have trouble
with, is most likely your own.
2. TCP window scaling
tries to avoid getting the network adapter saturated with incoming packets.
3. TCP SACK and FACK refer to options found in
RFC 2018 and are also documented
back to Linux Kernel 2.6.17 with an experimental "TCP-Peach"
set of functions. These are meant to get you your data without excessive losses.
4. The latency setting is 1 if you prefer more packets vs bandwidth, or 0 if you prefer bandwidth.
More packets are ideal for things like Remote Desktop and VOIP: less for bulk downloading.
5. I found RFC 2923, which
is a good review of PMTU.
IPv6 uses PMTU by default to avoid segmenting packets at the router level, but its optional for
IPv4. PMTU is meant to inform routers of the best packet sizes to use between links, but its a common
admin practice to block ICMP ports that allow pinging, thus breaking this mechanism. Linux tries
to use it, and so do I: if you have problems, you have a problem router, and can change the "no"
setting to 1. "MTU probing" is also a part of this: 1 means try, and 0 means don't.
6. FRTO is a mechanism in newer Linux
kernels to optimize for wireless hosts: use it if you have them; delete the setting, or set to 0,
if you don't.
For further study, there's a
great IBM
article regarding network optimizations: it was my source for some of these settings, as well
as following numerous articles on tweaking Linux networking over the years (SpeedGuide has
one from 2003).
TCP Congestion Controls
Windows Vista and newer gained
Compound TCP as an alternative
to standard TCP Reno. Linux Kernel
2.6 has had
numerous
mechanisms available to it for some time:
2.6.19 defaulted to CUBIC which
was supposed to work well over "long links." My two personal favorites:
TCP Westwood + and
TCP Illinois. But you can
dig in, look at different research papers online, and see what works best for your environment.
1. Make sure your kernel has the correct module: in my example, I use TCP Illinois, which has
been compiled with any standard Ubuntu kernel since 2008, and is found as tcp_illinois.
2. Add said kernel module to /etc/modules
3. Change /etc/sysctl.conf to use the non "tcp_" part of your selection.
There you have it -- some of my favorite Linux tweaks for networking. I'm interested in hearing
how these worked for you. If you have some of your own, please post a comment and share them with
other readers.
htop might be a better top alternative, I would also add nmon?
thewebhostingdi
Pmap - - Process Memory Usage
The command pmap report memory map of a process. Use this command to find out causes of memory
bottlenecks.
# pmap -d PID
Iptraf - Real-time Network Statistics
Features of Iptraf are
Network traffic statistics by TCP connection
IP traffic statistics by network interface
Network traffic statistics by protocol
Network traffic statistics by TCP/UDP port and by packet size
Network traffic statistics by Layer2 address
This is a tool that came from AIX courtesy of IBM. IMHO nothing special in comparison with vmstat
and top. For the description see
nmon performance-
A free tool to analyze AIX and Linux ...
nmon is short for Nigel's performance MONitor for Linux
This systems administrator, tuner, benchmark tool gives you a huge amount of important performance
information in one go. It can output the data in two ways
- On screen (console, telnet, VNC, putty or X Windows) using curses for low CPU impact which
is updated once every two seconds. You hit single characters on you keyboard to enable/disable
the various sorts of data.
- You can display the CPU, memory, network, disks (mini graphs or numbers), file systems,
NFS, top processes, resources (Linux version & processors) and on Power micro-partition
information.
- For lots of examples, see the "Screen shots" from the left menu.
- As you can see on the left lmon12e now in colour
- Save the data to a comma separated file for analysis and longer term data capture.
- Use this together with nmon Analyser Excel 2000 spreadsheet, which loads the nmon output
file and automatically creates dozens of graphs ready for you to study or write performance
reports.
- Filter this data, add it to a rrd database (using an excellent freely available utility
called rrdtool). This graphs the data to .gif or .png files plus generates the webpage .html
file and you can then put the graphs directly on a website automatically on AIX with no
need of a Windows based machine.
- Directly put the data into a rrd database or other database for your own analysis
redhat.com
Red Hat® Enterprise Linux® 4 enables Oracle® Database 10g file system applications to
perform within 3% of raw I/O due to enhancements to the ext3 file system and through the support
of both Direct and Asynchronous I/O. Since Red Hat Enterprise Linux 2.1, the use of Direct I/O (DIO)
has been an important ext file system feature for large Oracle database applications where the database
sizes greatly exceed the amount of physical memory available on the servers.
The Linux 2.6 kernel implemented in Red Hat Enterprise Linux 4 continues to support Direct I/O
to ext file systems and also includes scalability changes for Asynchronous I/O (AIO), which allows
the simultaneous use of AIO and DIO to ext3 files for database use. This combination allows ext3
files system databases to scale up to CPU counts previously only considered for raw I/O while providing
the manageability of a file system to ease system administration task like copying or moving files,
backup to tape, and file system and volume snap shots.
Traditional Oracle users setup raw devices and/or volume managers with raw devices for peak Oracle
performance. Red Hat Enterprise Linux 4 supports this by using the raw command to single disks,
md stripes, or LVM2 volumes. For example:
	raw /dev/raw/raw1 /dev/sda
	raw /dev/raw/raw2 /dev/md1
	raw /dev/raw/raw3 /dev/vol1
Oracle Database 9i and Oracle Database 10g support a variety of file systems under
Linux to offer improved manageability, exposing the database files to the operating system for easy
manipulation of files (such as moving, copying, backing up and restoring files for archival purposes,
or when altering or expanding underlying storage). In doing so, most file systems implement a page
or file cache which caches file I/O in the systems memory. This works very well for frequently accessed
data for problem sizes that fit within the memory size of the systems.
Oracle, by design, uses memory for its database cache. Large shared memory segments are allocated
at database startup for Oracle's Shared Global Area (SGA). Oracle Database Administrators (DBAs)
adjust and tune the SGA for optimal performance of their databases. For frequently accessed database
files, Oracle is already caching file I/O and handling data coherency within the database architecture.
If the file system is also caching I/O memory, performance can actually suffer by "double caching"
file I/O. For large databases, which greatly exceed the total memory of a system or for data access
patterns with very little data re-use, performance can suffer.Red Hat Enterprise Linux 2.1 and
higher support the use of Direct I/O to the ext3 file system by opening the file with the O_DIRECT
flag, a POSIX-compliant specification. Oracle can disable this "double caching" by providing init.ora
options for opening the file with direct access to storage using the O_DIRECT flag upon opening
the file
filesystemio_options="DirectIO"
Figure 1 shows the comparison of raw versus ext3 file system with and without the use of Direct
I/O for a 40 GB OLTP database and for a 100 GB decision support query with Oracle Database 10g
10.0.1.3.
In this chapter:
MONITOR: Monitoring
System Activity Tables
SQL_TRACE:
Writing a Trace File
TKPROF: Interpreting
the Trace File
EXPLAIN PLAN:
Explaining the Optimizer's Plan
ORADBX: Listing
Events
ANALYZE: Validating
and Computing Statistics
UTLBSTAT.sql
and UTLESTAT.sql: Taking Snapshots
Other Oracle
Scripts
Some Scripts
of Our Own
Oracle Performance
Manager
b10752
Oracle® Database Performance Tuning Guide 10g Release 1 (10.1) Part No. B10752-01
Tuning
Oracle DatabaseOracle® Database Administrator's Reference 10g Release 2 (10.2) for UNIX-Based
Operating Systems Part Number B15658-06
This chapter describes how to tune Oracle Database. It contains the following sections:
Oracle Database is a highly optimizable software
product. Frequent tuning optimizes system performance and prevents data bottlenecks.Before tuning
the database, you must observe its normal behavior by using the tools described in the
"Operating System Tools" section.
Several operating system tools are available to enable you to assess
database performance and determine database requirements. In addition to providing statistics for
Oracle processes, these tools provide statistics for CPU usage, interrupts, swapping, paging, context
switching, and I/O for the entire system.
This section provides information about the following common tools:
The purpose of this paper is to introduce the performance analyst to some of the free tools available
to monitor and manage performance on UNIX systems, and to provide a guideline on how to diagnose
and fix performance problems in that environment. The paper is based on the authors experiences
with AIX and will cover many of the tools available on that and other UNIX platforms. It will also
provide some Rules of Thumb for analyzing the performance of UNIX systems.
As more mission critical work finds its way from the mainframe to distributed systems,
performance management for those systems is becoming more important. The goal for systems management
is not only to maximize system throughput, but also to reduce response time. In order to this it
is necessary to not only work on the system resources, but also to work on profiling and tuning
applications.
In UNIX there are 7 major resource types that need to be monitored and tuned - CPU, memory,
disk space and arms, communications lines, I/O Time, Network Time and applications programs. There
are also standard rules of thumb in most of these areas. From the users perspective the only one
they see is total execution time so we will start by looking at that.
Total execution time from a users perspective consists of wall-clock time. At a process
level this is measured by running the time command. This provides you with real time (wallclock),
user code CPU and system code CPU. If user + sys > 80% then there is a good chance the system is
CPU constrained. The components of total running time include:
1. User-state CPU - the actual amount of time the CPU spends running the users program
in the user state. It includes time spent executing library calls, but does not include time spent
in the kernel on its behalf. This value can be greatly affected by the use of optimization at compile
time and by writing efficient code.
2. System-state CPU - this is the amount of time the CPU spends in the system state on behalf
of this program. All I/O routines require kernel services. The programmer can affect this value
by the use of blocking for I/O transfers.
3. I/O Time and Network Time - these are the amount of time spent moving data and servicing
I/O requests.
4. Virtual Memory Performance - This includes context switching and swapping.
5. Time spent running other programs.
In order to measure these areas there are a multitude of tools available. The most useful
are:
- cron Process scheduling
- nice/renice Change priorities
- setpri Set priorities
- netstat Network statistics
- nfsstat NFS statistics
- time/timex Process CPU Utilization
- uptime System Load Average
- ps Process Statistics
- iostat BSD tool for I/O
- sar Bulk System Activity
- vmstat BSD tool for V. Memory
- gprof Call Graph profiling
- prof Process Profiling
- trace Used to get more depth
Other commands that will be useful include lsvg, lspv, lslv, lsps and lsdev. Each of these
will be discussed below and then a general problem solving approach will be offered. It is important
to note that the results and options for all of these commands may differ depending on the platform
they are being run on. Most of the options discussed below are those for AIX and some of the tools
are specific to AIX such as:
- tprof CPU Usage
- svmon Memory Usage
- filemon Filesystem, LV .. activity
- netpmon Network resources
The first tool to be discussed is uptime. This provides the analyst with the System Load
Average (SLA). It is important to note that the SLA can only be used as a rough indicator as it
does not take into account scheduling priority and it counts as runnable all jobs waiting for disk
I/O, including NFS I/O. However, uptime is a good place to start when trying to determine whether
a bottleneck is CPU or I/O based.
When uptime is run it provides three load averages - the first is for the last minute,
the second is for the last 5 minutes and the third is for the last 15 minutes. If the value is borderline
but has been falling over the last 15 minutes, then it would be wise to just monitor the situation.
However, a value between 4 and 7 is fairly heavy and means that performance is being negatively
affected. Above 7 means the system needs serious review and below 3 means the workload is relatively
light. If the system is a single user workstation then the load average should be less than 2. There
is also a command called ruptime that allows you to request uptime information remotely.
The sar command provides a good alternative to uptime with the -q option. It provides statistics
on the average length of the run queue, the percentage of time the run queue is occupied, the average
length of the swap queue and the percentage of time the swap queue is occupied. The run queue lists
jobs that are in memory and runnable, but does not include jobs that are waiting for I/O or sleeping.
The run queue size should be less than 2. If the load is high and the runqocc=0 then the problem
is most likely memory or I/O, not CPU. The swap queue lists jobs that are ready to run but have
been swapped out.
The sar command deserves special mention as it is a very powerful command. The command
is run by typing in:
sar -options int #samples
where valid options generally are:
- -g or -p Paging
- -q Average Q length
- -u CPU Usage
- -w Swapping and Paging
- -y Terminal activity
- -v State of kernel tables
After determining that the problem may well be CPU based it would then be necessary to
move onto iostat to get more detail. Running iostat provides a great deal of information, but the
values of concern here are the %user and %sys. If (%user + %sys) > 80% over a period of time then
it is very likely the bottleneck is CPU. In particular it is necessary to watch for average CPU
being greater than 70% with peaks above 90%. It is also possible to get similar information by running
the ps -au or sar -u commands. Both of these provide information about CPU time. The sar -u command,
in particular, breaks the time down into user, system, time waiting for blocked I/O (i.e. NFS, disk,
..) and idle time.
The ps -au command also provides information on the %physical memory the process is using
and the current status for the process. Statuses shown are:
Status Meaning
- R Runnable
- T Stopped
- P Waiting on Pagein
- D Waiting on I/O
- S Sleeping < 20 secs
- I Idle - sleeping >20 secs
- Z Zombie or defunct
- W Process is swapped out
- > Mem. soft limit exceeded
- N Niced Process (low pri)
- < Niced Process (high pri)
The cron or at command can be used to automatically schedule execution of these commands
to ensure snapshots are taken at the appropriate times. The atq command can be used to list what
is in the at queue and the crontab -e command edits the cron table.
Once it has been determined that the problem is a CPU bottleneck there are several options.
It is possible to limit the cputime a process can use by the limit command. If the problem relates
to one process then it is also possible to model or profile that process using the prof, gprof or
tprof command to find out whether it is possible to optimize the program code.
Prof and gprof are very similar and have several disadvantages when compared to tprof.
Both prof and gprof require a recompile of the program using wither the -p or the -pg option and
they impact performance of that program very badly. Tprof only needs to be recompiled in order to
do source code level profiling (-qlist option). In particular tprof exhibits the following characteristics
(AIX only):
- No count of routine calls
- No call graph
- Source statement profiling
- Summary of all CPU usage
- No recompile needed for routine level profiling
- No increase in User CPU
- Prof/gprof differ as follows:
- Generally available
- Count of routine calls
- Call graph (gprof)
- Routine level profiling only
- Single Process CPU usage
- Recompile needed
- 10-300% increase in User CPU
So, the recommendation would be to use tprof if it is available on the chosen platform.
It is also possible that the vendor will have their own equivalent to tprof.
Running the time or timex commands can also give a good indication of whether the process
is CPU intensive. Compiler options have been proven to extensively affect the performance of CPU
intensive programs as can be seen from the table below. It is well worth trying different options
when compiling the program such as -O, -O2, -O3 and -Q (inline streams the code). Time/timex can
give you an indication of how much benefit this will provide. Timex can also be run using the -s
option which causes a full set of sar output to be generated for the duration of the programs execution.
As can be seen from the table below, it is possible to see reductions in the order of 50% in CPU
utilization by using optimization.
User CPU running Program phntest
Compiler Seconds % of CPU
Options for None
None 53.03 100%
-O 26.34 49.67%
-O -Q 25.11 47.35%
-O2 27.04 50.99%
-O2 -Q 24.92 46.99%
-O3 28.48 53.71%
-O3 -Q 26.13 49.27%
It is also possible to change the priority of the process so that other processes can gain
control of the CPU ahead of it. This can be done by using the nice, renice or setpri commands. Renice
is not available on all platforms. Before using these commands, it is useful to understand how the
priority scheme works in UNIX.
Priorities range from 0-127 with 127 being the lowest priority. The actual priority of
a task is set by the following calculation:
pri=nice+puser+(cpu/2)
Puser normally defaults to 40 and nice to 20 unless the nice or renice commands have been used
against the process. On AIX a tick is 1/100th of a second and new priorities are calculated every
tick as follows:
new-pri=(tick/2)+puser+nice
Every second tick is recalculated as tick=tick/2 and then new-pri is again recalculated.
Otherwise, a CPU upgrade may be the only solution if there is no other machine that the
workload can be run on.
If the problem does not appear to be CPU then it becomes necessary to investigate memory
and I/O as possible causes. Again, it is possible to use iostat or sar to get the information that
is needed here. The iowait field shown in the iostat command is a good indicator of whether there
are I/O problems. If iowait is greater than 40% then it becomes necessary to investigate the physical
volumes to ensure that none of them are greater than 70% full. The lspv command can be used to determine
utilization of the physical volume.
Iostat is a low overhead tool that can be automated and provides local counts for I/O data. Unlike
sar, iostat does not provide timestamps in the output so it is important to make a note of start/stop
times. However, iostat uses kernel data which makes it hardware specific with respect to the results
obtained.
Iostat provides data on several important values for each physical disk. These include:
%time the physical disk was busy, kilobytes per second to/from the disk, transfers per second to/from,
kilobytes read and kilobytes written. This will help to determine if there is an imbalance of I/O
amongst the physical volumes. If all appears to be normal here then the next step is to investigate
which filesystems the I/O is directed at. If most of the I/O is directed at the page files then
memory needs to be investigated.
Information on cylinder access and seek distances is available using the sadp command and cache
statistics for disk are available using the sar -b command. Further information can be obtained
by running filemon and looking to see what the most active filesystems are.
Filemon provides a list of the most active segments, the most active logical volumes and physical
volumes, and detailed statistics for the busiest files as well as the segments, physical and logical
volumes. Details include transfers, reads, read sizes, read times in msecs, logical seeks, write
times, seek distances, throughput (kb/sec) and utilization percentages. However, it is important
to note that filemon runs trace in the background which can affect performance. It is also possible
to run fileplace which gives information on space efficiency and sequentiality.
This would be a good time to run lsvg, lslv and lspv to get a map of the layout of the physical
and logical volumes on the system as well as the various volume groups. This will make it much simpler
to get more indepth information. By running lsdev -C it is also possible to determine what kind
of disk devices are installed and what size they are. By using a combination of the above commands
a map can be produced for each physical volume of the filesystems and their placement on the disk.
The lsattr -E -l sys0 command can be used to obtain information on system parameters such as cache
sizes and other associated values.
If the bulk of the I/O (>30%) is going to a logical volume or filesystem that is not used for
paging then the problem is most likely user I/O. This can be resolved by one of several options
-checking fragmentation, reorganizing the filesystem, adding physical volumes or splitting the data
in another manner. Adding memory may still help with the problem.
Other items to take into account when looking at I/O performance include the intra and inter
policies, mirroring of disks, write verify and the scheduling policy for logical volumes. It is
also important to remember that the SCSI card can only talk to one device at a time. Where multiple
disks are behind one SCSI card, sequential readwrites are helped if they are spread across multiple
adapters. Newer technologies such as SCSI-2, fast and wide and raid will also help improve performance.
Some of the newer controllers also provide buffers for each disk and can perform two way searches.
If the bulk of the I/O is going to paging (i.e. the page LV is > 30%) then it becomes necessary
to investigate further. The only options available to cure a paging problem are to write more memory
efficient code, move the process to another system, add memory, reschedule the process so it doesn't
contend with other memory intensive workloads, or add physical volumes or more page datasets. There
are three commands that are used to investigate paging - lsps (or pstat), vmstat and svmon.
lsps -a will provide information on all of the page spaces available including physical volume
and utilization. Vmstat is another low overhead tool and provides information on actual memory,
free pages, processes on the I/O waitq, reclaims, pageins, pageouts, pages freed by the stealer
per second, interrupts, system calls and CPU utilization. Like iostat, vmstat does not provide timestamps.
Svmon -G provides similar information except it breaks memory down into work, persistent and client
pages that are either in use or pinned. It is also possible to use the sar -w command.
When looking at paging it is important to note that the stealer will run whenever there
are only ((2 x real) -8) pages left. So on a 32mb machine the stealer will run if there are only
56 pages left. The Rule of Thumb for page space versus real memory is generally in the order of
Page = 2 x real. On some systems not all of the kernel processes are pinned so they can also be
paged out. A pagein rate of >5/sec means that the system is memory constrained. Also, if fre is
less than (.1(AVM)) then this may indicate that the system is real memory constrained. This depends
on the way the VMM uses memory. For instance, AIX will use all memory for disk caching, etc before
it reuses any so it is not unusual to see fre very low (110-120). Looking at pageins, pageouts,
and the FR to SR ratio is a much more meaningful indicator for problems.
So, if at this point there is no problem with CPU and the system is not disk bound it becomes
necessary to investigate the network to check whether it is remote file I/O bound. This is the last
step before running the more resource heavy trace command to determine what is really happening.
To look at network statistics there are three useful commands - netstat, netpmon and nfsstat.
Netstat -i shows the network interfaces along with input and output packets and errors.
It also gives the number of collisions. The Mtu field shows the maximum ip packet size (transfer
unit) and should be the same on all systems. In AIX it defaults to 1500. Both Oerrs (number of output
errors since boot) and Ierrs (Input errors since boot) should be < 0.025. If Oerrs>0.025 then it
is worth increasing the send queue size. Ierrs includes checksum errors and can also be an indicator
of a hardware error such as a bad connector or terminator. The Collis field shows the number of
collisions since boot and can be as high as 10%. If it is greater then it is necessary to reorganize
the network as the network is obviously overloaded on that segment.
Netstat -m s used to analyze the use of mbufs in order to determine whether these are the
bottleneck. The no -a command is used to see what the current values are. Values of interest are
thewall, lowclust, lowmbuf and dogticks.
An mbuf is a kernel buffer that uses pinned memory and is used to service network communications.
Mbufs come in two sizes - 256 bytes and 4096 bytes (clusters of 256 bytes). Thewall is the maximum
memory that can be taken up for mbufs. Lowmbuf is the minimum number of mbufs to be kept free while
lowclust is the minimum number of clusters to be kept free. Mb_cl_hiwat is the maximum number of
free buffers to be kept in the free buffer pool and should be set to at least twice the value of
lowclust to avoid thrashing.
Netstat -v is used to look at queues and other information. If Max packets on S/W transmit
queue is >0 and is equal to current HW transmit queue length then the send queue size should be
increased. If the No mbuf errors is large then the receive queue size needs to be increased.
Nfsstat is used to report on client and server NFS information, primarily at the daemon
level. Nfsstat -c provides client information such as retrans and badxid. If badxid=retrans and
retrans > 5% of calls the server is the problem, but if retrans > 5% of calls and badxid < retrans
then the network is the problem. Also, if there are lots of timeouts then it is useful to increase
the number of NFSDs and the qsize.
Netpmon is a further command that focuses on CPU, network adapters, remote nodes and LAN
traffic. It is used to get a feeling for what is happening overall. By using a combination of the
above commands it is possible to obtain a very clear view of what is happening at the network level.
At this point it is important to mention the UNIX kernel tables, as these can affect performance
without any real indicators as to the cause. To find out what they are set to the pstat -T or sar
-v commands can be used. Most of the values are calculated based on the value for maxusers so it
is important to know what that is set to. It is often recommended that maxusers generally be determined
by the following calculation:
Max Users = (2+ # users act + #NFS clients + .5 NFS exports )
In particular, attention should be paid to the following table sizes:
Process Table Size (NPROCS) - this is the maximum number of processes that can be
in the system. On systems where Xwindows is heavily used this needs to be increased. If the table
is full, then the process will fail to start.
Text Table Size (NTEXT) - This is the maximum number of executables that can be in the system
at a time. If the table is full then the exe will not run.
Inode Table Size (NINODE) - This is a cache of the active inode entries. If this table fills
up then performance slows down.
File Table Size (NFILE) - This is the maximum number of files that can be open at one time.
If the table fills up the open will fail.
Callout Table Size (NCALLOUT) - This is the maximum number of timers that can be active at
one time. Since timers are used heavily by device drivers to monitor I/O devices, the system will
crash if this table fills up.
General Default Calculations (may be platform Specific)
Field Calculation
Nproc 20+(8*maxusers)
Ntext 36+maxusers
Ninode Nproc+80+(13*maxusers)
Nfile 16*(Nproc+16+maxusers)/10+64
Ncallout 16+Nproc
Other kernel settings that should be reviewed are the number of processes per user, maximum
open files per user and maximum mounted filesystems. All of these can have unpredictable effects
on performance.
If none of the above provides a reasonable clue to what is going on it is necessary to
bring out the most powerful tool of all - trace. Trace will provide indepth information on everything
that is going on in the system. However, it will definitely affect performance and thus, should
be used judiciously.
As can be seen above there is a great deal of information that can be gleaned from the
system for relatively minimal effort. Figure 1 contains some of the Rules of Thumb (ROT) that are
useful along with what they apply to and the tool that best provides the information. These ROTs
can then be used as follows to diagnose and fix performance problems in UNIX systems.
So to reiterate: first iostat, sar and uptime are run to determine whether it appears to
be a CPU problem. If it is CPU then it is possible to try profiling, time/timex, optimization, priority
changing or a CPU upgrade. If the problem is not CPU then it is necessary to investigate for possible
I/O problems further using iostat, and then filemon, lsvg, lsdev, lsattr, lspv and lslv. I/O solutions
include adding disk space and reorganizing filesystems.
If the I/O breakdown indicates the problem is with paging (page lv>30%) then svmon, lsps
or pstat should be used. Possible solutions include adding memory or disk space. If the system does
not appear to be disk bound then it is time to check for remote file I/O problems using nfsstat,
netpmon and netstat. Finally, if none of these identify the problem it is time to resort to trace.
By taking such a structured approach to problem diagnosis it is possible to rapidly isolate
the problem area. Taking these measurements when the system is behaving normally is also a useful
option as this provides a baseline to compare future measurements with.
To do performance measurement properly it is helpful to automate the reporting process
using a scripting language (such as perl) combined with scheduling commands such as at or cron.
These languages can als be used to create graphical representations of the output from the tools.
By using the above mentioned tools and methodology, it is possible to diagnose performance
problems on most UNIX systems, using non-proprietary tools that come standard with the system.
References:
1. System Performance Tuning, Mike Loukides, O'Reilly and Associates
2. SC23-2365, Performance Monitoring and Tuning Guide, IBM
Here are a handful of helpful utilities for viewing and analyzing performance information for
your Linux system.
3/11/2010 -- When you're the system administrator, you must keep an eye on how well your Linux
system is performing by looking at information such as:
- Central Processing Unit (CPU) usage
- Physical memory usage
- Virtual memory (swap-space) usage
- Hard drive usage
Linux comes with a number of utilities that can be used to monitor one or more of these performance
parameters. The following sections introduce a few of these utilities and show how to understand
the information presented by them.
Using the Top UtilityTo view the top CPU processes - the ones that use most
of the CPU time - you can use the text mode top utility. To start that utility, type top
in a terminal window (or text console). The top utility then displays a text screen listing
the current processes arranged in the order of CPU usage, along with various other information,
such as memory and swap-space usage. The top utility updates the display every five seconds. If
you keep top running in a window, you can continually monitor the status of your Linux system. To
quit top, press Q, Ctrl+C or close the terminal window.
The first five lines of the output screen provide summary information about the system, arranged
in the following order:
- The first line shows the current time, how long the system has been up, how many users are
logged in and three load averages -- the average number of processes ready
to run during the last 1, 5, and 15 minutes.
- The second line lists the total number and status of processes.
- The third line shows CPU usage -- what percentage of CPU time is used by user processes,
what percentage by system (kernel) processes, and during what percentage of time the CPU is
idle.
- The fourth line shows how the physical memory is being used -- the total amount, how much
is used, how much is free and how much is allocated to buffers (for example, readings from the
hard drive).
- The fifth line shows how the virtual memory (or swap space) is being used -- the total amount
of swap space, how much is used, how much is free, and how much is being cached.
The table that appears below lists information about the current processes, arranged in decreasing
order by amount of CPU time used. It also summarizes the meanings of the column headings in the
table the top displays.
Meanings of Column Headings in top Utility's Output
Heading |
Meaning |
| PID |
The process ID of the process |
| USER |
Username of the running process |
| PR |
Priority of the process |
| NI |
Nice value of the process - the value ranges from -20 (highest
priority) to 19 (lowest priority) and the default is 0. (The nice value represents
the relative priority of the process. The higher the value the lower the priority and the
nicer the process - because it yields to other processes) |
| VIRT |
The total amount (in kilobytes) of virtual memory used
by the process |
| RES |
Total physical memory used by a task (typically shown in kilobytes,
with an m suffix indicating megabytes) |
| SHR |
Amount of shared memory used by process |
| S |
State of the process (S for sleeping, D for uninterruptible
sleep, R for running, Z for zombies - processes that should be dead but
are still running - or T for stopped) |
| %CPU |
Percentage of CPU time used since last screen update |
| %MEM |
Percentage of physical memory used by the process |
| TIME+ |
Total CPU time the process has used since it started |
| COMMAND |
Shortened form of the command that started the process |
Using the Uptime Command
Use the uptime command to get a summary of the system's state by typing the following command:
uptime
It displays output similar to the following:15:03:21 up 32 days, 57 min, 3 users, load average: 0.13, 0.23, 0.27
This output shows the current time, how long the system has been up, the number of users and (finally)
the three load averages -- the average number of processes that were ready to run in
the past 1, 5, and 15 minutes. Load averages greater than 1 imply that many processes are
competing for CPU time simultaneously.
The load averages give you an indication of how busy the system is.
Using the Vmstat Utility
Receive summary information about the overall system usage with the vmstat utility. To
view system usage information averaged over 5-second intervals, type the following command (the
second argument indicates the total number of lines of output vmstat displays):
vmstat 5 8
Output similar to the following listing will be displayed:procs -----------memory---------- ---swap-- -----io---- --system-- ----cpu----
r b swpd free buff cache si so bi bo in cs us sy id wa
0 0 31324 4016 18568 136004 1 1 17 16 8 110 33 4 61 1
0 1 31324 2520 15348 139692 0 0 7798 199 1157 377 8 8 6 78
1 0 31324 1584 12936 141480 0 19 5784 105 1099 437 12 5 0 82
2 0 31324 1928 13004 137136 7 0 1586 138 1104 561 43 6 0 51
3 1 31324 1484 13148 132064 0 0 1260 51 1080 427 50 5 0 46
0 0 31324 1804 13240 127976 0 0 1126 46 1082 782 19 5 47 30
0 0 31324 1900 13240 127976 0 0 0 0 1010 211 3 1 96 0
0 0 31324 1916 13248 127976 0 0 0 10 1015 224 3 2 95 0
The first line of output shows the averages since the last reboot. After that, vmstat displays
the 5-second average data seven more times, covering the next 35 seconds. The tabular output is
grouped as six categories of information, indicated by the fields in the first line of output. The
second line shows further details for each of the six major fields. You can interpret these fields
using the following table:
Meaning of Fields in the vmstat Utility's Output
| Field Name |
Description |
| procs |
Number of processes and their types: r = processes waiting
to run, b = processes in uninterruptible sleep, w = processes swapped out but ready to run |
| memory |
Information about physical memory and swap-space usage (all
numbers in kilobytes): swpd = virtual memory used, free = free physical memory, buff = memory
used as buffers, cache = virtual memory that's cached |
| swap |
Amount of swapping (the numbers are in kilobytes per second):
si = amount of memory swapped in from disk, so = amount of memory swapped to disk |
| io |
Information about input and output. (The numbers are in blocks
per second where the block size depends on the disk device.) bi = rate of blocks sent to
disk, bo = rate of blocks received from disk |
| system |
Information about the system: in = number of interrupts per
second (including clock interrupts), cs = number of context switches per second
- - how many times the kernel changed which process was running |
| cpu |
Percentages of CPU time used: us = percentage of CPU time used
by user processes, sy = percentage of CPU time used by system processes, id = percentage
of time CPU is idle, wa = time spent waiting for input or output (I/O) |
In the vmstat utility's output, high values in the si and so fields indicate too much swapping
(the copying of information between physical memory and the virtual memory on the hard drive). High
numbers in the bi and bo fields indicate too much disk activity.
Network Monitoring with Ifstat
The ifstat utility is to network interface activity what iostat is to device I/O and CPU activity.
You can use it to display activity on one or more network interfaces. When you run ifstat without
any arguments or options, it will display the traffic for your standard network interfaces. You
can specify one or more interfaces, and add a few options to make the results easier to read and
work with.
If you're running ifstat on a system that has unused or idle interfaces, use ifstat -z to hide interfaces
that are idle (for example, a system with VMware that may not be using all the vmnet interfaces
at the time).
To see all the bandwidth being pushed by a system, the -T option tells ifstat to display a total
of all interfaces in addition to the individual tallies. To add a timestamp at the beginning of
each line, use -t. By default the information is updated every second. If you want to crank this
down a bit, you can specify a delay by adding a number at the end of the command. So, ifstat -Tt
3 will give you a display with the count updated every three seconds, and a total tally at the end
of the display.
Finally, if you only want ifstat to run a few times, you can specify a second number to tell it
to repeat that many times. To update 10 times, for example, you might use ifstat -tT 5 10 to get
10 updates five seconds apart. Generally speaking, ifstat is easy to use and get started with.
For Suse 11 Simply type "yum install iotop". Iotop is licensed under the terms of the
GNU GPL. The latest version is
Iotop 0.3.2 (NEWS), available here
: iotop-0.3.2.tar.bz2
or iotop-0.3.2.tar.gz.
Freshmeat project page to stay informed:
http://freshmeat.net/projects/iotop.
Linux kernel 2.6.20 and later supports per process I/O accounting. You can access every process/thread's
I/O read/write values by using /proc filesystem. You can check if your kernel has built with I/O
account by just simply checking /proc/self/io file. If it exists then you have I/O accounting built-in.
$ cat /proc/self/io
rchar: 3809
wchar: 0
syscr: 10
syscw: 0
read_bytes: 0
write_bytes: 0
cancelled_write_bytes: 0
Field Descriptions:

rchar  - bytes read
wchar  - byres written
syscr  - number of read syscalls
syscw  - number of write syscalls
read_bytes  - number of bytes caused by this process to  read
            from underlying storage
write_bytes - number of bytes caused by this process to written from
            underlying storage
As you know, ever process is presented by it's pid number under /proc directory. You can access
any process's I/O accounting values by just looking /proc/#pid/io file. There is a utility called
iotop which collects these values and
shows you in like top utility. You see your processes I/O activity with iotop utility.
Abstract Over the past few years, Linux has made its way into the data centers of many corporations
all over the globe. The Linux operating system has become accepted by both the scientific and enterprise
user population. Today, Linux is by far the most versatile operating system. You can find Linux
on embedded devices such as firewalls and cell phones and mainframes. Naturally, performance of
the Linux operating system has become a hot topic for both scientific and enterprise users. However,
calculating a global weather forecast and hosting a database impose different requirements on the
operating system. Linux has to accommodate all possible usage scenarios with the most optimal performance.
The consequence of this challenge is that most Linux distributions contain general tuning parameters
to accommodate all users.IBM® has embraced Linux, and it is recognized as an operating system
suitable for enterprise-level applications running on IBM systems. Most enterprise applications
are now available on Linux, including file and print servers, database servers, Web servers, and
collaboration and mail servers.
With use of Linux in an enterprise-class server comes the need to monitor performance and, when
necessary, tune the server to remove bottlenecks that affect users. This IBM Redpaper describes
the methods you can use to tune Linux, tools that you can use to monitor and analyze server performance,
and key tuning parameters for specific server applications. The purpose of this redpaper is to understand,
analyze, and tune the Linux operating system to yield superior performance for any type of application
you plan to run on these systems.
The tuning parameters, benchmark results, and monitoring tools used in our test environment were
executed on Red Hat and Novell SUSE Linux kernel 2.6 systems running on IBM System x servers and
IBM System z servers. However, the information in this redpaper should be helpful for all Linux
hardware platforms.
Update 4/2008: Typos corrected
A couple of days before Halloween I gave a talk titled "Little Shop of Performance Horrors" at the
Front Range OpenSolaris User Group (FROSUG), in Denver, Colorado. The title was suggested to me,
which inspired me to talk about things going wrong in the field of system performance. We had a
great turnout, despite the talk happening during one of the worst snow storms of the year.For
the talk, I listed different performance problems and gave an example or two of each, including
many lessons that were learnt the hard way.
Horrific Topics:
- The worst perf issues I've ever seen!
- Common misconfigurations
- The encyclopedia of poor assumptions
- Unbelievably bad perf analysis
- Death by complexity
- Bad benchmarking
- Misleading analysis tools
- Insane performance tuning
- The curse of the unexpected
The slides are
here. I'll revisit the slides when I have a chance and add more content; as this was the first
time I give this talk, several more topics sprung to mind during the actual talk which there aren't
slides for.
Despite speaking for about 2.5 hours, the entire talk was videoed and has already been posted
on Sun Video, which I've included below.
Part 1/3
Part 2/3
Part 3/3
09.30.2008
You've just had your first cup of coffee and have received that dreaded phone call. The system
is slow. What are you going to do? This article will discuss performance bottlenecks and optimization
in Red Hat Enterprise Linux (RHEL5).
Before getting into any monitoring or tuning specifics, you should always use some kind of tuning
methodology. This is one which I've used successfully through the years:
1. Baseline – The first thing you must do is establish a baseline, which is a snapshot
of how the system appears when it's performing well. This baseline should not only compile data,
but also document your system's configuration (RAM, CPU and I/O). This is necessary because you
need to know what a well-performing system looks like prior to fixing it.
2. Stress testing and monitoring – This is the part where you monitor and stress your systems
at peak workloads. It's the monitoring which is key here – as you cannot effectively tune anything
without some historic trending data.
3. Bottleneck identification – This is where you come up with the diagnosis for what
is ailing your system. The primary objective of section 2 is to determine the bottleneck. I like
to use several monitoring tools here. This allows me to cross-reference my data for accuracy.
4. Tune – Only after you've identified the bottleneck can you tune it.
5. Repeat – Once you've tuned it, you can start the cycle again – but this time start
from step 2 (monitoring) – as you already have your baseline.
It's important to note that you should only make one change at a time. Otherwise, you'll never
know exactly what impacted any changes which might have occurred. It is only by repeating your tests
and consistently monitoring your systems that you can determine if your tuning is making an impact.
RHEL monitoring tools
Before we can begin to improve the performance of our system, we need to use the monitoring tools
available to us to baseline. Here are some monitoring tools you should consider using:
OprofileThis tool
(made available in RHEL5) utilizes the processor to retrieve kernel system information about system
executables. It allows one to collect samples of performance data every time a counter detects an
interrupt. I like the tool also because it carries little overhead –
which is very important because you don't want monitoring tools to be causing system bottlenecks.
One important limitation is that the tool is very much geared towards finding problems with CPU
limited processes. It does not identify processes which are sleeping or waiting on I/O.
The steps used to start up Oprofile include setting up the profiler, starting it and then dumping
the data.
First we'll set up the profile. This option assumes that one wants to monitor the kernel.
# opcontrol --setup –vmlinux=/usr/lib/debug/lib/modules/'uname -r'/vmlinux
Then we can start it up.
# opcontrol --start
Finally, we'll dump the data.
# opcontrol --stop/--shutdown/--dump
SystemTap
This tool (introduced in RHEL5) collects data by analyzing the running kernel. It really helps
one come up with a correct diagnosis of a performance problem and is tailor-made for developers.
SystemTap eliminates the need for the developer to go through the recompile and reinstallation process
to collect data.
FryskThis is another tool which
was introduced by Red Hat in RHEL5. What does it do for you? It allows both developers and system
administrators to monitor running processes and threads. Frysk differs from Oprofile in that it
uses 100% reliable information (similar to SystemTap) - not just a sampling of data. It also runs
in user mode and does not require kernel modules or elevated privileges. Allowing one to stop or
start running threads or processes is also a very useful feature.
Some more general Linux tools include
top
and vmstat. While these
are considered more basic, often I find them much more useful than more complex tools. Certainly
they are easier to use and can help provide information in a much quicker fashion.
Top provides a quick snapshot of what is going on in your system – in a friendly character-based
display. 
It also provides information on CPU, Memory and Swap Space.
Let's look at vmstat – one of the oldest but more important Unix/Linux tools ever created.
Vmstat allows one to get a valuable snapshot of process, memory, sway I/O and overall CPU utilization.
Now let's define some of the fields:
Memory
swpd – The amount of virtual memory
free – The amount of free memory
buff – Amount of memory used for buffers
cache – Amount of memory used as page cache
Process
r – number of run-able processes
b – number or processes sleeping. Make sure this number does not exceed the amount of run-able
processes, because when this condition occurs it usually signifies that there are performance problems.
Swap
si – the amount of memory swapped in from disk
so – the amount of memory swapped out.
This is another important field you should be monitoring – if you are swapping out data, you will
likely be having performance problems with virtual memory.
CPU
us – The % of time spent in user-level code.
It is preferable for you to have processes which spend more time in user code rather than system
code. Time spent in system level code usually means that the process is tied up in the kernel rather
than processing real data.
sy – the time spent in system level code
id – the amount of time the CPU is idle wa – The amount of time the system is spending waiting for
I/O.
If your system is waiting on I/O – everything tends to come to a halt. I start to get worried when
this is > 10.
There is also:
Free – This tool provides memory information, giving you data around the total amount of free
and used physical and swap memory.
Now that we've analyzed our systems – lets look at what we can do to optimize and tune our systems.
CPU Overhead – Shutting Running Processes
Linux starts up all sorts of processes which are usually not required. This includes processes such
as autofs, cups, xfs, nfslock and sendmail. As a general rule, shut down anything that isn't explicitly
required. How do you do this? The best method is to use the chkconfig command.
Here's how we can shut these processes down.
[root ((Content component not found.)) _29_140_234 ~]# chkconfig --del xfs
You can also use the GUI - /usr/bin/system-config-services to shut down daemon process.
Tuning the kernel
To tune your kernel for optimal performance, start with:
sysctl – This is the command we use for changing kernel parameters. The parameters themselves
are found in /proc/sys/kernel
Let's change some of the parameters. We'll start with the msgmax parameter. This parameter
specifies the maximum allowable size of a single message in an IPC message queue. Let's view how
it currently looks.
[root ((Content component not found.)) _29_139_52 ~]# sysctl kernel.msgmax

	kernel.msgmax = 65536

	[root ((Content component not found.)) _29_139_52 ~]#
There are three ways to make these kinds of kernel changes. One way is to change this using the
echo command.
[root ((Content component not found.)) _29_139_52 ~]# echo 131072 >/proc/sys/kernel/msgmax

	[root ((Content component not found.)) _29_139_52 ~]# sysctl kernel.msgmax

	kernel.msgmax = 131072

	[root ((Content component not found.)) _29_139_52 ~]#
Another parameter that is changed quite frequently is SHMMAX, which is used to define
the maximum size (in bytes) for a shared memory segment. In Oracle this should be set large enough
for the largest SGA size. Let's look at the default parameter:
# sysctl kernel.shmmax

	kernel.shmmax = 268435456
This is in bytes – which translates to 256 MG. Let's change this to 512 MG, using the -w flag.
[root ((Content component not found.)) _29_139_52 ~]# sysctl -w kernel.shmmax=5368709132

	kernel.shmmax = 5368709132

	[root ((Content component not found.)) _29_139_52 ~]#
The final method for making changes is to use a text editor such as vi – directly editing
the /etc/sysctl.conf file to manually make our changes.
To allow the parameter to take affect dynamically without a reboot, issue the sysctl command
with the -p parameter.
Obviously, there is more to performance tuning and optimization than we can discuss in the context
of this small article – entire books have been written on Linux performance tuning. For those of
you first getting your hands dirty with tuning, I suggest you tread lightly and spend time working
on development, test and/or sandbox environments prior to deploying any changes into production.
Ensure that you monitor the effects of any changes that you make immediately; it's imperative to
know the effect of your change. Be prepared for the possibility that fixing your bottleneck has
created another one. This is actually not a bad thing in itself, as long as your overall performance
has improved and you understand fully what is happening.
Performance monitoring and tuning is a dynamic process which does not stop after you have fixed
a problem. All you've done is established a new baseline. Don't rest on your laurels, and understand
that performance monitoring must be a routine part of your role as a systems administrator.
About the author: Ken Milberg is a systems consultant with two decades of experience
working with Unix and Linux systems. He is a SearchEnterpriseLinux.com Ask the Experts advisor and
columnist.
[Feb 23, 2009]
Deployment_Guide/Gathering System Information
Before you learn how to configure your system, you should learn how to gather essential system>
information. For example, you should know how to find the amount of free memory, the amount of available
hard drive space, how your hard drive is partitioned, and what processes are running. This chapter
discusses how to retrieve this type of information from your Red Hat Enterprise Linux system using
simple commands and a few simple programs.
1. System Processes
The
ps ax command displays
a list of current system processes, including processes owned by other users. To display the owner
alongside each process, use the ps aux
command. This list is a static list; in other words, it is a snapshot
of what was running when you invoked the command. If you want a constantly updated list of running
processes, use top as described
below. The ps output can
be long. To prevent it from scrolling off the screen, you can pipe it through less:
ps aux | less
You can use the
ps command
in combination with the grep
command to see if a process is running. For example, to determine if
Emacs is running, use the following command:
ps ax | grep emacs
The
top command displays
currently running processes and important information about them including their memory and CPU
usage. The list is both real-time and interactive. An example of output from the
top command is provided as follows:
To exit top press the q key. Useful interactive commands that you can use:
Immediately refresh the display
h
Display a help screen
k
Kill a process. You are prompted for the
process ID and the signal to send to it.
n Change the number of processes displayed.
You are prompted to enter the number.
u Sort by user.
M Sort by memory usage.
P Sort by CPU usage.
For more information, refer to the top(1)
manual page.
The short summary of our study indicates that there is no SINGLE answer to which I/O scheduler
is best. The good news is that with Red Hat Enterprise Linux 4 an end-user can customize their scheduler
with a simple boot option. Our data suggests the default Red Hat Enterprise Linux 4 I/O scheduler,
CFQ, provides the most scalable algorithm for the widest range of systems, configurations, and commercial
database users. However, we have also measured other workloads whereby the Deadline scheduler out-performed
CFQ for large sequential read-mostly DSS queries. Other studies referenced in the section "References"
explored using the AS scheduler to help interactive response times. In addition, noop has proven
to free up CPU cycles and provide adequate I/O performance for systems with intelligent I/O controller
which provide their own I/O ordering capabilities.
In conclusion, we recommend baselining an application with the default CFQ. Use this article
and its references to match your application to one of the studies. Then adjust the I/O scheduler
via the simple command line re-boot option if seeking additional performance. Make only one change
at a time, and use performance tools to validate the results.
Articles -
Kernel Tuning
vm.swappiness is a tunable kernel parameter that controls how much the kernel favors swap over
RAM. At the source code level, it's also defined as the tendency to steal mapped memory.
A high swappiness value means that the kernel will be more apt to unmap mapped pages. A low
swappiness value means the opposite, the kernel will be less apt to unmap mapped pages. In
other words, the higher the vm.swappiness value, the more the system will swap.
The default value I've seen on both enterprise level Red Hat and SLES servers is 60.
To find out what the default value is on a particular server, run:
sysctl vm.swappinessThe value is also located in /proc/sys/vm/swappiness.
What reason might there be to change the value of this parameter? Like all other tunable kernel
parameters, there may not be a compelling reason to change the default value, but having a facility
that allows one to manipulate how the linux kernel behaves without modifying source code is indispensable.
If there were reasons to change the vm.swappiness kernel parameter, one might be to decrease
the parameter if swapping is undesirable. I've seen enterprise configurations where servers
had a swap to RAM ratio of 1:125. It's evident in this case that there is no interest in ever
using anything but physical memory so why not make the kernel privy to this information. Whether
the vm.swappiness parameter is set to 0, 20, 40, or any other value, the owner of the server should
perform due diligence to see what affect this has on the server and applications. For an under-the-cover
look on the effect of changing the parameter, one only needs to look at the vmscan.c source file
and the swap_tendency algorithm.
swap tendency = mapped_ratio / 2 + distress + vm_swappiness;
On the flip side, one may consider increasing the vm.swappiness parameter greater than the default
if a particular system has physical memory contraints.
"Systems with memory constraints that run batch jobs (processes that sleep for long time) might
benefit from an aggressive swapping behavior."
http://unixfoo.blogspot.com/2007/11/linux-performance-tuning.html
Andrew Morton sets his workstation vm.swappiness parameter to 100. "My point is that decreasing
the tendency of the kernel to swap stuff out is wrong. You really don't want hundreds of megabytes
of BloatyApp's untouched memory floating about in the machine. Get it out on the disk, use the memory
for something useful."
The following is an excerpt of a benchmark obtained using different vm.swappiness values while
performing dd on a 2.6.5-7.97-default kernel (http://lwn.net/Articles/100978/):
| vm.swappiness |
Total I/O |
Avg Swap |
| 0 |
273.57 MB/s |
0 MB |
| 20 |
273.75 MB/s |
0 MB |
| 40 |
273.52 MB/s |
0 MB |
| 60 |
229.01 MB/s |
23068 MB |
| 80 |
195.63 MB/s |
25587 MB |
| 100 |
184.30 MB/s |
26006 MB |
To read more information on the vm.swappiness kernel tunable, you may find these links helpful.
swapping and the value of /proc/sys/vm/swappiness
Linux
performance tuning - /proc/sys/vm/swappiness
About:
Sysprof is a sampling CPU profiler that uses a Linux kernel module to profile the entire system,
not just a single application. It handles shared libraries, and applications do not need to be recompiled.
It profiles all running processes, not just a single application, has a nice graphical interface,
shows the time spent in each branch of the call tree, can load and save profiles, and is easy to
use.
Release focus: Minor bugfixes
Changes:
This version compiles with recent kernels.
Author:
Søren Sandmann [contact developer]
The kernel summit was two weeks ago, and at the end of that I got one of the new 80GB solid state
disks from Intel. Since then, I've been wanting to talk to people about it because I'm so impressed
with it, but at the same time I don't much like using the kernel mailing list as some kind of odd
public publishing place that isn't really kernel-related, so since I'm testing this whole blogging
thing, I might as well vent about it here.
That thing absolutely rocks.
I've been impressed by Intel before (Core 2), but they've had their share of total mistakes and
idiotic screw-ups too (Itanic), but the things Intel tends to have done well are the things where
they do incremental improvements. So it's a nice thing to be able to say that they can do new things
very well too. And while I often tend to get early access to technology, seldom have I looked forward
to it so much, and seldom have things lived up to my expectations so well.
In fact, I can't recall the last time that a new tech toy I got made such a dramatic difference
in performance and just plain usability of a machine of mine.
So what's so special about that Intel SSD, you ask? Sure, it gets up to 250MB/s reads and 70MB/s
writes, but fancy disk arrays can certainly do as well or better. Why am I not gushing about soem
nice NAS box? I didn't even put the thing into a laptop, after all, it's actually in Tove's Mac
Mini (running Linux, in case anybody was confused ;), so a RAID NAS box would certainly have been
a lot bigger and probably have more features.
But no, forget about the throughput figures. Others can match - or at last come close - to the throughput,
but what that Intel SSD does so well is random reads and writes. You can do small random accesses
to it and still get great performance, and quite frankly, that's the whole point of not having some
stupid mechanical latencies as far as I'm concerned.
And the sad part is that other SSD's generally absolutely suck when it comes to especially random
write performance. And small random writes is what you get when you update various filesystem meta-data
on any normal filesystem, so it really does matter. For example, a vendor who shall remain nameless
has an SSD disk out there that they were also hawking at the Kernel Summit, and while they get fine
throughput (something like 50+MB/s on big contiguous writes), they benchmark a pitiful 10 (yes,
that's ten, as in "how many fingers do you have) small random writes per second. That is slower
than a rotational disk.
In contrast, the Intel SSD does about 8,500 4kB random writes per second. Yeah, that's over eight
thousand IOps on random write accesses with a relevant block size, rather than some silly and unrealistic
contiguous write test. That's what I call solid-state media.
The whole thing just rocks. Everything performs well. You can put that disk in a machine, and suddenly
you almost don't even need to care whether things were in your page cache or not. Firefox starts
up pretty much as snappily in the cold-cache case as it does hot-cache. You can do package installation
and big untars, and you don't even notice it, because your desktop doesn't get laggy or anything.
So here's the deal: right now, don't buy any other SSD than the Intel ones, because as far as I
can tell, all the other ones are pretty much inferior to the much cheaper traditional disks, unless
you never do any writes at all (and turn off 'atime', for that matter).
So people - ignore the manufacturer write throughput numbers. They don't mean squat. The fact that
you may be able to push 50MB/s to the SSD is meaningless if that can only happen when you do big,
aligned, writes.
If anybody knows of any reasonable SSDs that work as well as Intel's, let me know.
sarvant analyzes files from the sysstat utility "sar" and produces graphs of the collected data
using gnuplot. It supports user-defined data source collection, debugging, start and end times,
interval counting, and output types (Postscript, PDF, and PNG). It's also capable of using gnuplot's
graph smoothing capability to soften spiked line graphs. It can analyze performance data over both
short and long periods of time.
You will find here a tutorial describing a few use cases for some sysstat commands. The first
section below concerns the sar and sadf commands. The second one concerns the pidstat command. Of
course, you should really have a look at the manual pages to know all the features and how these
commands can help you to monitor your system (follow the
Documentation
link above for that).
- Section 1: Using sar and sadf
- Section 2: Using pidstat
Section 1: Using sar and sadf
sar is the system activity reporter. By interpreting the reports that sar produces, you can locate
system bottlenecks and suggest some possible solutions to those annoying performance problems.
The Linux kernel maintains internal counters that keep track of requests, completion times, I/O
block counts, etc. From this and other information, sar calculates rates and ratios that give insight
into where the bottlenecks are.
The key to understanding sar is that it reports on system activity over a period of time. You must
take care to collect sar data at an appropriate time (not at lunch time or on weekends, for example).
Here is one way to invoke sar:
sar -u -o datafile 2 3
The -u option specifies our interest in the CPU subsystem. The -o option will create an output file
that contains binary data. Finally, we will take 3 samples at two-second intervals. Upon completion
of the sampling, sar will report the results to the screen. This provides us with a snapshot of
current system activity.
The above example uses sar in interactive mode. You can also invoke sar from cron. In this case,
cron would run the /usr/lib/sa/sa1 shell script and create a daily log file. The /usr/lib/sa/sa2
shell script is run to format the log into human-readable form. These scripts may be invoked by
a crontab run by root (although I prefer to use adm). Here is the crontab, located in /etc/cron.d
directory and using Vixie cron syntax, that makes this happen:
# Run system activity accounting tool every 10 minutes
*/10 * * * * root /usr/lib/sa/sa1 -d 1 1
# 0 * * * * root /usr/lib/sa/sa1 -d 600 6 &
# Generate a daily summary of process accounting at 23:53
53 23 * * * root /usr/lib/sa/sa2 -A
In reality, the sa1 script initiates a related utility called sadc. sa1 gives sadc several arguments
to specify the amount of time to wait between samples, the number of samples, and the name of a
file into which the binary results should be written.
A new file is created each day so that we can easily interpret daily results. The sa2 script
calls sar, which formats the binary data into human-readable form.
Let's think of our system as being composed of three interdependent subsystems: CPU, disk and
memory. Our goal is to find out which subsystem is responsible for any performance bottleneck. By
analyzing sar's output, we can achieve that goal.
Listing below represents the report produced by initiating the sar -u command. Initiating sar
in this manner produces a report from the daily log file produced by sadc.
| Linux 2.6.8.1-27mdkcustom (localhost) 03/29/2006
09:00:00 PM CPU %user
%nice %system %iowait %steal
%idle
09:10:00 PM all 96.18
0.00 0.42 0.00
0.00 3.40
09:20:00 PM all 97.99
0.00 0.36 0.00
0.00 1.65
09:30:00 PM all 97.59
0.00 0.38 0.00
0.00 2.03
... |
The %user and %system columns simply specify the amount of time the CPU spends in user and system
mode. The %iowait and %idle columns are of interest to us when doing performance analysis. The %iowait
column specifies the amount of time the CPU spends waiting for I/O requests to complete. The %idle
column tells us how much useful work the CPU is doing. A %idle time near zero indicates a CPU bottleneck,
while a high %iowait value indicates unsatisfactory disk performance.
Additional information can be obtained by the sar -q command, which displays the run queue length,
total number of processes, and the load averages for the past one, five and fifteen minutes:
| Linux 2.6.8.1-27mdkcustom (localhost) 03/29/2006
09:00:00 PM runq-sz plist-sz ldavg-1 ldavg-5
ldavg-15
09:10:00 PM 2
121 2.22 2.17
1.45
09:20:00 PM 6
137 2.79 2.48
1.73
09:30:00 PM 5
129 3.31 2.83
1.95
... |
This example shows that the system is busy (since more than one process is runnable at any given
time) and rather overloaded.
sar also lets you monitor memory utilization. Have a look at the following example produced by sar
-r:
| Linux 2.6.8.1-27mdkcustom (localhost) 03/29/2006
09:00:00 PM kbmemfree kbmemused %memused kbbuffers kbcached kbswpfree kbswpused
%swpused kbswpcad
09:10:00 PM 591468 444388 42.90
19292 227412 1632920
0 0.00 0
09:20:00 PM 546860 488996 47.21
21844 243900 1632920
0 0.00 0
09:30:00 PM 538268 497588 48.04
25308 267228 1632920
0 0.00 0
... |
This listing shows that the system has plenty of free memory. Swap space is not used. So memory
is not a problem here. You can double-check this by using sar -W to get swapping statistics:
| Linux 2.6.8.1-27mdkcustom (localhost) 03/29/2006
09:00:00 PM pswpin/s pswpout/s
09:10:00 PM 0.00 0.00
09:20:00 PM 0.00 0.00
09:30:00 PM 0.00 0.00
... |
sar can also help you to monitor disk activity. sar -b displays I/O and transfer rate statistics
grouped for all block devices:
| Linux 2.6.8.1-27mdkcustom (localhost) 03/29/2006
09:00:00 PM tps rtps
wtps bread/s bwrtn/s
09:10:00 PM 6.37 2.32
4.05 126.84 61.41
09:20:00 PM 4.03 0.74
3.29 54.49 46.04
09:30:00 PM 6.71 3.11
3.59 80.13 49.18
... |
sar -d enables you to get more detailed information on a per device basis. It displays statistics
data similar to those displayed by iostat:
| Linux 2.6.8.1-27mdkcustom (localhost)
03/29/2006
09:00:00 AM DEV
tps rd_sec/s wr_sec/s avgrq-sz avgqu-sz
await svctm %util
09:10:00 AM sda 0.00
0.00 0.00 0.00
0.00 0.00 0.00
0.00
09:10:00 AM sdb 18.09
0.00 160.80 8.89
0.01 0.67 0.19
0.35
09:20:00 AM sda 2.51
0.00 52.26 20.80
0.00 0.60 0.40
0.10
09:20:00 AM sdb 18.91
0.00 141.29 7.47
0.02 0.92 0.21
0.40
09:30:00 AM sda 26.87
11.94 291.54 11.30
0.12 4.33 1.07
2.89
09:30:00 AM sdb 7.00
0.00 54.00 7.71
0.00 0.50 0.14
0.10
... |
sar has numerous other options that enable you to gather statistics for every part of your system.
You will find useful information about them in the manual page.
OK. As a last example, let's show how the sadf command can help us to produce some graphs.
We use the command sar -B to display paging statistics from daily data file sa29 (see example below).
# sar -B -f /var/log/sa/sa29
Linux 2.6.8.1-27mdkcustom (localhost) 03/29/2006
09:00:00 PM pgpgin/s pgpgout/s fault/s majflt/s
09:10:00 PM 63.42 30.71
267.35 0.45
09:20:00 PM 27.25 23.02
281.88 0.26
09:30:00 PM 40.06 24.59
246.51 0.32
09:40:00 PM 43.58
26.11 265.25 0.34
09:50:00 PM 34.12 28.38
271.54 0.37
Average: 41.69 26.56
266.51 0.35 |
sadf -d extracts data in a format that can be easily ingested by a relational database:
# sadf -d /var/log/sa/sa29 -- -B
localhost;601;2006-03-29 19:10:00 UTC;63.42;30.71;267.35;0.45
localhost;00;2006-03-29 19:20:00 UTC;27.25;23.02;281.88;0.26
localhost;600;2006-03-29 19:30:00 UTC;40.06;24.59;246.51;0.32
localhost;600;2006-03-29 19:40:00 UTC;43.58;26.11;265.25;0.34
localhost;600;2006-03-29 19:50:00 UTC;34.12;28.38;271.54;0.37 |
If we saw this as a text file, both Excel and Open Office will allow us to specify a semicolon as
a field delimiter. Then we can generate our performance report and graph.
Section 2: Using pidstat
The pidstat command is used to monitor processes and threads currently being managed by the Linux
kernel. It can also monitor the children of those processes and threads.
With its -d option, pidstat can report I/O statistics, providing that you have a recent Linux kernel
(2.6.20+) with the option CONFIG_TASK_IO_ACCOUNTING compiled in. So imagine that your system is
undergoing heavy I/O and you want to know which tasks are generating them. You could then enter
the following command:
$ pidstat -d 2
Linux 2.6.20 (localhost) 09/26/2007
10:13:31 AM PID kB_rd/s kB_wr/s
kB_ccwr/s Command
10:13:31 AM 15625 1.98 16164.36
0.00 dd
10:13:33 AM PID kB_rd/s kB_wr/s
kB_ccwr/s Command
10:13:33 AM 15625 4.00 20556.00
0.00 dd
10:13:35 AM PID kB_rd/s kB_wr/s
kB_ccwr/s Command
10:13:35 AM 15625 0.00 10642.00
0.00 dd
... |
This report tells us that there is only one task (a "dd" command with PID 15625) which is responsible
for these I/O.
When no PID's are explicitly selected on the command line (as in the case above), the pidstat command
examines all the tasks managed by the system but displays only those whose statistics are varying
during the interval of time. But you can also indicate which tasks you want to monitor. The following
example reports CPU statistics for PID 8197 and all its threads:
$ pidstat -t -p 8197 1 3
Linux 2.6.8.1-27mdkcustom (localhost) 09/26/2007
10:40:05 AM PID
TID %user %system %CPU CPU Command
10:40:06 AM 8197
- 71.29 1.98 73.27
0 procthread
10:40:06 AM -
8197 71.29 1.98 73.27
0 |__procthread
10:40:06 AM -
8198 0.00 0.99 0.99
0 |__procthread
10:40:06 AM PID
TID %user %system %CPU CPU Command
10:40:07 AM 8197
- 67.00 2.00 69.00
0 procthread
10:40:07 AM -
8197 67.00 2.00 69.00
0 |__procthread
10:40:07 AM -
8198 1.00 1.00 2.00
0 |__procthread
10:40:07 AM PID
TID %user %system %CPU CPU Command
10:40:08 AM 8197
- 56.00 6.00 62.00
0 procthread
10:40:08 AM -
8197 56.00 6.00 62.00
0 |__procthread
10:40:08 AM -
8198 2.00 1.00 3.00
0 |__procthread
Average: PID
TID %user %system %CPU CPU Command
Average: 8197
- 64.78 3.32 68.11
- procthread
Average: -
8197 64.78 3.32 68.11
- |__procthread
Average: -
8198 1.00 1.00 1.99
- |__procthread |
As a last example, let me show you how pidstat helped me to detect a memory leak in the pidstat
command itself. At that time I was testing the very first version of pidstat I wrote for sysstat
7.1.4 and fixing the last remaining bugs. Here is the command I entered on the command line and
the output I got:
$ pidstat -r 2
Linux 2.6.8.1-27mdkcustom (localhost) 09/26/2007
10:59:03 AM PID minflt/s majflt/s
VSZ RSS %MEM Command
10:59:05 AM 14364 113.66
0.00 2480 1540 0.15 pidstat
10:59:05 AM PID minflt/s majflt/s
VSZ RSS %MEM Command
10:59:07 AM 7954 150.00
0.00 27416 19448 1.88 net_applet
10:59:07 AM 14364 120.00
0.00 3048 2052 0.20 pidstat
10:59:07 AM PID minflt/s majflt/s
VSZ RSS %MEM Command
10:59:09 AM 14364 116.00
0.00 3488 2532 0.24 pidstat
10:59:09 AM PID minflt/s majflt/s
VSZ RSS %MEM Command
10:59:11 AM 7947 0.50
0.00 27044 18356 1.77 mdkapplet
10:59:11 AM 14364 116.00
0.00 3928 3012 0.29 pidstat
10:59:11 AM PID minflt/s majflt/s
VSZ RSS %MEM Command
10:59:13 AM 7954 155.50
0.00 27416 19448 1.88 net_applet
10:59:13 AM 14364 115.50
0.00 4496 3488 0.34 pidstat
... |
I noticed that pidstat had a memory footprint (VSZ and RSS fields) that was constantly increasing
as the time went by. I quickly found that I had forgotten to close a file descriptor in a function
of my code and that was responsible for the memory leak...!
Softpanorama Recommended
Jun 25, 2012
Copyright © 2006–2012 Novell, Inc. and contributors. All rights reserved.
Over the past few years, Linux has made its way into the data centers of many corporations all
over the globe. The Linux operating system has become accepted by both the scientific and enterprise
user population. Today, Linux is by far the most versatile operating system. You can find Linux
on embedded devices such as firewalls and cell phones and mainframes. Naturally, performance of
the Linux operating system has become a hot topic for both scientific and enterprise users. However,
calculating a global weather forecast and hosting a database impose different requirements on the
operating system. Linux has to accommodate all possible usage scenarios with the most optimal performance.
The consequence of this challenge is that most Linux distributions contain general tuning parameters
to accommodate all users.
Over the past few years, Linux has made its way into the data
centers of many corporations all over the globe. The Linux
operating system has become accepted by both the scientific and
enterprise user population. Today, Linux is by far the most
versatile operating system. You can find Linux on embedded
devices such as firewalls and cell phones and mainframes.
Naturally, performance of the Linux operating system has become
a hot topic for both scientific and enterprise users. However,
calculating a global weather forecast and hosting a database
impose different requirements on the operating system. Linux has
to accommodate all possible usage scenarios with the most
optimal performance. The consequence of this challenge is that
most Linux distributions contain general tuning parameters to
accommodate all users.
IBM® has embraced Linux, and it is
recognized as an operating system suitable for enterprise-level
applications running on IBM systems. Most enterprise
applications are now available on Linux, including file and
print servers, database servers, Web servers, and collaboration
and mail servers.
With use of Linux in an enterprise-class server comes the
need to monitor performance and, when necessary, tune the server
to remove bottlenecks that affect users. This IBM Redpaper
describes the methods you can use to tune Linux, tools that you
can use to monitor and analyze server performance, and key
tuning parameters for specific server applications. The purpose
of this redpaper is to understand, analyze, and tune the Linux
operating system to yield superior performance for any type of
application you plan to run on these systems.
The tuning parameters, benchmark results, and monitoring
tools used in our test environment were executed on Red Hat and
Novell SUSE Linux kernel 2.6 systems running on IBM
System x servers and IBM System z servers. However, the
information in this redpaper should be helpful for all Linux
hardware platforms.
Update 4/2008: Typos corrected.
Check out the "c10k problem" page in particular, but the entire site has _lots_ of useful tuning
info.
http://linuxperf.nl.linux.org/
Site organized by Rik Van Riel and a few other folks. Probabaly the best linux specific system tuning
page.
Linux Scalibity Project at Umich.
Info on tuning linux kernel NFS in particular, and linux network and disk io in general
Linux Performance Tuning Checklist. Some useful content.
Miscellaneous performance tuning tips at linux.com
Summary of tcp tuning info
Utilities
Some simple utilities that come in handy when doing performance tuning.
dkftpbench
Need to stress out an ftp server, or measure how many users it can support? dkftpbench can
do it.
Want to write your own highly efficient networking software, but annoyed by having to
support very different code for Linux, FreeBSD, and Solaris? libPoller can help.
dklimits
fd-limit
a tiny util for determining the number of file descriptors available.
fd-limit.c
thread-limit
A util for determining the number of pthreads a system can use. This and fd-count are both
from the system tuning page for
Volano chat, a multithread
java based chat server.
thread-limit.c
Society
Groupthink :
Two Party System
as Polyarchy :
Corruption of Regulators :
Bureaucracies :
Understanding Micromanagers
and Control Freaks : Toxic Managers :
Harvard Mafia :
Diplomatic Communication
: Surviving a Bad Performance
Review : Insufficient Retirement Funds as
Immanent Problem of Neoliberal Regime : PseudoScience :
Who Rules America :
Neoliberalism
: The Iron
Law of Oligarchy :
Libertarian Philosophy
Quotes
War and Peace
: Skeptical
Finance : John
Kenneth Galbraith :Talleyrand :
Oscar Wilde :
Otto Von Bismarck :
Keynes :
George Carlin :
Skeptics :
Propaganda : SE
quotes : Language Design and Programming Quotes :
Random IT-related quotes :
Somerset Maugham :
Marcus Aurelius :
Kurt Vonnegut :
Eric Hoffer :
Winston Churchill :
Napoleon Bonaparte :
Ambrose Bierce :
Bernard Shaw :
Mark Twain Quotes
Bulletin:
Vol 25, No.12 (December, 2013) Rational Fools vs. Efficient Crooks The efficient
markets hypothesis :
Political Skeptic Bulletin, 2013 :
Unemployment Bulletin, 2010 :
Vol 23, No.10
(October, 2011) An observation about corporate security departments :
Slightly Skeptical Euromaydan Chronicles, June 2014 :
Greenspan legacy bulletin, 2008 :
Vol 25, No.10 (October, 2013) Cryptolocker Trojan
(Win32/Crilock.A) :
Vol 25, No.08 (August, 2013) Cloud providers
as intelligence collection hubs :
Financial Humor Bulletin, 2010 :
Inequality Bulletin, 2009 :
Financial Humor Bulletin, 2008 :
Copyleft Problems
Bulletin, 2004 :
Financial Humor Bulletin, 2011 :
Energy Bulletin, 2010 :
Malware Protection Bulletin, 2010 : Vol 26,
No.1 (January, 2013) Object-Oriented Cult :
Political Skeptic Bulletin, 2011 :
Vol 23, No.11 (November, 2011) Softpanorama classification
of sysadmin horror stories : Vol 25, No.05
(May, 2013) Corporate bullshit as a communication method :
Vol 25, No.06 (June, 2013) A Note on the Relationship of Brooks Law and Conway Law
History:
Fifty glorious years (1950-2000):
the triumph of the US computer engineering :
Donald Knuth : TAoCP
and its Influence of Computer Science : Richard Stallman
: Linus Torvalds :
Larry Wall :
John K. Ousterhout :
CTSS : Multix OS Unix
History : Unix shell history :
VI editor :
History of pipes concept :
Solaris : MS DOS
: Programming Languages History :
PL/1 : Simula 67 :
C :
History of GCC development :
Scripting Languages :
Perl history :
OS History : Mail :
DNS : SSH
: CPU Instruction Sets :
SPARC systems 1987-2006 :
Norton Commander :
Norton Utilities :
Norton Ghost :
Frontpage history :
Malware Defense History :
GNU Screen :
OSS early history
Classic books:
The Peter
Principle : Parkinson
Law : 1984 :
The Mythical Man-Month :
How to Solve It by George Polya :
The Art of Computer Programming :
The Elements of Programming Style :
The Unix Hater’s Handbook :
The Jargon file :
The True Believer :
Programming Pearls :
The Good Soldier Svejk :
The Power Elite
Most popular humor pages:
Manifest of the Softpanorama IT Slacker Society :
Ten Commandments
of the IT Slackers Society : Computer Humor Collection
: BSD Logo Story :
The Cuckoo's Egg :
IT Slang : C++ Humor
: ARE YOU A BBS ADDICT? :
The Perl Purity Test :
Object oriented programmers of all nations
: Financial Humor :
Financial Humor Bulletin,
2008 : Financial
Humor Bulletin, 2010 : The Most Comprehensive Collection of Editor-related
Humor : Programming Language Humor :
Goldman Sachs related humor :
Greenspan humor : C Humor :
Scripting Humor :
Real Programmers Humor :
Web Humor : GPL-related Humor
: OFM Humor :
Politically Incorrect Humor :
IDS Humor :
"Linux Sucks" Humor : Russian
Musical Humor : Best Russian Programmer
Humor : Microsoft plans to buy Catholic Church
: Richard Stallman Related Humor :
Admin Humor : Perl-related
Humor : Linus Torvalds Related
humor : PseudoScience Related Humor :
Networking Humor :
Shell Humor :
Financial Humor Bulletin,
2011 : Financial
Humor Bulletin, 2012 :
Financial Humor Bulletin,
2013 : Java Humor : Software
Engineering Humor : Sun Solaris Related Humor :
Education Humor : IBM
Humor : Assembler-related Humor :
VIM Humor : Computer
Viruses Humor : Bright tomorrow is rescheduled
to a day after tomorrow : Classic Computer
Humor
The Last but not Least Technology is dominated by
two types of people: those who understand what they do not manage and those who manage what they do not understand ~Archibald Putt.
Ph.D
Copyright © 1996-2021 by Softpanorama Society. www.softpanorama.org
was initially created as a service to the (now defunct) UN Sustainable Development Networking Programme (SDNP)
without any remuneration. This document is an industrial compilation designed and created exclusively
for educational use and is distributed under the Softpanorama Content License.
Original materials copyright belong
to respective owners. Quotes are made for educational purposes only
in compliance with the fair use doctrine.
FAIR USE NOTICE This site contains
copyrighted material the use of which has not always been specifically
authorized by the copyright owner. We are making such material available
to advance understanding of computer science, IT technology, economic, scientific, and social
issues. We believe this constitutes a 'fair use' of any such
copyrighted material as provided by section 107 of the US Copyright Law according to which
such material can be distributed without profit exclusively for research and educational purposes.
This is a Spartan WHYFF (We Help You For Free)
site written by people for whom English is not a native language. Grammar and spelling errors should
be expected. The site contain some broken links as it develops like a living tree...
Disclaimer:
The statements, views and opinions presented on this web page are those of the author (or
referenced source) and are
not endorsed by, nor do they necessarily reflect, the opinions of the Softpanorama society. We do not warrant the correctness
of the information provided or its fitness for any purpose. The site uses AdSense so you need to be aware of Google privacy policy. You you do not want to be
tracked by Google please disable Javascript for this site. This site is perfectly usable without
Javascript.
Last modified: February 19, 2020