|
|
Home | Switchboard | Unix Administration | Red Hat | TCP/IP Networks | Neoliberalism | Toxic Managers |
| (slightly skeptical) Educational society promoting "Back to basics" movement against IT overcomplexity and bastardization of classic Unix | |||||||
|
|
The central unit of information for any event correlation engine is the event. Events can be viewed as a generalized log records produced by various agents including standard Unix syslog. As such they can be related to any significant change in the state of the operating system or application. Events can be generated for not only for problems but for successful completions of scheduled tasks. For example, a host being rebooted, attempt to log as an administrator, or a hard drive being nearly full.
|
|
Typical event flow is not that different from email flow: each event has its origin, creation time, time, subject and body. Often they have severity and other fixed parameters. Like in case of email many events are just spam ;-). Like in email they can be sorted in multiple event streams. For example, operator event stream, Unix administrators event stream, Webserver and Websphere administrators event stream, etc. Like in Lotus Notes events can be processed much like database records using some kind of SQL-alike or generic scripting language.
Actually, as we will see below, the analogy runs deeper then that.
Event processing flow includes several stages. Among them
Event detection and forwarding to the processing (for example, Unix has built-is event collection system called syslog),
Pre-filtering or stateless event correlation,
More complex or Stateful event correlation
Event notification (often integrated with help-desk system),
Event response.
Event archiving
Event correlation is one of the most important parts of event processing flow. Proper event correlation and filtering is critical to ensuring service quality and the ability to respond rapidly to exceptional situations. The key to this is having experts encode their knowledge about the relationship between event patterns and actions to take. Unfortunately, doing so is time-consuming and knowledge-intensive.
Simple approaches based on collecting events on "enterprise console" often lead to information overload when the system is "crying wolf" way too often and as a result even useful alerts get ignored due to noise level. Correlation of events, while not a panacea, can substantially reduce the load of human operator and this improve chances that a relevant alert will be noticed and reacted in due time. But the devil is in details. As Marcus Ranum noted:
"Correlation is something everyone wants, but nobody even knows what it is. It's like liberty or free beer -- everyone thinks it's a great idea and we should all have it, but there's no road map for getting from here to there."
Still there are at least a couple of established technologies that are associated with event correlation:
Stateless correlation: when the correlation engine does not use its current state for the decision. It is usually limited to filtering.
Stateful correlation: when the correlation engine works with a "sliding window" (peephole) of events and can match the latest event against any other event in the window as well as its own state.
Stateful correlation is essentially a pattern recognition applied to a narrow domain: the process of identification of patterns of events often across multiple systems or components, patterns that might signify hardware or software problems, attacks, intrusions, misuse or failure of components. It can also implemented as specialized database with SQL as a query and peephole manipulation engine. The most typical operations include but are not limited to:
Event correlation is often associated with root cause analysis: the process of determining the root cause of one or more events. For example, a failure situation on the network usually generates multiple alerts but only one of them can be considered to be the root course. This is because a failure condition on one device may render other devices inaccessible. Polling agents are unable to access the device which has the failure condition. In addition, polling agents are also unable to access other devices rendered inaccessible by the error on the original device. Events are generated indicating that all of these devices are inaccessible are essentially spam. All we need is a root cause event.
The most typical event stream that serves as a playground for event correlation is Unix (or other OS) system logs. Log analysis is probably the major application domain of event correlation. For basic introduction into concepts of log analysis see [PDF] Guide to Computer Security Log Management.
Unix syslog provide rich information about state of the system that permits building sophisticated correlation schemes. Essentially each log entry is translatable to the event, although many can be discarded as non-essential. Syslog often serves a guinea pigs for enterprise correlation efforts and rightly so: the implementation is simple (syslog can easily be centralized) and return on investment is immediate as syslog in Unix contains mass of important events that are often overlooked. Additional events can be forwarded to syslog from cron scripts and other sources.
With log-based evens as a constituent part of the events stream, the number of events in a typical large corporate IT infrastructure or just its Unix part can be quite large. That meant that typically raw events are going via special preprocessing phase that is often called normalization and that stage somewhat trim the number of events for the subsequent processing. Many events extracted from syslog are also discarded as useless.
Normalization eliminates minor, non-essential variations and convert all events into standard format, or at least format more suitable for further processing. During this procedure event is also assigned some unique (often numeric) ID. It some way it is similar to rewriting of envelope in email systems like Sendmail.
Keep it simple, stupid
It does not make any sense to perform events correlation is a single step. It is more productive to use a separate stage for each event stream which is usually called "pre-filtering" (or surface correlation) as opposed to "deep" correlation:
IBM plans to discontinue its Prolog-based TEC engine in 2012 and that open possibilities for open source implementation which can borrow concepts from the pre-existing TEC infrastructure and documentation and improve upon that. As there are open source Prolog implementations of reasonable quality all Tivoli correlation techniques can be replicated with open source software. But in my opinion scripting languages represent a better platform for "deep" correlation technologies. Prolog-like constructs can be emulated if necessary within the scripting language. See, for example, Prolog Interpreters in Python
As those two technologies are complimentary, they should generally be deployed together as two different stages of correlation engine:
Attempt to do correlation in one stage usually is counterproductive as "noise events" stress the engine.
The complementary nature of "pre-filtering and deep correlation means that advertisements about a particular correlation engine based on the claims that it can process tremendous amount of events per second (Micromuse used to boast about "thousands of events per second") are pretty stupid and tells us something about the quality of the architecture.
For example, with 10K event cache IBM TEC 3.8 (and by extension 3.9) can process around 50 events per second using reasonably optimally split set of rule. Assuming newer 3.2Ghs dual core Intel CPUs, Linux and DB2 this might be getting closer to 100 and such a speed is pretty much adequate for most purposes if pre-filtering is used. It is very difficult to imagine more then 100 "important" events per second, if noise events are filtered out. In a way, any speed above 100 events per second probably does not improve the quality of the "deep" correlation engine but just can point out to an architectural problems of the particular system and/or deceptive advertising designed for fooling PHBs.
Complexity of the event correlation engine is somewhat related to the structure of event. Events can be strictly structured (essentially making them equal to structures in C and other programming languages) or fuzzy structured (when the number and names of slots can be dynamic). Not that one form cannot be converted into another, but different forms has different strong and weak points. For example different flexibility.
Typically all events contains several command fields such as
It also can contain several large text or XML fields such as
There are two large classes of systems:
For example HP Operations Monitor and Tivoli both belong to a system with strictly structured events (both use Oracle database for storing them), but treat this quite differently.
In tivoli each event has certain number of predefined, strongly typed fields (slots). The structure is defined in special BAROC (Basic Recorder Of Objects in C) language. The latter is not that different from the notation used for C structures. Before event can be send to the system you need to add it to the database of event class definitions. Otherwise the system will fail to recognize this event.
For example:
The following example defines attribute names of name, address, employer, and hobbies for the Person event class:
TEC_CLASS:
  Person ISA EVENT
    DEFINES {
          name:     STRING, dup_detect=YES;
          address:  STRING, dup_detect=YES;
          employer: STRING;
          hobbies:  STRING;
    };
The data type and any facets are comma-separated. The attribute definition should always be terminated with a semi-colon.
If the main correlation engine is SQL-based, it usually presuppose strictly structured events. To simplify processing by SQL engine they might even have "uniform" structure which is kind of strait jacket (all field are predefined and cannot be changed). In this case you can fool the system by using some string fields to extend the strait jacket using them as substructures that are interpreted by the correlation engine. This is more or less convenient only if sting processing capabilities of the engine are good.
Again, I would like to stress that it is usually possible to convert events from one scheme to another . For example IBM faced this task due to transition from TEC to Netcool. As a result it developed a conversion tool called the BAROC conversion tool (nco_baroc2sql)
Another approach is fuzzy structuring of event, similar to structure of SMTP messages. That means that event consists of two parts -- one rigidly structured (header) and the second which is not. Actually in SMTP messages even header is flexible and can be extended by so-called X fields and that approach has value in description of events too. As we mentioned before there is a stong similarity between events and e-mail messages. You can consider events as email messages to operators with special browser and special additional properties.
Another distinction is connected with the data carries by the event. Events can be completely passive (data only; also some data can trigger interpretive actions as in Tivoli), or with active parts (interpreted by some built-in scripting engine). For example in SMTP messages the body can contain mime attachments which can executable scripts.
In general, event does not need to have any passive data fields at all and can be a statement or sequence of statements in some language. In this case passive event is just a print statement in this language that "spit" all the necessary information. For example, a procedure for performing some actions on the event window (SQL insert statement). That, of course, raises some security questions, but if operations are allowed only on event window ("sandbox") they are not very relevant.
The beauty of this approach is that you can send complex events that manipulate event windows in non-trivial way. The simplest example of this approach are so called "cancelling" events -- event specifically designed to remove other event(s) of the same type (or set of matching attributes from the event queue.
There is a lot of literature (often obscure) about structure of event grouped under "complex event processing" label. There are also a couple of books on the subject (for example Event Processing in Action -- not that I recommend this book; it's pretty weak)
Recently some interesting research of event representation were conducted in the algorithmic trading field (see, for example, Event Processing blog). Due to general secrecy of algorithmic trading and, especially, high frequency trading, the amount of useful information you can get from reading those papers is pretty limited...
Dr. Nikolai Bezroukov
|
|
Switchboard | ||||
| Latest | |||||
| Past week | |||||
| Past month | |||||
Version 0.7 uses node modules (previously called skill modules) to replace the concepts of "brains" and "listeners" found in earlier versions. This makes the core language smaller by eliminating several commands that are now expressed as node commands (extended commands).
It also makes the C API for node modules available for creating new types of listeners and communications modules. This version is incompatible with rules developed for prior versions.
You will need to modify existing rules when upgrading to 0.7 from 0.6.5 or earlier versions.
This article will describe how easy it is to integrate other tools to Nagios or op5 Monitor. I will use an example with a webshop where a business view of how the webshop is doing is implemented by using a GPL'd rule engine, NodeBrain. I have in an earlier article described the ruleset for this implementation but now I will show how the integration can be done.The scenario is a webshop with:
- 5 frontend webservers
- 2 application servers
- 3 databasservers
Management want to monitor how the webshop is doing. They do not want to know if a redundant part is down instead management want to have the overview of the webshop status.
A management consultant is hired and do an investigation and after a ridiculous amount of money the following rules are defined:
- Webserver rules
- If 3 or more webserver works the webservice is OK
- If 2 webservers works the webservice is WARNING
- If 1 webserver or less is working the webservice is CRITICAL
- Applicationserver rules
- If 1 or 2 application servers works the application layer is OK
- If zero application servers works the application layer is CRITICAL
- Database server rules
- If 2 or more database server works the database layer is OK
- if 1 database server works the database layer is WARNING
- If no database servers works the database layer is CRITICAL
- The webserver layer, application layer and database layer should be viewed seperatly
- The total webshop status has the highest status value of webserver layer, application layer and database layer
I use Nagvis to illustrate the releationship between the layers.
Correlation is achieved with state-based and stateless rules. You specify these rules by using XML syntax, defined by the supplied DTD file, tecsce.dtd. The rules also have non-XML elements that define the associated rule predicates. The location of the default XML file is $BINDIR/TME/TEC/default_sm/ tecroot.xml. This same directory also contains other samples of state correlation XML files. These files are only found on the system where you installed Tivoli Event Integration Facility or the Adapter Configuration Facility. They are not distributed with the default profile to other systems. For more information about the additional sample files, see the readme.txt file in the same location.
- Note:
- Rules in state correlation are not the same as IBM Tivoli Enterprise Console rules.
You define each rule in a state machine. The state machine gathers and summarizes information about a particular set of related knowledge. It is composed of states, transitions, summaries, and other characteristics, such as expiration timers and control flags.
State-based rules are the following: duplicates, threshold, and collector, all based on state machines. Each state machine looks for a trigger event to start it. Additionally, there is the matching rule, which is a stateless rule.
State-based rules rely on a history of events, whereas the stateless rules operate on a single, current event. Rules are specified by the following:
- Predicates for matching events relevant to that rule
- Actions that run after the rule triggers
- Attributes, such as a threshold limit
Predicates
A predicate in the predicate library consists of a boolean operator and zero or more arguments. Each argument can be a predicate returning the following:
Table 12. Predicate types and examples
Predicate Type Example Boolean value Equality Function returning a value Addition Event attribute &hostname Constant The string foobar See "Predicate Library" for more information.
Actions
The two actions for state correlation are the Discard action and the TECSummary action. These actions support a common, optional boolean attribute, named singleInstance. If this attribute is false, the action is not shared among different rules. Thus, one instance of the action is created for every rule that triggers it. This is the default behavior. If the attribute is true, a single instance of the action is created and shared among all rules that trigger it.
The Discard action explicitly discards an event when a state machine is triggered. Thus, the event is not forwarded. This action has no arguments. The following XML fragment shows an example with the Discard action:
<rule id="root.match_discard_tec_notice">
  	 <eventType>TEC_Notice</eventType>
  	 <match>
      		<predicate>
         			<![CDATA[
             				# always succeeds
             				true
         			]]>
      		</predicate>
   	</match>
   	<triggerActions>
      		<action function="Discard" singleInstance="true"/>
   	</triggerActions>
</rule>
The summary action, TECSummary, compacts a list of correlated events into the summary event, which is then sent to the event server. The action packs all the events that match a specific rule in a single event. Additionally, this action has an optional msg parameter. The msg parameter specifies the value of the msg attribute to be added to the TECSummary event. The msg attribute acts as an identifier for different types of the TECSummary events. Thus, you can use the msg attribute as a means to identify events easily in the event console.
If the event is generated using more than one source event, the repeat_count attribute is added to it. It then contains the number of events that were originally processed. Also, if the original events already had a repeat_count attribute, their values are preserved by adding them to the final repeat_count value of the summary. For example, the following events are received:
EVENT;repeat_count=3;msg=event1;
EVENT;repeat_count=5;msg=event2;
EVENT;msg=event3;
The generated summary has a repeat_count of the following:
repeat_count = 3 + 5 + 1 = 9The following XML fragment shows how to configure the TECSummary action:
<rule id="root.duplicate_tec_db">
   	<eventType>TEC_DB</eventType>
   	<duplicate timeInterval="10000">
      		<cloneable attributeSet="sql_code"/>
      		<predicate>
         			<![CDATA[
            				# If we reach this point then
            				# the sql_code is already duplicated
            				# because it is used as a cloneable
            				# parameter.
            				true
         			]]>
      		</predicate>
   	</duplicate>
   	<triggerActions>
      		<action function="TECSummary" singleInstance="false">
         			<parameters>
            				SET:msg=root.duplicate_tec_db.summary
         			</parameters>
      		</action>
   	</triggerActions>
</rule>
Attributes Common to All Rules
The following are attributes common to all rules:
- id
- Specifies the identifier for each rule. It must be unique within the correlation engine where it is registered. Periods are treated as directories. For example, if you have the id test.threshold, you cannot have another rule with test.threshold.1 as the identifier.
- eventType
- Specifies the set of event classes this rule applies to and optimizes performance. When you omit this parameter, state correlation applies the rule to all event classes.
Matching Rules
Matching rules are stateless. They perform passive filtering on the attribute values of an incoming event. A matching rule consists of a single predicate; if the predicate evaluates to true, the trigger actions, which are specified in the rule, run. The following is an example of the rule:
<!--
Match all heartbeat events for my hostname
that have msg="please match me".
-->
<rule id="test.match" >
    <eventType>TEC_Heartbeat</eventType>
    <match>
      <predicate>
        <![CDATA[
           &msg == "please match me" &&
           &hostname == "hostname1"
           ]]>
      </predicate>
    </match>
</rule>
Duplicates Rules
The duplicates rule blocks the forwarding of duplicate events within a time interval . It requires these arguments:
- A time interval during which state correlation blocks duplicates of the trigger event. You control the interval with the timeInterval attribute, specified in milliseconds. The trigger event is the first event detected by the duplicates rule and is the only one that is not actually discarded.
- A predicate that is used in detecting the trigger event.
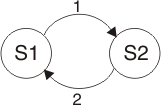
Figure 4 shows the state transitions for the duplicate rule:
Figure 4. State transitions for the duplicate rule
In Figure 4, state one is the initial state. Transition 1 occurs when there is a match on an incoming event. At that time, state correlation forwards the matching event, and the timer starts. Transition 2 occurs when the time interval expires, and the state machine resets. The following is an example of the rule:
<!--
Show me only the first error number 10
for my hostname that happens each 10
seconds.
-->
<rule id="test.duplicate" >
    <eventType>TEC_Error</eventType>
    <duplicate timeInterval="10000">
      <predicate>
<![CDATA[ &msg == "internal error on my adapter" && &hostname == "hostname1" && &errno = 10 ]]> </predicate> </duplicate> </rule>
Threshold Rules
The threshold rule looks for n occurrences of an event within a time interval . When the threshold is reached, it sends events to the defined actions. The threshold rule requires the following parameters:
- One of the sending modes specified by the triggerMode attribute:
FIRST_EVENT- Sends the first event.
- LAST_EVENT
- Sends the last (nth) event.
- ALL_EVENTS
- Sends all events 1 through n, the default mode.
- FORWARD_EVENTS
- Sends all events after the nth until it resets.
- A time interval during which the threshold has to be reached. You control the interval with the timeInterval attribute, specified in milliseconds.
- The time interval mode that indicates if the time interval is fixed. The attribute timeIntervalMode=fixedWindow | slidingWindowinterval controls the mode. The default value is fixedWindow.
- The number of events to match, specified by the thresholdCount attribute.
- A trigger predicate that is used in detecting 1 through n events.
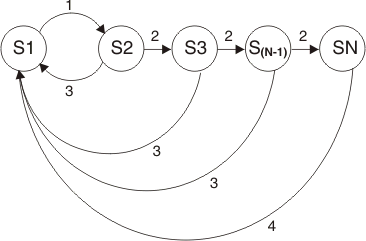
Figure 5 and Figure 6 show the operation of the threshold rule with timeIntervalMode=fixedWindow specified.
Figure 5. State transitions for the basic threshold rule
Figure 5 shows the state machine for the modes FIRST_EVENT, LAST_EVENT, and ALL_EVENTS. Transition 1 occurs when state correlation detects the trigger event (trigger predicate matches). Transition 2 takes place when an incoming event matches the second predicate. When the time interval expires, transition 3 occurs and the state machine resets. Transition 4 resets the state machine after the threshold is reached. When the state SN is reached, either the first event, the last event, or all n events are sent before resetting.
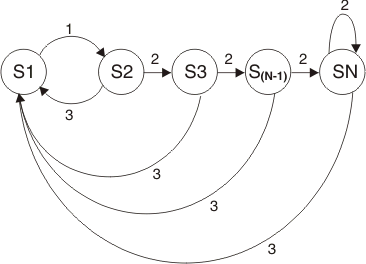
Figure 6. State transitions for the threshold rule using FORWARD_EVENTS
In FORWARD_EVENTS mode (Figure 6), the threshold rule operates as in the previous case. Except, it sends all events matching the second predicate after the threshold is reached and until the time interval expires.
When the state machine has timeIntervalMode=slidingWindow specified, the operation of the threshold rule is the same as the fixedWindow time interval. Except that from each node K, there is a transition of 1, 2, .., K-1. This transition accounts for events that are not in the sliding time window. The following is an example of the rule:
<!--
I'm only interested when at least 5 Node_Down
events for hostnames in my local subnet happen
within 1 minute.
-->
<rule id="test.threshold">
    <eventType>Node_Down</eventType>
    <threshold thresholdCount="5" timeInterval="60000"
    timeIntervalMode="slidingWindow" triggerMode="allEvents">
      <predicate>
         <![CDATA[
            (&msg == "node down") &&
            (isMemberOf(&hostname, [ 192.168./16 ]))
            ]]>
      </predicate>
    </threshold>
</rule>
Threshold rules can also define complex aggregate values, instead of a simple count of events. Use the aggregate configuration tag to define this rule. You can construct an aggregate value similar to the definition of a predicate. But instead of a simple true or false result, define a progressive value using the functions listed in Appendix D, Predicates and Functions for State Correlation. Threshold rules with aggregate values trigger only when the aggregate value is equal or greater than the thresholdCount value. The following is an example of the rule:
<!--
If I receive a slot value with a relative percentage between
0 and 1, but I want to check my threshold using the normal
percentage value of 100%, I can define an aggregate of the
slot relative_percentage, by multiplying it by 100 and counting
all percentages until it reaches 100%.
-->
<rule id="test.aggregate_threshold">
    <eventType>Temperature_Variation</eventType>
    <threshold
        thresholdCount="100"
        timeInterval="2000"
        triggerMode="allEvents"
        timeIntervalMode="fixedWindow" >
      <aggregate>
         <![CDATA[
           &relative_percentage * 100
           ]]>
      </aggregate>
      <predicate>true</predicate>
    </threshold>
  </rule>
Collector Rules
The collector rule gathers events that match the given predicate for a specified period of time . The rule triggers when the timer expires and sends all collected events to the defined actions. The collector rule requires these arguments:
- A time interval during which matching events are collected. You control the interval with the timeInterval attribute, specified in milliseconds.
- A predicate, which is part of filtering the relevant events to add to the collection.
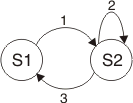
Figure 7 shows the state transitions for the collector rule:
Figure 7. State transitions for the collector rule
In Figure 7, S1 is the initial state. Transition 1 occurs when there is a match on an incoming event; the initial event is not sent but collected. A timer is set to the specified interval. Before the timer expires, all incoming and matching events are collected (transition 2). Transition 3 occurs when the time interval expires, and the state machine resets. At this time, all collected events are sent. The following is an example of the rule:
<!--
Collects 10 seconds of Server_Down
events for my database.
-->
<rule id="test.collector">
    <eventType>Server_Down</eventType>
    <collector timeInterval="10000" >
      <predicate>
        <![CDATA[
            &servername == "my_database"
            ]]>
      </predicate>
    </collector>
  </rule>
Updated executive brief: Overview of Business Event Processing (5.2MB)
Esper is a component for CEP and ESP applications, available for Java as Esper, and for .NET as NEsper.Esper and NEsper enable rapid development of applications that process large volumes of incoming messages or events. Esper and NEsper filter and analyze events in various ways, and respond to conditions of interest in real-time.
Technology IntroductionComplex Event Processing, or CEP, is technology to process events and discover complex patterns among multiple streams of event data. ESP stands for Event Stream Processing and deals with the task of processing multiple streams of event data with the goal of identifying the meaningful events within those streams, and deriving meaningful information from them. Real-time OLAP (online analytical processing) and continuous query are also terms used frequently for this technology.
The Esper engine has been developed to address the requirements of applications that analyze and react to events. Some typical examples of applications are:
Commonly Asked Questions
- Business process management and automation (process monitoring, BAM, reporting exceptions, operational intelligence)
- Finance (algorithmic trading, fraud detection, risk management)
- Network and application monitoring (intrusion detection, SLA monitoring)
- Sensor network applications (RFID reading, scheduling and control of fabrication lines, air traffic)
How does it work? How does it compare with other CEP products? How has this been tested? What is the performance? What is the license? Can I get support?
FeaturesEvent Stream Processing
Event Pattern Matching
- Sliding windows: time, length, sorted, accumulating, time-ordering, externally-timed (value-based windowing)
- Tumbling windows: time, length and multi-policy; first-event
- Combine windows with intersection and union semantics.
- Grouping, aggregation, sorting, filtering and merging of event streams
- Tailored SQL-like query language using insert into, select, from, where, group-by, having and order-by clauses
- Inner-joins and outer joins (left, right, full) of an unlimited number of streams or windows
- Subqueries including exists and in
- Output rate limiting and stabilizing, snapshot output
- Named windows
- Explicit sharing of data windows between statements
- Multiple and custom entry and exit criteria for events
- Support for predefined query execution optimized by indexed access, via on-select
Event Representations
- Logical and temporal event correlation
- Crontab-like timer 'at' operator
- Lifecycle of pattern can be controlled by timer and via operators, repeat-number and repeat-until
- Pattern-matched events provided to listeners
Prepared statements and substitution parameters
- Supports event-type inheritance and polymorphism as provided by the Java language, for Java object events as well as for Map-type events
- Events can be plain Java objects, XML (DOM and streaming through Apache Axiom) and java.util.Map including nested objects and hierarchical maps
- Event properties can be simple, indexed, mapped or nested - allows querying of deep Java object graphs and XML structures
- Dynamic properties allow dynamic typing of properties, supported by cast, instanceof and exists functions
- Applications can plug-in their own event representation and dynamic type resolution
Statement Object Model
- Precompile a statement with substitution parameters and efficiently start the parameterized statement multiple times
Input Adapters
- A set of classes providing an object-oriented representation of a statement
- Full and complete specification of a statement via object model
- Round-trip from object model to statement text and back to object model
- Build, change or interrogate statements beyond the textual representation
Other
- CSV input adapter reads comma-separated value formats
- simulate multiple event streams with timed, coordinated playback via timestamp column
- load generator
- preloading of reference data
- JMS input and output adapter based on Spring JMS templates
Excellent documentation
- Executes a large number of simultaneous queries - Esper's query processor can run thousands of queries continuously and simultaneously on a single instance
- Relational database access via SQL-query joins with event streams
- LRU (least-recently used) and expiry-time query result caches
- Keyed cache entries for fast cache lookup
- Engine indexes cached rows for fast filtering within a large number of SQL-query result rows
- Multiple SQL-queries in one statement transparently integrates multiple autonomous database systems
- Joins to method invocation results allows easy integration with distributed caches, web services and object-oriented databases
- On-demand queries are fire-and-forget EPL queries against named windows for non-continuous query execution
- Variables can occur in any expression and can dynamically control output rate
- Guarantees of consistency and atomicity of variable updates
- Variant event streams allows treating disparate types of events as the same type, such as when the event type can only be known at runtime, when the event type is expected to vary, or when optional properties are desired.
- Support for update events that update, provide a new version or that revise an existing event held by an engine.
- Support for both the listener (push/subscription) API and the consumer (pull/receive) API for querying results
- Concurrency-safe iterator provides complete query capability for all statements
- Supports externally-provided time as well as Java system time, allowing applications full control over the concept of time within an engine
- Multithread-safe as of release 1.5
- Multithreaded sends of events into an engine
- Create, start and stop statements during operation without adversely impacting performance
- Applications can retain full control over threading; Inbound, outbound and execution threading configurable
- Efficiently sharing resources between statements and low thread blocking
- Supports multiple independent Esper engines per JavaVM
- Pluggable architecture for event pattern and event stream analysis via user-defined functions, plug-in views, plug-in aggregation functions, plug-in pattern guards and plug-in pattern event observers, event instance methods
- Performance-minded design: query strategy analysis and index building; array-based collections; delta networks and many other techniques
- Benchmark kit available for download; Performance testing results and tips see page in menu
- Unmatched event listener receives a callback if an event does not match any started statement
- Support for all Java data types including BigInteger and BigDecimal
- Contained-Event select syntax for easy handling of coarse-grained, business-level events that themselves contain events
- JSON and XML output event rendering without syntax to learn
Many examples
Supportive user and developer community
- J2EE and non-J2EE, from many different domains
- Java Messaging Service (JMS) server shell demonstrates a multi-threaded JMS server with dynamic statement management using Java Management Extensions (JMX)
Performance tested
Typical UsesWhat these applications have in common is the requirement to process events (or messages) in real-time or near real-time. This is sometimes referred to as complex event processing (CEP) and event stream analysis.
Key considerations for these types of applications are the complexity of the logic required, throughput and latency.
- Complex computations - applications that detect patterns among events (event correlation), filter events, aggregate time or length windows of events, join event streams, trigger based on absence of events etc.
- High throughput - applications that process large volumes of messages (between 1,000 to 100k messages per second)
- Low latency - applications that react in real-time to conditions that occur (from a few milliseconds to a few seconds)
Learn how to correlate log and trace files generated by different products in various formats. Correlating log files is the first step in the problem determination process. This article shows you the procedure for developing a custom correlation engine as a plug-in for the Log and Trace Analyzer (LTA). Using examples from the IBM� WebSphere� Application Server activity log and the IBM DB2� diagnostic log, you learn how the LTA can correlate the log records visually as a UML sequence diagram. (Note: Updated for Release 2 of the IBM Autonomic Computing Toolkit.)
Prelude-Correlator, is a Lua rules based correlation engine. It has the ability to connect and fetch alerts from a remote Prelude-Manager server, and correlate incoming alerts based on the provided ruleset. Upon successful correlation, IDMEF correlation alerts are raised.Initially, the Prelude-Correlator rule language was inspired by SEC, evolving to use a real programming language. At this point, we decided to switch to a Lua based rules engine, which provides the great flexibility required for writing correlation rules.
Yemanja is a model-based event correlation engine for multi-layer fault diagnosis. It targets complex propagating fault scenarios, and can smoothly correlate low-level network events with high-level application performance alerts related to quality of service violations. Entity models that represent devices or abstract components encapsulate entity behavior. Distantly associated entities are not explicitly aware of each other, and communicate through event propagation chains. Yemanja's state-based engine supports generic scenario definitions, prioritization of alternate solutions, integrated problem-state and device testing, and simultaneous analysis overlapping problem analysis. The system of correlation rules was developed based on device, layer, and dependency analysis, and reveals the layered structure of computer networks. The primary objectives of this research include the development of reusable, configuration independent, correlation scenarios; adaptability and the extensibility of the engine to match the constantly changing topology of a multi-domain server farm; and the development of a concise specification language that is relatively simple yet powerful.
It is a well-known problem that intrusion detection systems overload their human operators by triggering thousands of alarms per day. This paper presents a new approach for handling intrusion detection alarms more efficiently. Central to this approach is the notion that each alarm occurs for a reason, which is referred to as the alarm's root causes. This paper observes that a few dozens of rather persistent root causes generally account for over 90 % of the alarms that an intrusion detection system triggers. Therefore, we argue that alarms should be handled by identifying and removing the most predominant and persistent root causes. To make this paradigm practicable, we propose a novel alarm-clustering method that supports the human analyst in identifying root causes. We present experiments with real-world intrusion detection alarms to show how alarm clustering helped us identify root causes. Moreover, we show that the alarm load decreases quite substantially if the identified root causes are eliminated so that they can no longer trigger alarms in the future.
Indeed, who can blame leadership for hating event management?
- It's extremely time intensive to do well
- It's expensive, even if you go with an open source platform
- Maintenance is a lot of work, requiring lots of hardware (particularly storage) and expertise
- It's woefully inaccurate, and stunningly misleading in some cases
My biggest frustration? The lack of a standard format. Sure, the logging experts will point out that acronym-filled standards like the CEF (Common Event Format) or the WTEF (WebTrends Enhanced Format) are out there, but nobody uses them. Thus, it's left as an exercise to the leader to normalize logs in to a universal format.
Moving this in to the real world for a moment, let's ponder the challenges that this brings to an enterprise of, say, 5,000 employees. This enterprise likely has a lot of Windows servers running Windows-y applications like Active Directory, Sharepoint, and Exchange. Said organize probably has a few Unix or Linux systems around, spewing out syslog data. Lots of network devices are around generating firewall rule matches and error data, and there's probably several proprietary applications logging directly to a localized database.
A "real" event correlation system would need to capture, centralize, normalize, audit, correlate, and alert on ALL of this data. It will require lots of maintenance as upgrades occur and storage requirements go. And don't depend too much on the vendor - they're probably too busy forgetting to install patches to worry about "centralized what"?
03/08/2007 | www.onjava.comEsper is an Event Stream Processing (ESP) and event correlation engine (CEP, Complex Event Processing). Targeted to real-time Event Driven Architectures (EDA), Esper is capable of triggering custom actions written as Plain Old Java Objects (POJO) when event conditions occur among event streams. It is designed for high-volume event correlation where millions of events coming in would make it impossible to store them all to later query them using classical database architecture. A tailored Event Query Language (EQL) allows expressing rich event conditions, correlation, possibly spanning time windows, thus minimizing the development effort required to set up a system that can react to complex situations.
Esper is a lightweight kernel written in Java which is fully embeddable into any Java process, JEE application server or Java-based Enterprise Service Bus. It enables rapid development of applications that process large volumes of incoming messages or events.
Esper is the leading open source Event Stream processing solution, currently available under a GPL license. This article introduces you to the main concepts of event stream processing and correlation and walks you through a sample application (source code and Ant script are available for download).
Save the snippet below as you SEC configuration file and then point SEC at some of the logs you are concerned with. It will give you a base from which you can:
- Explicitly ignore certain messages
- Alert on certain messages
- Do minimal correlation on a per-host, per-service basis
Good luck and enjoy!
# ignore events that SEC generates internally
type=suppress
ptype=RegExp
pattern=^SEC_INTERNAL

# ignore syslog-ng "MARK"s
type=suppress
ptype=RegExp
pattern=^.{14,15}\s+(\S+)\s+-- MARK --

# ignore cron,ssh session open/close
# Nov 23 00:17:01 dirtbag CRON[26568]: pam_unix(cron:session): session opened for user root by (uid=0)
# Nov 23 00:17:01 dirtbag CRON[26568]: pam_unix(cron:session): session closed for user root
# Nov 25 16:19:30 dirtbag sshd[13072]: pam_unix(ssh:session): session opened for user warchild by (uid=0)
# Nov 25 16:19:30 dirtbag sshd[13072]: pam_unix(ssh:session): session closed for user warchild
type=suppress
ptype=RegExp
pattern=^.{14,15}\s+(\S+)\s+(cron|CRON|sshd|SSHD)\[\d+\]: .*session (opened|closed) .*

# alert on root ssh
ptype=RegExp
pattern=^.{14,15}\s+(\S+)\s+(sshd|SSHD)\[\d+\]: Accept (password|publickey) for root from (\S+) .*
desc=$0
action=pipe '$0' /usr/bin/mail -s '[SEC] root $3 from $4 on $1' jhart


# ignore ssh passwd/pubkey success
#
# Nov 24 17:09:22 dirtbag sshd[8819]: Accepted password for warchild from 192.168.0.6 port 53686 ssh2
# Nov 25 16:19:30 dirtbag sshd[13070]: Accepted publickey for warchild from 192.168.0.100 port 57051 ssh2
type=suppress
ptype=RegExp
pattern=^.{14,15}\s+(\S+)\s+(sshd|SSHD)\[\d+\]: Accepted (password|publickey) .*


#############################################################################
# pile up all the su, sudo and ssh messages, alert when we see an error
# stock-pile all messages on a per-pid basis...
# create a session on the first one only, and pass it on
type=single
ptype=RegExp
continue=TakeNext
pattern=^.{14,15}\s+(\S+)\s+(sshd|sudo|su|unix_chkpwd)\S*\[([0-9]*)\]:.*
desc=$0
context=!$2_SESSION_$1_$3
action=create $2_SESSION_$1_$3 10;

# add it to the context
type=single
ptype=RegExp
continue=TakeNext
pattern=^.{14,15}\s+(\S+)\s+(sshd|sudo|su|unix_chkpwd)\S*\[([0-9]*)\]:.*
desc=$0
action=add $2_SESSION_$1_$3 $0;

# check for failures.  if we catch one, set the timeout to 30 seconds from now,
# and set the timeout action to report everything from this PID
type=single
ptype=RegExp
pattern=^.{14,15}\s+(\S+)\s+(sshd|sudo|su|unix_chkpwd)\S*\[([0-9]*)\]:.*fail(ed|ure).*
desc=$0
action=set $2_SESSION_$1_$3 15 (report $2_SESSION_$1_$3 /usr/bin/mail -s '[SEC] $2 Failure on $1' jhart)
#
##########

##########
# These two rules lump together otherwise uncaught messages on a per-host,
# per-message type basis.  The first rule creates the context which is set
# to expire and email its contents after 30 seconds.  The second rule simply
# catches all of the messages that match a given pattern and appropriately
# adds them to the context.
#
type=Single
ptype=RegExp
pattern=^.{14,15}\s+(\S+)\s+(\S+):.*$
context=!perhost_$1_$2
continue=TakeNext
desc=perhost catchall starter for $1 $2
action=create perhost_$1_$2 30 (report perhost_$1_$2 /usr/bin/mail -s '[SEC] Uncaught $2 messages for $1' jhart)

type=Single
ptype=RegExp
pattern=^.{14,15}\s+(\S+)\s+(\S+):.*$
context=perhost_$1_$2
desc=perhost catchall lumper for $1 $2
action=add perhost_$1_$2 $0
#
###########


###########
# These two rules catch all otherwise uncaught messages on a per-host basis.
# The first rule creates the context which is set to expire and email its
# contents after 30 seconds.  The second rule simpy catches all of the messages
# that match a given pattern and appropriately adds them to the context.
#
type=Single
ptype=RegExp
pattern=^.{14,15}\s+(\S+)\s+\S+:.*$
context=!perhost_$1
continue=TakeNext
desc=perhost catchall starter for $1
action=create perhost_$1 30 (report perhost_$1 /usr/bin/mail -s '[SEC] Uncaught messages for $1' jhart)

type=Single
ptype=RegExp
pattern=^.{14,15}\s+(\S+)\s+\S+:.*$
context=perhost_$1
desc=perhost catchall lumper for $1
action=add perhost_$1 $0
#
###########


###########
# These last two rules act simlar to the above sets, the only exception being that
# they are designed to catch bogus syslog messages.
type=Single
ptype=RegExp
pattern=^.*$
context=!catchall
continue=TakeNext
desc=catchall starter
action=create catchall 30 (report catchall /usr/bin/mail -s '[SEC] Unknown syslog message(s)' jhart)

type=Single
ptype=RegExp
pattern=^.*$
context=catchall
desc=catchall lumper
action=add catchall $0
#
###########
Vendors/products must have the automated, out-of-the-box ability to process or correlate events through one or more of the following techniques:In addition, vendors/products must support the user's ability to add custom event processing or correlation rules.
- Deduplication/filtering (for example, when multiple, repetitive events are received for the same problem on the same element, store the event once and increase a counter indicating the number of times it has been received, rather than flooding the user's screen with redundant events).
- State-based correlation at the element level (for example, if a "link down" event is received for a router interface that then corrects itself and generates a subsequent "link up" event, then the ECA product correlates the two and clears the original link-down event).
- Topology-based correlation (for example, suppress the sympathetic events that occur when elements downstream from a known problem are unreachable).
- Correlation based on causal rules (for example, suppress events that are determined to be completely dependent effects of events taking place elsewhere, based on the product's built-in domain knowledge of how systems interact).
Tenable is proud to announce the release of the Log Correlation Engine version 3.0. This release has many new enhancements and features, plus some new functionality which will be made available with the upcoming release of Security Center 3.4.3. Please see the Tenable blog for more information about this release.
More Information
The Log and Trace Analyzer (LTA) included in the IBM Autonomic Computing Toolkit is used for importing different logs generated by various products and transforming the log entries into the Common Base Event (CBE) format. The infrastructure for the LTA has been open source as part of the Eclipse Hyades project (see Resources for more information). The LTA can also import symptom databases. Log files can be analyzed and correlated against the symptom databases to find a solution for the problem. LTA is used primarily for problem determination because finding the cause of a problem becomes more difficult as the number of products, and the number of servers they run on, increases. The log file from a single product cannot always help in determining the solution for the overall system problem.
To help you understand the importance of correlation, consider the IBM WebSphere Application Server and an IBM DB2 database. These two products can work together as the application server to host the components and the database to store the data, respectively. If an error occurs in the database and, as a result, the application server stops, it is impossible to track down the source of the problem by looking only at the application server logs. The errors recorded in the application server logs might not be descriptive enough to indicate the details of the problem with the database. In this case, you also need to look at the logs generated by the database. You need to correlate the logs of the application server and the database so that the corresponding problem records from both of the logs can be identified. Although the CBE time stamp is precise up to the microsecond, watching the logs of the individual products and determining the problem by looking only at the time stamps becomes complex. Keep in mind that logs might be generated from different time zones, and the clocks on the systems running the application server and the database cannot always be synchronized to milliseconds.
Correlation in the Log and Trace Analyzer is finding the relation between the distributed log records and learning the influence of one log record on another. The log records can be from the same log file or from different log files; this relation between the log records can be based on the different properties or combination of the properties of the CBE. A correlation engine is an Eclipse plug-in of the LTA that shows the correlation between the log records visually in a UML sequence diagram.
This article describes the procedure for building a correlation engine for the LTA. This example correlation engine extends the default time correlation engine already available with the LTA. The existing default time correlation engine correlates log records by exactly matching the time stamp of the CBE events. However, there could be a time delay in milliseconds between the records of two products even though both the products are running on the same system. This correlation engine ignores the milliseconds while correlating the logs of the IBM WebSphere Application Server activity log and the IBM DB2 diagnostic log.
Resources
- Download the source code used in this article.
- The infrastructure for the LTA has been open source as part of the Eclipse Hyades project.
- You can download the Log and Trace Analyzer from the Autonomic Computing Toolkit.
- Read Understand problem determination (developerWorks, March 2004) to see the fundamental issue of problem determination and what it takes to transform this from a human process to an autonomic one.
- Work through the tutorials on the Log and Trace Analyzer to get an introduction to the Generic Log Adapter, which converts text-based logs to the Common Base Events format for use with autonomic computing tools such as the Log and Trace Analyzer.
- The Linux Documentation Project is a repository of Linux documentation, including documents about individual software, HOWTO documents, FAQs, and more.
- "Build a better GUI" (developerWorks, October 2001) discusses the use of Java layout managers for better overall GUI design.
- Practical UNIX & Internet Security (O'Reilly & Associates; 1996), by Garfinkel and Spafford, is an excellent reference on all aspects of system security from user management to drafting a security policy.
Today's diverse interconnected e-business components typically come with a lot of event information generated by touchpoints through log files or event emitters. Correlating event information to derive symptoms, or higher level business conclusions, is fundamental to identifying critical situations that need to be corrected. This article describes the IBM Active Correlation Technology (ACT), which provides built-in patterns that support event correlation and complex event processing.
ACT is a technology that is in the works at IBM. You will see it showing up in our products in the future. At this point, however, ACT is not available to be embedded into your own applications. However, if you understand the benefits that this new technology provides, you'll be better able to understand the direction in which autonomic computing technology is headed. Read this article for a sneak peek at what types of functions you'll be seeing in the future. As always, we like hearing what you think; chime in with your thoughts on the autonomic computing discussion forum in the Resources section of the article.
The article provides a brief overview of ACT, which is a set of modular event correlation components that deliver complex event processing functions, such as:
- Aggregating and filtering events
- Correlating and associating events for problem determination and detection of business situations
- Triggering automatic actions in response to events that cause situations
- Associating events with business information
ACT includes support for events that conform to the Common Base Event specification and other messaging formats. ACT is a technology that is being embedded in different IBM products and offerings.
Any customer with a data center, trying to manage a complex IT infrastructure, can benefit from a solution or product that embeds ACT. By using ACT to detect symptoms, customers can:
- Reduce the number of events their operation staff needs to handle by filtering out spurious events, removing duplicates, and summarizing a collection of events
- Correlate lower-level events into a meaningful diagnosed symptom that provides higher level or better information for problem determination
- Gain the ability to take autonomic actions and solve the original problem using corrective actions.
Resources
- Chime in with your thoughts by participating in the discussion forum, Autonomic Computing: an insider's perspective.
- An Architectural Blueprint for Autonomic Computing (IBM Corporation, October 2004): Read this White Paper for an overview of the autonomic computing architecture, including more information about touchpoints and other architectural building blocks.
- "Symptoms deep dive, Part 1: The autonomic computing symptoms format" (developerWorks, 2005): This article provides an overview of the autonomic computing symptoms format and how it fits in the autonomic computing architecture.
- Common Base Event Documentation: Read the documentation for more information on Common Base Events.
Method and apparatus for identifying problems in computer networks
US Patent Issued on April 11, 2006Inventor(s)
David M. Lovy
Brant M. Fagan
Robert J. Bojanek
Assignee
The ShoreGroup, Inc.
Application
No. 10108962 filed on 2002-03-28
Current US Class
714/57 , Error forwarding and presentation (e.g., operator console, error display) 714/47 Performance monitoring for fault avoidance
ExaminersPrimary: Scott Baderman
Attorney, Agent or Firm
Assistant: Joshua Lohn
Kudirka & Jobse, LLP
US Patent References
5436909
Abstract
Network management system using status suppression to isolate network faults
Issued on: July 25, 1995
Inventor: Dev, et al. 5455932
Fault tolerant computer system
Issued on: October 3, 1995
Inventor: Major, et al. 5504921
Network management system using model-based intelligence
Issued on: April 2, 1996
Inventor: Dev, et al. 5655081
System for monitoring and managing computer resources and applications across a distributed computing environment using an intelligent autonomous agent architecture
Issued on: August 5, 1997
Inventor: Bonnell, et al. 5828830
Method and system for priortizing and filtering traps from network devices
Issued on: October 27, 1998
Inventor: Rangaraian, et al. 5926462
Method of determining topology of a network of objects which compares the similarity of the traffic sequences/volumes of a pair of devices
Issued on: July 20, 1999
Inventor: Schenkel, et al. 5933416
Method of determining the topology of a network of objects
Issued on: August 3, 1999
Inventor: Schenkel, et al. 6012152
Software fault management system
Issued on: January 4, 2000
Inventor: Douik, et al. 6046988
Method of determining the topology of a network of objects
Issued on: April 4, 2000
Inventor: Schenkel, et al. 6148337
Method and system for monitoring and manipulating the flow of private information on public networks
Issued on: November 14, 2000
Inventor: Estberg, et al.
A network appliance for monitoring, diagnosing and documenting problems among a plurality of devices and processes (objects) coupled to a computer network utilizes periodic polling and collection of object-generated trap data to monitor the status of objects on the computer network. The status of a multitude of objects is maintained in memory utilizing virtual state machines which contain a small amount of persistent data but which are modeled after one of a plurality of finite state machines. The memory further maintains dependency data related to each object which identifies parent/child relationships with other objects at the same or different layers of the OSI network protocol model. A decision engine verifies through on-demand polling that a device is down. A root cause analysis module utilizes status and dependency data to locate the highest object in the parent/child relationship tree that is affected to determine the root cause of a problem. Once a problem has been verified, a �??case�?� is opened and notification alerts may be sent out to one or more devices. A user interface allows all objects within the network to be displayed with their respective status and their respective parent/child dependency objects in various formats.Claims
What is claimed is:
1. In a computer system having a processor, memory and a network interface, an apparatus for monitoring a plurality of device or process objects operatively coupled to the computer system over a computer network, the apparatus comprising:
(a) a performance poller for sending performance queries to the plurality of monitored objects and for receiving responses therefrom;
(b) a status poller for sending fault queries to the plurality of monitored objects and for receiving responses thereto;
(c) a fault trapper for receiving fault traps generated by the monitored objects; (e) a database for storing data relating to the monitored objects and the status thereof, wherein the database stores a plurality of virtual state-machines relating to the monitored objects; and
(f) a case management module for receiving case management requests from the decision engine.
2. The apparatus of claim 1 wherein (f) comprises:
(f1) means for presenting data relating to the monitored objects and status thereof.
3. The apparatus of claim 1 wherein the performance poller is further configured to receive performance data requests from a requestor external to the apparatus and for generating a response to the performance data requests.
4. The apparatus of claim 1 wherein the performance poller receives management data from external sources.
5. The apparatus of claim 1 wherein the status poller is further configured to receive fault data requests from a requester external to the apparatus and for generating a response to the fault data requests.
6. The apparatus of claim 1 wherein fault trapper receives management data from external sources.
7. The apparatus of claim 1 wherein the case management module is further configured to receive case management requests from a requester external to the apparatus and for generating a response to the case management requests.
8. The apparatus of claim 1 wherein (d) further comprises:
(d1) a decision processor responsive to the decision requests and configured to send a object query to the database and for a receiving a object response from the database.
9. The apparatus of claim 1 wherein (d) further comprises:
(d2) a case generator responsive to generation requests from the decision processor and configured to generate case management requests to the case management module.
10. The apparatus of claim 1 wherein (f) further comprises:
(f1) a case management module responsive to the case management requests and configured to send a case management request query to the database and for a receiving a case management request response from the database.
11. The apparatus of claim 10 wherein (f) further comprises:
(f2) an escalation engine configured to send an escalation query to the database and for a receiving an escalation response therefrom.
12. The apparatus of claim 11 wherein (f) further comprises:
(f3) a notification engine responsive to the notification requests from the case management module and the escalation engine and configured to send a notification query to the database and for a receiving a notification response from the database and further configured to generate notifications to a presentation device external to the apparatus.
13. The apparatus of claim 1 further comprising:
(g) an on demand status poller for sending queries to monitored objects identified by the decision engine and for receiving responses thereto.
14. In a computer system having a processor, memory and a network interface, an apparatus for monitoring a plurality of device or process objects operatively coupled to the computer system over a computer network, the apparatus comprising:
(a) a poller for sending queries to the plurality of monitored objects and for receiving responses therefrom;
(b) a trap receiver for receiving traps generated by the monitored objects;
(c) a decision engine responsive to decision requests from any of the trap receiver and poller indicating that one of the plurality of monitored objects has abnormal status, the decision engine further configured to send a verification query to said one of the plurality of monitored objects identified in the decision request and for receiving a response to the verification query from said one of the plurality of monitored objects confirming or denying abnormal status thereof;
(d) a memory for storing data relating to status of the monitored object, wherein the memory stores a plurality of virtual state-machines relating to the monitored objects; and
(e) a case management module for receiving requests from the decision engine to open a case related to a monitored object and for presenting data relating to the case.
15. The apparatus of claim 14 wherein (a) further comprises:
(a1) a status poller for sending queries to the plurality of monitored objects and for receiving responses thereto.
16. The apparatus of claim 14 wherein (a) further comprises:
(a1) a performance poller for sending performance queries to the plurality of monitored objects and for receiving responses thereto.
17. The apparatus of claim 14 wherein (a) further comprises:
(a1) an on demand status poller for sending queries to monitored objects identified by the decision engine and for receiving responses thereto.
18. In a computer system having a processor, memory and a network interface, an apparatus for monitoring a plurality of device or process objects operatively coupled to the computer system over a computer network, the apparatus comprising:
(a) means for monitoring the status of the plurality of monitored objects over the computer network;
(b) means, coupled to the means for monitoring, for receiving data indicating that the status of a monitored object, and, if the data indicating that the status of a monitored object is not normal, for sending a verification request to the monitored object requesting verification of abnormal status and for receiving from the monitored object data confirming or denying abnormal status thereof;
(c) a memory for storing data relating to the status of the monitored objects wherein the memory stores a plurality of virtual state-machines relating to the monitored objects; and
(d) means, coupled to the memory, for presenting data relating to the monitored objects.
19. In an apparatus operatively coupled over a computer network to a plurality of device or process objects, a method comprising:
(a) monitoring the status of the plurality of monitored objects;
(b) receiving data indicating the status of a monitored object;
(c) storing data relating to the status of the monitored objects in memory;
(d) if the data indicating the status of a monitored object is not normal, sending a verification request to the monitored object requesting verification of abnormal status and receiving from the monitored object data confirming or denying abnormal status thereof;
(e) initializing a case relating to a monitored object having a verified status other than normal; and
(f) maintaining in memory a list of all monitored objects, wherein selected of the plurality of monitored objects have parent/child dependency relations.
20. The method of claim 19 further comprising:
(g) alerting a device external to the apparatus that the status of the monitored object has been verified as not normal.
21. The method of claim 20 wherein (f1) comprises:
(g1) alerting an external device operatively coupled to the apparatus over a packet switched network that the status of the monitored object has been verified as not normal.
22. The method of claim 20 wherein (f1) comprises:
(g1) alerting an external device operatively coupled to the apparatus over a circuit switched network that the status of the monitored object has been verified as not normal.
23. The method of claim 19 further comprising:
(g) providing a device external to the apparatus with access to the data relating to the status of the monitored objects in memory.
24. The method of claim 19 wherein (f) further comprises:
(f1) maintaining in memory data identifying the parent/child dependency relations among a plurality of monitored objects.
25. The method of claim 24 wherein the data identifying the parent/child dependency relationship among a plurality of monitored objects is defined in memory with one or more Boolean expressions.
26. The method of claim 24 wherein (d) comprises:
(d1) identifying the highest parent object in the parent/child dependency relation that has a status other than normal.
27. The computer program product for use with an computer system operatively coupled over a computer network to a plurality of device or process objects, the computer program product comprising a computer useable medium having embodied therein program code comprising:
(a) program code for monitoring the status of the plurality of monitored objects;
(b) program code for receiving data indicating the status of a monitored object;
(c) program code for storing data relating to the status of the monitored objects in memory;
(d) program code for sending a verification request to the monitored object requesting verification of abnormal status and for receiving from the monitored object data confirming or denying abnormal status thereof, if the data indicating the status of a monitored object is not normal;
(e) program code for initializing a case relating to a monitored object having a verified status other than normal; and
(f) program code for maintaining in memory a list of all monitored objects, wherein selected of the plurality of monitored objects have parent/child dependency relations.
28. The computer program product of claim 27 further comprising:
(g) program code for alerting a device external to the apparatus that the status of the monitored object has been verified as not normal.
29. The computer program product of claim 28 wherein (f1) comprises:
(g1) program code for alerting an external device operatively coupled to the apparatus over a packet switched network that the status of the monitored object has been verified as not normal.
30. The computer program product of claim 28 wherein (f1) comprises:
(g1) program code for alerting an external device operatively coupled to the apparatus over a circuit switched network that the status of the monitored object has been verified as not normal.
31. The computer program product of claim 27 further comprising:
(g) program code for providing a device external to the apparatus with access to the data relating to the status of the monitored objects in memory.
32. The computer program product of claim 27 wherein (f) further comprises:
(f1) program code for maintaining in memory data identifying the parent/child dependency relations among a plurality of monitored objects.
33. The computer program product of claim 32 wherein the data identifying the parent/child dependency relationship among a plurality of monitored objects defines one or more Boolean relationships.
34. The computer program product of claim 32 wherein (d) comprises:
(d1) program code for identifying if any monitored object in the parent/child dependency relation has a status other than normal; and
(d2) program code for determining that the status of a monitored object is normal if the status of all parent monitored objects in a pctively monitor the network or system management station. In an environment where adequately trained human resources are unavailable, an administrator dedicated to monitoring the network management system is a luxury many technical staffs do not have. A successful system must therefore identify a fault condition and have an established methodology of contacting the appropriate personnel when a fault condition exists.The current paradigm for network and system management systems is to represent fault information via a topological map. Typically a change in color (or other visual cue) represents a change in the condition of the network or system. This method, as currently applied, is appropriate when a single layer of the Open Systems Interconnect (OSI) logical hierarchical architecture model can represent the fault condition. For example, a fault condition associated with layer two devices can be adequately represented by a layer two topological map. However, to maintain the current paradigm of representing fault condition topologically, a topology map should present a view of the network consistent with complex multi-layer dependencies. Topological representations of large networks are also problematic. A large network is either squeezed onto a single screen or the operator must zoom in and out of the network to change the view. This common approach ignores known relationships between up and downstream objects in favor of a percentage view of the network, e.g. 100% equals the entire network, 50% equals one-half the network.
Further, adequate documentation and description of a problem or fault conditions and its corresponding resolution is essential but difficult to achieve within the confines of a current network or system management systems. Typically the problem description and problem resolution are documented external to the network or system management system. As a result of using an external system to document problems and their resolution, a dichotomy is created between the machine events in the network management system and the external system which records human intervention. Furthermore, the network management system will typically generate multiple events for a single object, such association often lost when translated to an external system. Reconciling the machine view of the network management system with that of the external system documenting the problem description/problem resolution is quite often difficult and unsuccessful.
Current network management tools depend upon the discovery of network/system devices associated with the network, typically through discovery of devices at layer two of the OSI model. Thereafter the network is actively rediscovered using the tool to maintain a current view of the network or system.
A need exist for a technique to automate the process by which network or system faults are translated into an event requiring human action.
A need exists for a technique to discover and document the current state of the network based on known network/system objects and to detect deviations from the known state of the network and report such discovered deviations as faults.
SUMMARY OF THE INVENTION
The invention discloses a network management appliance and methods for identifying, diagnosing, and documenting problems in computer networks using the appliance. The devices and process available on a network, as well as grouping of the same, are collectively referred to hereafter as "objects". Accordingly, a monitored or managed object may be physical device(s), process(es) or logical associations or the same. According to one aspect of the invention, the network appliance comprises one or more a polling modules, a decision engine, a database and a case management module. The network appliance monitors objects throughout the network and communicates their status and/or problems to any number of receiving devices including worldwide web processes, e-mail processes, other computers, PSTN or IP based telephones or pagers.
A Status Poller periodically polls one or more monitored network objects and receives fault responses thereto. A Trap Receiver receives device generated fault messages. Both the Trap Receiver and Status Poller generate and transmit decision requests to the decision engine. The decision engine verifies through on-demand polling that a device is down. What is the novelty of this? -- NNB]
A root cause analysis module utilizes status and dependency data to locate the highest object in the parent/child relationship tree that is affected to determine the root cause of a problem. Once a problem has been verified, a "case" is opened and notification alerts may be sent out to one or more devices. The decision engine interacts with the database and the case management module to monitor the status of problems or "cases" which have been opened. The case management module interacts with the various notification devices to provide the status updates and to provide responses to queries.
The status of a monitored object is maintained in memory using a virtual state machine. The virtual state machines are based on one or a plurality of different finite state machine models. The decision engine receives input data, typically event messages, and updates the virtual state machines accordingly. The inventive network appliance records thousands of network states and simultaneously executes thousands of state machines while maintaining a historical record of all states and state machines.
According to a first aspect of the invention, in a computer system having a processor, memory and a network interface, an apparatus for monitoring a plurality of device or process objects operatively coupled to the computer system over a computer network, the apparatus comprises: (a) a performance poller for sending performance queries to the plurality of monitored objects and for receiving responses therefrom; (b) a status poller for sending fault queries to the plurality of monitored objects and for receiving responses thereto; (c) a fault trapper for receiving fault traps generated by the monitored objects; (d) a decision engine responsive to decision requests from any of the fault trapper, status poller and performance poller, the decision engine further configured to send a verification query to one of the plurality of monitored objects identified in the decision request and for a receiving response to the verification query; (e) a database for storing data relating to the monitored objects and the status thereof; and (f) a case management module for receiving case management requests from the decision engine.
According to a second aspect of the invention, in a computer system having a processor, memory and a network interface, an apparatus for monitoring a plurality of device or process objects operatively coupled to the computer system over a computer network, the apparatus comprises: (a) a poller for sending queries to the plurality of monitored objects and for receiving responses therefrom; (b) a trap receiver for receiving traps generated by the monitored objects; (c) a decision engine responsive to decision requests from any of the trap receiver and poller, the decision engine further configured to send a verification query to one of the plurality of monitored objects identified in the decision request and for a receiving response to the verification query; (d) a memory for storing data relating to status of the monitored object; and (e) a case management module for receiving requests from the decision engine to open a case related to a monitored object and for presenting data relating to the case.
According to a third aspect of the invention, in a computer system having a processor, memory and a network interface, an apparatus for monitoring a plurality of device or process objects operatively coupled to the computer system over a computer network, the apparatus comprises: (a) means for monitoring the status of the plurality of monitored objects over the computer network; (b) means, coupled to the means for monitoring, for receiving data indicating that the status of a monitored object, and, if the data indicating that the status of a monitored object is not normal, for verifying that the status of a monitored object is not normal; (c) a memory for storing data relating to the status of the monitored object; and (d) means, coupled to the memory, for presenting data relating to the monitored objects.
According to a third aspect of the invention, in an apparatus operatively coupled over a computer network to a plurality of device or process objects, a computer program product and method comprises: (a) monitoring the status of the plurality of monitored objects; (b) receiving data indicating the status of a monitored object; (c) storing data relating to the status of the monitored objects in memory; (d) if the data indicating the status of a monitored object is not normal, verifying that the status of the monitored object is not normal; and (e) initializing a case relating to a monitored object having a verified status other than normal.
BRIEF DESCRIPTION OF THE DRAWINGS
The above and further advantages of the invention may be better understood by referring to the following description in conjunction with the accompanying drawings in which:
- FIG. 1 is a block diagram of a prior art computer system suitable for use with the present invention;
- FIG. 2 is a conceptual illustration of a network environment in which the present invention may be utilized;
- FIG. 3 illustrates conceptually the internal components of the network appliance and external elements within the network environment in accordance with the present invention;
- FIG. 4 is a conceptual block diagram of the network management appliance of the present invention illustrating the implementation of the performance monitoring component;
- FIG. 5 is a conceptual block diagram of the network management appliance of the present invention illustrating the implementation of the fault monitoring component;
- FIG. 6 is a conceptual block diagram illustrating the communication paths between the fault monitoring component of the inventive appliance and the external elements within the network environment;
- FIG. 7 is a conceptual block diagram of the decision engine component of the network management appliance of the present invention;
- FIG. 8 is a conceptual block diagram of the case management system component of the network management appliance of the present invention;
- FIG. 9 is a conceptual block diagram of the notification engine component of the network management appliance of the present invention;
- FIG. 10 is a conceptual block diagram illustrating the communication paths between the performance monitoring component of the inventive appliance and the external elements within the network environment;
- FIG. 11 is a conceptual block diagram of a decision engine and the various component modules therein in accordance with the present invention;
- FIGS. 12A-C are conceptual illustrations of a state machine and hypothetical states in accordance with the present invention;
- FIG. 13 illustrates a user interface diagram identifying a target monitored network device and monitored parent and child devices within the network environment in accordance with the present invention;
- FIG. 14 illustrates a user interface diagram identifying a target monitored network device and monitored parent and child devices within the network environment in accordance with the present invention;
- FIG. 15 illustrates a user interface status map including a microview of the network and a macroview of a selected portion of the network, in accordance with the present invention;
- FIGS. 16-20 are conceptual illustrations of a state machine models and their respective states in accordance with the present invention;
- FIG. 21 illustrates a user interface status table in accordance with the present invention; and
- FIG. 22 illustrates a user interface status map including the dependency relationships of a target object and various status parameters for each object shown with multiple iconic representations.
DETAILED DESCRIPTION
FIG. 1 illustrates the system architecture for a computer system 100, such as a Dell Dimension 8200, commercially available from Dell Computer, Dallas Tex., on which the invention can be implemented. The exemplary computer system of FIG. 1 is for descriptive purposes only. Although the description below may refer to terms commonly used in describing particular computer systems, the description and concepts equally apply to other systems, including systems having architectures dissimilar to FIG. 1.
The computer system 100 includes a central processing unit (CPU) 105, which may include a conventional microprocessor, a random access memory (RAM) 110 for temporary storage of information, and a read only memory (ROM) 115 for permanent storage of information. A memory controller 120 is provided for controlling system RAM 110. A bus controller 125 is provided for controlling bus 130, and an interrupt controller 135 is used for receiving and processing various interrupt signals from the other system components. Mass storage may be provided by diskette 142, CD ROM 147 or hard drive 152. Data and software may be exchanged with computer system 100 via removable media such as diskette 142 and CD ROM 147. Diskette 142 is insertable into diskette drive 141 which is, in turn, connected to bus 130 by a controller 140. Similarly, CD ROM 147 is insertable into CD ROM drive 146 which is connected to bus 130 by controller 145. Hard disk 152 is part of a fixed disk drive 151 which is connected to bus 130 by controller 150.
User input to computer system 100 may be provided by a number of devices. For example, a keyboard 156 and mouse 157 are connected to bus 130 by controller 155. An audio transducer 196, which may act as both a microphone and a speaker, is connected to bus 130 by audio controller 197, as illustrated. It will be obvious to those reasonably skilled in the art that other input devices such as a pen and/or tablet and a microphone for voice input may be connected to computer system 100 through bus 130 and an appropriate controller/software. DMA controller 160 is provided for performing direct memory access to system RAM 110. A visual display is generated by video controller 165 which controls video display 170. Computer system 100 also includes a network adapter 190 which allows the system to be interconnected to a local area network (LAN) or a wide area network (WAN), schematically illustrated by bus 191 and network 195.
Computer system 100-102 are generally controlled and coordinated by operating system software. The operating system controls allocation of system resources and performs tasks such as process scheduling, memory management, and networking and I/O services, among other things. In particular, an operating system resident in system memory and running on CPU 105 coordinates the operation of the other elements of computer system 100. The present invention may be implemented with any number of commercially available operating systems including UNIX, Windows NT, Windows 2000, Windows XP, Linux, Solaris, etc. One or more applications 220 such as the inventive network management application may execute under control of the operating system 210. If operating system 210 is a true multitasking operating system, multiple applications may execute simultaneously.
In the illustrative embodiment, the present invention may be implemented using object-oriented technology and an operating system which supports execution of object-oriented programs. For example, the inventive system may be implemented using a combination of languages such as C, C++, Perl, PHP, Java, HTML, etc., as well as other object-oriented standards.
In the illustrative embodiment, the elements of the system are implemented in the C++ programming language using object-oriented programming techniques. C++ is a compiled language, that is, programs are written in a human-readable script and this script is then provided to another program called a compiler which generates a machine-readable numeric code that can be loaded into, and directly executed by, a computer. As described below, the C++ language has certain characteristics which allow a software developer to easily use programs written by others while still providing a great deal of control over the reuse of programs to prevent their destruction or improper use. The C++ language is well-known and many articles and texts are available which describe the language in detail. In addition, C++ compilers are commercially available from several vendors including Borland International, Inc. and Microsoft Corporation. Accordingly, for reasons of clarity, the details of the C++ language and the operation of the C++ compiler will not be discussed further in detail herein. The program code used to implement the present invention may also be written in scripting languages such as Perl, Java Scripts, or non-compiled PHP. If required, the non-compiled PHP can be converted to machine readable format.
Network Communication Environment
FIG. 2 illustrates a telecommunications environment in which the invention may be practiced such environment being for exemplary purposes only and not to be considered limiting. Network 200 of FIG. 2 illustrates a hybrid telecommunication environment including both a traditional public switched telephone network as well as packet-switched data network, such as the Internet and Intranet networks and apparatus bridging between the two. The elements illustrated in FIG. 2 are to facilitate an understanding of the invention. Not every element illustrated in FIG. 2 or described herein is necessary for the implementation or the operation of the invention.
Specifically, a packet-switched data network 202 comprises a network appliance 300, a plurality of processes 302-306, plurality of monitored devices 314a-n, external databases 310a-n, external services 312 represented by their respective TCP port, and a global network topology 220, illustrated conceptually as a cloud. One or more of the elements coupled to global network topology 220 may be connected directly through a dedicated connection, such as a T1, T2, or T3 connection or through an Internet Service Provider (ISP), such as America On Line, Microsoft Network, Compuserve, etc.
A gateway 225 connects packet-switched data network 202 to circuit switched communications network 204 which includes a central office 210 and one or more traditional telephone terminating apparatus 308a-n. Circuit switched communications network 204 may also include, although not shown, a traditional PSTN toll network with all of the physical elements including PBXs, routers, trunk lines, fiber optic cables, other central offices etc. Terminating apparatus 308a-n may be implemented with either a digital or analog telephone or any other apparatus capable of receiving a call such as modems, facsimile machines, cellular telephones, etc., such apparatus being referred to collectively hereinafter as a terminating apparatus, whether the network actually terminates. Further, the PSTN network may be implemented as either an integrated services digital network (ISDN) or a plain old telephone service (POTS) network.
Each network consists of infrastructure including devices, systems, services and applications. Manageable network components utilize management mechanisms that follow either standard or proprietary protocols. Appliance 300 supports multiple interfaces to manageable devices from various points within its architecture, providing the flexibility to monitor both types of network components.
Components that can be managed using standard or public protocols (including items such as routers, switches, servers, applications, wireless devices, IP telephony processes, etc.) are designed under the premise that such components would reside in networks where a network management system is deployed. Such devices typically contain a MIB (Management Information Base), which is a database of network management information that is used and maintained by a common network management protocol such as SNMP (Simple Network Management Protocol). The value of a MIB object can be retrieved using SNMP commands from the network management system. Appliance 300 monitors the raw status events from such infrastructure directly using various standard protocol queries through a Status. Poller 330 and a Trap Receiver 332, as explained hereinafter.
Network components that were not designed with network management applications may have internal diagnostics capabilities that make it possible to generate an alarm or other data log. This data may be available via an interface and/or format that is proprietary in nature. Such systems may also have the ability to generate log files in text format, and make them available through supported interfaces such as e-mail. If event processing capability is needed, appliance 300 can monitor such network components through custom status plug-ins modules.
Network Appliance Overview
In the illustrative embodiment, except for specific interface hardware, network appliance 300, referred to hereafter as simply as "appliance 300", may be implemented as part of an all software application which executes on a computer architecture similar to that described with reference to FIG. 1. As illustrated in FIGS. 3-5, appliance 300 can communicate either directly or remotely with any number of devices, or processes, including the a worldwide web processes 302, a Personal Digital Assistant 304, an e-mail reader process 306, a telephone 308, e.g., either a traditional PSTN telephone or an IP-enabled telephony process 311, and/or a pager apparatus 310. In addition, appliance 300 can communicate either directly or remotely with any number of external management applications 312 and monitored devices 314. Such communications may occur utilizing the network environment illustrated in FIG. 2 or other respective communication channels as required by the receiving or process.
Appliance 300 monitors network objects, locates the source of problems, and facilitates diagnostics and repair of network infrastructure across the core, edge and access portions of the network. In the illustrative embodiment, appliance 300 comprises a status monitoring module 318, a performance monitoring module 316, a decision engine 324, a case management module 326 and database 348. The implementations of these modules as well as their interaction with each other and with external devices is described hereafter in greater detail.
The present invention uses a priori knowledge of devices to be managed. For example, a list of objects to be monitored may be obtained from Domain Name Server. The desired objects are imported into the appliance 300. The relationships between imported objects may be entered manually or detected via an existing automated process application. In accordance with the paradigm of the invention, any deviation from the imported network configuration is considered a fault condition requiring a modification of the source data. In this manner the network management appliance 300 remains in synchronization with the source data used to establish the network configuration.
Status Monitoring Module
A Status Monitoring Module 318 comprises a collection of processes that perform the activities required to dynamically maintain the network service level, including the ability to quickly identify problems and areas of service degradation. Specifically, Status Monitoring Module 318 comprises Status Poller Module 330, On-Demand Status Poller 335, Status Plug-Ins 391, Bulk Plug-In Poller 392, Bulk UDP Poller 394, Bulk if OperStatus Poller 396, Bulk TCP Poller 398, Bulk ICMP Poller 397, Trap Receiver 332, Status View Maintenance Module 385, and Status Maps and Tables Module 387.
Polling and trapping are the two primary methods used by appliance 300 to acquire data about a network's status and health. Polling is the act of asking questions of the monitored objects, i.e., systems, services and applications, and receiving an answer to those questions. The response may include a normal status indication, a warning that indicates the possibility of a problem existing or about to occur, or a critical indication that elements of the network are down and not accessible. The context of the response determines whether further appliance 300 action is necessary. Trapping is the act of listening for a message (or trap) sent by the monitored object to appliance 300. These trap messages contain information regarding the object, its health, and the reason for the trap being sent.
A plurality of plug-ins and pollers provide the comprehensive interface for appliance 300 to query managed objects in a network infrastructure. Such queries result in appliance 300 obtaining raw status data from each network object, which is the first step to determining network status and health. The various plug-ins and pollers operate in parallel, providing a continuous and effective network monitoring mechanism. Pollers may utilize common protocols such as ICMP (Ping), SNMP Get, Telnet, SMTP, FTP, DNS, POP3, HTTP, HTTPS, NNTP, etc. As a network grows in size and complexity, the intelligent application of polling and trapping significantly enhances system scalability and the accuracy of not only event detection, but also event suppression in situations where case generation is not warranted.
Status Poller
Fault detection capability in appliance 300 is performed by Status Poller 330 and various poller modules, working to effectively monitor the status of a network. Status Poller 330 controls the activities of the various plug-ins and pollers in obtaining status information from managed devices, systems, and applications on the network. FIG. 6 illustrates the status flow between network appliance 300 and external network elements. Status Poller 330 periodically polls one or more monitored devices 314A-N. Status Poller 330 generates a fault poll query to a monitor device 314 and receives, in return, a fault poll response. The fault poll queries may be in the form of any of a ICMP Echo, SNMP Get, TCP Connect or UDP Query. The fault poll response may be in the form of any of a ICMP Echo Reply, SNMP Response, TCP Ack or UDP Response. Status Poller 330 may also receive a fault data request in URL form from web process 302. In response, Status Poller 330 generates and transmits fault data in HTML format to web process 302. Status Poller 330 generates decision requests for decision engine 334 in the form of messages. In addition, Status Poller 332 receives external data from an external management application 312. Trap Receiver 332 receives device generated fault messages from monitored devices 314. Both Trap Receiver 332 and Status poller 330 generate decision requests for decision engine 334 in the form of messages.
Status Poller 330 determines the needed poll types, segregates managed objects accordingly, and batch polls objects where possible. A Scheduler 373 triggers the Status Poller 330 to request polling at routine intervals. During each polling cycle, each monitored object is polled once. If any objects test critical, all remaining normal objects are immediately polled again. A Dependency Checker module which is part of the Root Cause Analysis Module determines which objects have changed status from the last time the Status Poller 330 was run, and determines, using the current state objects and the parent/child relation data, which objects are "dependency down" based on their reliance on an upstream object that has failed. This process repeats until there are no new critical tests found. Once the polling cycle is stable, a "snapshot" of the network is saved as the status of the network until the next polling cycle is complete. The network status information obtained is written into database 352 for use by other processes, such as the Decision Engine 334 when further analysis is required.
Polling a network for status information is an effective method of data gathering and provides a very accurate picture of the network at the precise time of the poll, however, it can only show the state of the network for that moment of time. Network health is not static. A monitored object can develop problems just after is has been polled and reflected a positive operational result. Moreover, this changed status will not be known until the device is queried during the next polling cycle. For this reason appliance 300 also incorporates the use of the Trap Receiver 332 to provide near real-time network status details.
Trap Receiver
A trap is a message sent by an SNMP agent to appliance 300 to indicate the occurrence of a significant event. An event may be a defined condition, such as a link failure, device or application failure, power failure, or a threshold that has been reached. Trapping provides a major incremental benefit over the use of polling alone to monitor a network. The data is not subject to an extended polling cycle and is as real-time as possible. Traps provide information on only the object that sent the trap, and do not provide a complete view of network health. Appliance 300 receives the trap message via Trap Receiver 332 immediately following the event occurrence. Trap Receiver 332 sends the details to Status View Maintenance Module 385, which requests the Status Poller 330 to query the network to validate the event and locate the root cause of the problem. Confirmed problems are passed to Case Management Module 326 to alert network management personnel.
The On-Demand Status Poller 335 provides status information to Decision Engine 334 during the verification stage. Unlike the Status Poller 330, On-Demand Status Poller 335 only polls the objects requested by the Decision Engine 334. Since this is usually a small subset of objects, the status can typically be found more quickly. The responses from these polls are fed back to the Decision Engine 334 for further processing and validation.
The Status View Maintenance Module 385 provides a gateway function between the Status Poller 330, and Root Cause Analysis and the Decision Engine Modules. The Status View Maintenance Module 385 controls the method by which network status information is created, maintained, and used. It serves as the primary interface for the depiction of network status details in the Status Maps and Status Table 387. Detailed object status information is presented through four (4) statuses: raw, dependency, decision, and case.
The Status Maps and Tables Module 387 is used to generate representations of complex relationships between network devices, systems, services and applications. Status Maps and Tables Module 387 works in conjunction with web server application 381 using known techniques and the HTML language to provide a web accessible user interface to the data contained in database 352. A Status Map depict the precise view of managed objects and processes as defined during the implementation process. The Status Map provides a fast and concise picture of current network issues, providing the ability to determine the specific source of network failure, blockage or other interference. Users can zoom to the relevant network view, and launch an object-specific Tools View that assists in the diagnostics and troubleshooting process and may include links to third party management tools, such as Cisco Resource Manager Essentials (RME), etc.
A Status Table enables a tabular view of managed network infrastructure. All managed network components 314 can be displayed individually, or assembled under categories according to device type, location, or their relationship to the monitoring of Groups of objects representing complete processes or other logical associations. As described in the User Interface section hereafter, a series of unique status icons clearly depict the operational state of each object, with the option to include more comprehensive status views including greater details on the various process elements for managed objects.
Status Plug-Ins/Bulk Pollers
As will be understood by those skilled in the arts, a plug-in, as used herein, is a file containing data used to alter, enhance, or extend the operation of an parent application program. Plug-ins facilitate flexibility, scalability, and modularity by taking the input from the a proprietary product and interfacing it with the intended application program. Plug-in modules typically interface with Application Program Interfaces (API) in an existing program and prevent an application publisher from having to build different versions of a program or include numerous interface modules in the program. In the present invention plug-ins are used to interface the status poller 335 with monitored objects 314.
The operation of plug-ins and bulk pollers is conducted at routine intervals by the Status Poller Module 330, and, on an as-needed basis, by the request of the On-Demand Status Poller Module 335. In the illustrative embodiment, the primary status plug-ins and pollers include Status Plug-ins 391, Bulk Plug-In Poller 392, Bulk UDP Poller 394, Bulk if OperStatus Poller 396, Bulk TCP Poller 398 and Bulk ICMP Poller 397.
Status Plug-Ins 391 conduct specific, individual object tests. Bulk Plug-In Poller 392 makes it possible to conduct multiple simultaneous tests of plug-in objects. Unlike many network management systems that rely solely on individual object tests, the Bulk Plug-In Poller 392 enables a level of monitoring efficiency that allows appliance 300 to effectively scale to address larger network environments, including monitoring via SNMP (Simple Network Management Protocol). Used almost exclusively in TCP/IP networks, SNMP provides a means to monitor and control network devices, and to manage configurations, statistics collection, performance, and security.
Bulk UDP Poller 394 is optimized to poll for events relating to UDP (User Datagram Protocol) ports only. UDP is the connectionless transport layer protocol in the TCP/IP protocol stack. UDP is a simple protocol that exchanges datagrams without acknowledgments or guaranteed delivery, requiring that error processing and retransmission be handled by other protocols. Bulk UDP Poller 394 permits multiple UDP polls to be launched within the managed network.
Bulk if OperStatus Poller 396 monitors network infrastructure for the operational status of interfaces. Such status provides information that indicates whether a managed interface is operational or non-operational.
Bulk TCP Poller 398 polls for events relating to TCP (Transmission Control Protocol) ports only. Part of the TCP/IP protocol stack, this connection-oriented transport layer protocol provides for full-duplex data transmission. Bulk TCP Poller 398 permits multiple TCP polls to be launched within the managed network.
Bulk ICMP Poller 397 performs several ICMP (ping) tests in parallel. Bulk ICMP Poller 397 can initiate several hundred tests without waiting for any current tests to complete. Tests consists of an ICMP echo-request packet to an address. When an ICMP echo-reply returns, the rawO status is deemed normal. Any other response or no answer within a set time generates a new echo-request. If an ICMP echo-reply is not received after a set number of attempts, the raw status is deemed critical. The time between requests (per packet and per address), the maximum number of requests per address, and the amount of time to wait for a reply are tunable by the network administrator using appliance 300.
Performance Monitoring Module
The primary component of performance monitoring module 316 is performance poller 322. Performance poller 322 is the main device by which appliance 300 interacts with monitored device(s) 314a-n and is responsible for periodically monitoring such devices and reporting performance statistics thereon. Performance poller 322 is operatively coupled to application(s) 312, monitored device(s) 314, decision engine 334 and web process(es) 302. FIG. 10 illustrates the communication flow between the performance poller 322 and decision engine 334, as well as external elements. Performance poller 322 polls monitored device(s) 314a-n periodically for performance statistics. Specifically, performance poller 322 queries each device 314 with an SNMP Get call in accordance with the SNMP standard. In response, the monitored device 314 provides a performance poll response to performance poller 322 in the form of an SNMP Response call, also in accordance with the SNMP standard. Based on the results of the performance poll response, performance poller 322 generates and transmits decision requests to decision engine 334 in the form of messages. Such decision requests may be generated when i) a specific performance condition occurs, ii) if no response is received within predefined threshold, or iii) if other criteria are satisfied. Decision engine 334 is described in greater detail hereinafter. In addition, one or more external management applications 312 provide external management data to performance poller 322 in the form of messages.
In the illustrative embodiment, performance poller 322 may have an object-oriented implementation. Performance poller 322 receives external data from applications 312 through message methods. Such external applications may include Firewalls, Intrusion Detection Systems (IDS), Vulnerability Assessment tools, etc. Poller 322 receives performance data requests from web process 302 via Uniform Resource Locator (URL) methods. In response, poller 322 generates performance data for web process 302 in the form of an HTML method. In addition, poller 322 receives performance poll response data from a monitored device 314 in the form of an SNMP response method. In addition, poller 322 receives performance poll response data from a monitored device 314 in the form of an SNMP response method. As output, poller 322 generates a performance poll query to a monitored device 314 in the form of an SNMP Get method. Performance poller 322 generates decision requests to decision engine 334, in the form of a message.
Performance Poller 322 obtains performance data from network devices and applications, creating a comprehensive database of historical information from which performance graphs are generated through the user interface of appliance 300, as described hereafter. Such graphics provide network management personnel with a tool to proactively monitor and analyze the performance and utilization trends of various devices and applications throughout the network. In addition, the graphs can be used for diagnostics and troubleshooting purposes when network issues do occur.
A series of device-specific Performance Plug-Ins 321 serve as the interface between the Performance Poller 322 and managed network objects. The performance criteria monitored for each component begins with a best practices of network management approach. This approach defines what elements within a given device or application will be monitored to provide for the best appraisal of performance status. The managed elements for each device or application type are flexible, allowing for the creation of a management environment that reflects the significance and criticality of key infrastructure. For instance, should there be an emphasis to more closely monitor the network backbone or key business applications such as Microsoft Exchange, a greater focus can be placed on management of this infrastructure by increasing the performance criteria that is monitored. Likewise, less critical infrastructure can be effectively monitored using a smaller subset of key performance criteria, while not increasing the management complexity caused by showing numerous graphs that are not needed.
Once the performance management criterion is established, the Performance Plug-Ins are configured for each managed device and application. Performance elements monitored may include, but are not limited to, such attributes as CPU utilization, bandwidth, hard disk space, memory utilization, or temperature. Appliance 300 continuously queries managed or monitored objects 314 at configured intervals of time, and the information received is stored as numeric values in database.
Event Processing
The appliance 300 architecture comprises sophisticated event processing capability that provides for intelligent analysis of raw network event data. Instead of accumulating simple status detail and reporting all network devices that are impacted, appliance 300 attempts to establish the precise cause of a network problem delivering the type and level of detail that network management personnel require to quickly identify and correct network issues. The primary components of event processing capability in appliance 300 are the Root Cause Analysis Module 383 and the Decision Engine 334.
Root Cause Analysis
When a change in network status is observed that may indicate an outage or other issue, the Status Poller 330 presents the to the Root Cause Analysis module 383 for further evaluation. During the course of a network problem or outage, this may consist of tens or even hundreds of status change event messages. These numerous events may be the result of a single or perhaps a few problems within the network.
The Root Cause Analysis Module 383 works directly with the Decision Engine 334 during the event evaluation process. Appliance 300 first validates the existence of an event and then identifies the root cause responsible for that event. This process entails an evaluation of the parent/child relationships of the monitored object within the network. The parent/child relationships are established during the implementation process of appliance 300, where discovery and other means are used to identify the managed network topology. A parent object is a device or service that must be functional for a child device or service to function. A child object is a device or service that has a dependency on a parent device or service to be functional. Within a network environment a child object can have multiple parent objects, and a parent object can have multiple children objects. In addition, the parent and child objects to a node or monitored object may be located at the same or different layers of the OSI network protocol model across the computer network. Because of this, a Dependency Checker function within Root Cause Analysis Module 383 performs a logical test on every object associated with a monitored object in question to isolate the source of the problem. When appliance 300 locates the highest object in the parent/child relationship tree that is affected by the event it has found the root cause of the problem.
Case Management System
The Case Management system 336 is an integral component of appliance 300 and provides service management functionality. Whereas the Decision Engine 334 works behind the scenes to identify and validate faults, Case Management system 336 is the interface and tool used to manage information associated with the state of the network. Case Management system 336 provides a process tool for managing and delegating workflow as it relates to network problems and activities. The Case Management generates service cases (or trouble tickets) for presentation and delivery to network management personnel.
Case management system 336 comprises a CMS application module 350, a database 352, a notification engine 356 and an escalation engine 354, as illustrated. CMS application module 350 comprises one or more applications and perform the CMS functionality, as explained hereinafter. CMS applications 350 receive CMS requests, in the form of URL identifiers from decision engine 334. In response, CMS applications 350 generate and transmit notification requests to notification engine 356, in the form of messages. CMS applications 350 generate and transmit CMS data to a worldwide web process 302 in the form of HTML data. Database 352 receives CMS queries from CMS applications 350 in the form of messages and generates in response thereto a CMS response in the form of a message, as well. In addition, database 352 receives notification queries from notification client 364, in the form of messages and generates, in response there, notification responses to notification client 364 in the form of messages as well.
Case Management system 336 accommodates Auto cases and Manual cases. Cases passed to the Case Management System from the Decision Engine Module appear as AutoCases. These system-generated cases are associated with a network problem. Appliance 300 has determined that the node referenced in the case is a device responsible for a network problem, based on the findings of Root Cause Analysis and the Decision Engine 334. The Auto Case is automatically assigned an initial priority level that serves until the case is reviewed and the priority is modified to reflect the significance of the problem relative to the network impact and other existing cases being handled.
Cases entered into Case Management system 336 by the network manager or network management personnel are called Manual Cases. This supports the generation, distribution, and tracking of network work orders, or can aid in efforts such as project management. Using a web browser, personnel can obtain the case data from either on-site or remote locations, and access a set of device-specific tools for diagnostics and troubleshooting. Unlike other general-purpose trouble ticketing systems, the appliance 300 has case management capabilities are specifically optimized and oriented to the requirements of network management personnel. This is reinforced in both the types and level of information presented, as well as the case flow process that reflects the specific path to network issue resolution. Opening a case that has been generated shows the comprehensive status detail such as the impacted network node, priority, case status, description, and related case history. The network manager or other personnel can evaluate the case and take the action that is appropriate. This may include assigning the case to a network engineer for follow-up, or deleting the case if a device has returned to fully operational status.
The main Case Management screen of the user interface provides a portal through web server application 381 from which all current case activity can be viewed, including critical cases, current priority status, and all historical cases associated to the specific object. Case data is retained in appliance 300 to serve as a valuable knowledge-base of past activity and the corrective actions taken. This database is searchable by several parameters, including the ability to access all cases that have pertained to a particular device. A complete set of options is available to amend or supplement a case including: changing case priority; setting the case status; assigning or re-assigning the case to specific personnel; correlating the case to a specific vendor case or support tracking number, and updating or adding information to provide further direction on actions to be taken or to supplement the case history.
Escalation engine 354 tracks escalations and requests notifications as needed. Escalation engine 354 generates and transmits escalation queries to database 352 in the form of messages and receives, in response thereto, escalation responses in the forms of messages. In addition, escalation engine 354 generates and transmits notification requests, in the form of messages, to notification server 360 of notification engine 356, in the form of messages. Automated policy-based and roles-based case escalation processes ensure that case escalations are initiated according to defined rules and parameters. Cases not responded to within pre-established time periods automatically follow the escalation process to alert management and other networking personnel of the open issue.
Notification Engine
When a new auto case or manual case is generated or updated, appliance 300 initiates a notification process to alert applicable network personnel of the new case. This function is provided through Notification Engine 356. Appliance 300 utilizes a configurable notification methodology that can map closely an organization's specific needs and requirements. Appliance 300 incorporates rules- and policy-based case notification by individual, role, or Group, and includes additional customizability based on notification type and calendar. Supported notification mechanisms include various terminal types supporting the receipt of standard protocol text messaging or e-mail, including personal computer, text pager, wireless Personal Digital Assistant (PDA), and mobile phones with messaging capability. The e-mail or text message may contain the important details regarding the case, per the notification content format established in system configuration.
As illustrated in FIG. 9, notification engine 356 comprises notification server 360, database 352, notification client 364, paging client 366, paging server 367, Interactive Voice Response (IVR) server 368 and SMTP mail module 369. Notification engine 356 generates notifications via e-mail and pager as necessary. Notification server 360 accepts notification requests, determines notification methods, and stores notifications in database 352. As stated previously, notification server 360 receives notification requests from CMS applications 350. Notification server generates and transmits Point Of Contact (POC) queries in the form of messages to database 352 and receives, in response thereto, POC responses, also in the form of messages. Notification client 364 generates notifications using appropriate methods. Notification client 364 generates and transmits notification queries, in the form of messages, to database 352 and receives in response thereto notification responses, also in the form of messages. In addition, notification client 364 generates and transmits page requests in the form of messages to paging client 366. Notification client 364 further generates, in the form of messages, IVR requests to IVR server 368 and e-mail messages to SMTP mail module 369. Paging client 366 receives page requests from notification client 364 and forwards the page requests onto page server 367. Paging server 367 generates pager notifications, in the form of messages, to a pager device 310. Paging server 367 accesses a TAP terminal via a modem or uses the Internet to forward the pager notification. IVR server 368 receives IVR requests and calls phone 308 via an IVR notification in the form of a telephone call which may be either packet-switched or circuit-switched, depending on the nature of the terminating apparatus and the intervening network architecture. SMTP mail module 369 processes notifications via e-mail and acts as a transport for paging notifications. SMTP mail module 369 generates messages in the form of e-mail notifications to e-mail process 306 and PDA notifications to personal digital assistant device 304.
Decision Engine
Decision Engine 334 is an extensible and scaleable system for maintaining programmable Finite State Machines created within the application's structure. Decision Engine 334 is the portion of system architecture that maintains the intelligence necessary to receive events from various supporting modules, for the purpose of verifying, validating and filtering event data. Decision Engine 334 is the component responsible for reporting only actual confirmed events, while suppressing events that cannot be validated following the comprehensive analysis process.
Referring to FIG. 7, decision engine 334 comprises, in the illustrative embodiment, a queue manager 340, decision processor 344, case generator 346, database 352 and one or more plug in modules 342. As illustrated, decision engine 334 receives decision requests from any of Performance poller 322, Status Poller 330 or Trap Receiver 332, in the form of messages. A queue manager 340 manages the incoming decision requests in a queue structure and forwards the requests to decision processor 344 in the form of messages. Decision processor 344 verifies the validity of any alarms and thresholds and forwards a generation request to case generator request 346 in the form of a message. Case generator 346, in turn, compiles cases for verification and database information and generates a CMS request which is forwarded to case management system 336, described in greater detail hereinafter.
In addition, decision processor 344 generates and transmits device queries in the form of messages to database 352. In response, database 352 generates a device response in the form of message back to decision processor 344. Similarly, decision processor 344 generates and transmits verification queries in the form of messages to plug in module 342. In response, module 342 generates a verification response in the form of a message back to decision processor 344. Plug in module 342 generates and transmits verification queries in the form of messages to a monitored device 314. In response, monitored device 314 generates a verification response in the form of a message back to plug-in module 342.
Decision engine 334 may be implemented in the C programming language for the Linux operating system, or with other languages and/or operating systems. Decision engine 334 primarily functions to accept messages, check for problem(s) identified in the message, and attempts to correct the problem. If the problem cannot be corrected the decision engine 334 opens a "case". In the illustrative embodiment, decision engine 334 may be implemented as a state-machine created within a database structure that accepts messages generated by events such as traps and changes state with messages. If the decision engine reaches certain states, it opens a case. The main process within the decision engine state-machine polls a message queue and performs the state transitions and associated tasks with the transitions. Events in the form of decision requests are processed by the decision engine/virtual state-machine. The decision module/virtual state-machine processes the request and initiates a verification query. The verification response to the verification query is processed by the decision module/virtual state-machine. Based on the configuration of the decision module/state-machine the decision module/state machine initiates a case management module case request. Events are polls, traps, and threshold violations generated by the status poller, fault trapper, and performance poller respectively. As shown in FIG. 11, decision engine 334 comprises several continuously running processes or modules including populate module 380, command module 382, decision module 384, variable module 386, on demand status poller module 388, and timer module 390, described in greater detail hereinafter. These processes may launch new processes when required. In the illustrative embodiment, these processes share 415 database tables in database 352 as a means for communication by accessing and manipulating the values within the database. In FIGS. 4-6 and 10, the functions of Decision Engine 334 are performed by command module 382, decision module 384, variable module 386, on demand status poller module 388, and timer module 390, described in greater detail hereinafter. In FIG. 7, the functions of Decision Processor 344 are performed by decision module 384, variable module 386, on demand status poller module 388, and timer module 390. The functions of Case Generator 346 is performed by command module 382.
Populate Module
The populate module 380 creates and initializes the state machine(s) to the "ground" state for each managed object 314 whenever a user commits changes to their list of managed objects. In the illustrative embodiment, unless purposefully overridden, the populate module 380 will not overwrite the current machine state for a managed object. Otherwise, notifications could be missed. Also, the deletion of an object upon a commit results in the deletion of all state machines, timers, and variables associated with the object to prevent unused records and clutter in database 352.
Command Module
The command module 382 retrieves records from the command table, performs the task defined in a database record, and, based on the result returned by the command, places a message in the message queue, i.e. the Message Table. In the illustrative embodiment, a command can be any executable program, script or utility that can be run using the system( ) library function.
In illustrative embodiment, the command module 382 may be implemented in the C programming language as a function of a Decision Engine object and perform the functions described in the pseudo code algorithm set forth below in which any characters following the "#" symbol on the same line are comments: while TRUE # loop forever retrieve the record that has been sitting in the commands queue table for the longest period of time use the system command (or some other as yet to be determined method) to execute the command found in the action field of the current record. The argument list for action will be build using the values found in the host, poll, instance, and argument fields of the current record. Upon completion of the command, if the message found in the message field is not blank, put the message into the message queue. #end loop forever
Decision Module
The decision module 384 retrieves messages from the message queue, determines which state machine the message is intended for, changes the state of the machine based on the content of the message, and "farms out" to the other modules the tasks associated with the state change. In the illustrative embodiment, a task has associated therewith a number of optional components including a type, action, arguments, condition and output message. A brief description of each task component is shown below: type-identifies which module, i.e., command, variable, timer, or on demand state poller, that is to perform the task. The action of some types of tasks may be handled by the decision module and not sent to another module. For example, a message with the type "say" is just a request to put a new message into the message queue. The decision module handles such task. action-the specific action the module is to take. For example, increment a counter or start a timer. arguments-any arguments required to complete the action condition-if present, identifies a condition that must be met before the associated message can be put into the message queue. A condition may consist of a comparison between the value of a variable stored in the variables table and a constant value or the value of another variable that evaluates as either true or false. An example condition would be "count>5", which means that the value of the value field in the variables table record where the value of the varName field is 'count' for the current object should be greater than five for a message to be put into the queue. Condition expressions may be of the form: <VAR_NAME COMPARISON_OPERATOR VALUE>[[AND|OR] [VAR_NAME COMPARISON_OPERATOR VALUE]] . . . By adhering to this format, the code that parses the condition expression will not have to be changed if the condition expression changes. Also, such format allows for arbitrarily complex condition expressions. output message-the message to be put into the message queue upon completion of the task. The output message can be blank indicating that there is no message to put into the message queue on completion of the task. Since messages are deleted as they are taken or "popped" from the message queue, the messages may be logged to the log table in database 352 to provide a permanent record of message traffic.
In order to provide additional flexibility to the arguments field of the active_timers, command_queue, and variable_queue tables, the arguments field in the transition_functions and state_functions tables may be allowed to contain patterns that can match any of the field names found in the messages table or the value of any varName field in the variables table. When a matching pattern is found it is replaced with the value from the messages table field that the pattern matches or, if the pattern matches a varName field in the variables table, the pattern is replaced with the appropriate value from the from the value field in the variables tables. The format for a replaceable pattern may be: %[PATTERN]%
Where PATTERN is count, name, or saveInfo, for example. Pattern matching and replacement may be done within the decision module before a "task" record is created for one of the queues. The varName field in the variables table should not have a value that conflicts with the field names in the messages table. Since the message table is checked first, the use of a varName that matches a field in the messages table would result in the pattern being replaced with a value different from what the user expected. To prevent this from happening, any attempt to add a record to the variable table may have to have the value of the varName field checked against a list or reserved words.
In illustrative embodiment, the decision module 384 may be implemented in the C programming language as a function of a Decision Engine object and perform the functions described in the pseudo code algorithm set forth below in which any characters following the "#" symbol on the same line are comments: 1 while True # run forever retrieve all messages from the messages table (with a LIMIT of 100 messages) 2 for each message parse the message record into its component parts: message, object (host, poll, instance), and extra_info using the object value create an SQL query that will retrieve the current state record for all active machines of the object 3 for each machine of object use the message and the current state of the machine to create an SQL query that will retrieve the next state of the machine 4 if a next state is found update the current state record for the machine in the current_state table to the new state Using the current machine type, the current state (pre- transition) and the message, create an SQL query that will retrieve all tasks that are to be performed as a result of the machine receiving the current message from the transition_functions table 5 for each task determine the type of task (timer, counter, status request, or command) and insert into the appropriate module's queue a task record with field values set to the values found in the current transition_functions table record. If the arg field from the transition_functions record contains a recognized replaceable string with the pattern %[PATTERN%], replace the string with the value retrieved from the current messages table record from the field that matches the replaceable string. If the pattern does not match one of the field names from the messages table, Check the variables table for a record with a varName field with a value that matches the pattern. If a record is found, replace the pattern with the value of the value field from the variables table record with the matching varName # end for each task Using the current machine type and the post transition state create an SQL query that will retrieve all tasks that are to be performed as a result of the machine "arriving" at the next state from the state_functions table. If the arg field from the state_functions record contains a recognized replaceable string, replace the string with the value retrieved from the current record from the field that matches the replaceable string. 6 for each task determine the type of task (timer, counter, status request, or command) and insert into the appropriate module's queue a task record with field values set to the values found in the current transition_functions table record. If the arg field from the transition_functions record contains a recognized replaceable string with the pattern %[PATTERN%], replace the string with the value retrieved from the current messages table record from the field that matches the replaceable string. If the pattern does not match one of the field names from the messages table, Check the variables table for a record with a varName field with a value that matches the pattern. If a record is found, replace the pattern with the value of the value field from the variables table record with the matching varName # end for each task 4 # end if 3 # end for each machine of object 2 # end for each message 1 # end of while forever loop
Variable Module
The Variable module 386 retrieves records from the variable_queue table, performs the task defined in the record, and, upon completion of the task, puts the associated message into the message queue. Currently defined tasks include incrementing a counter, decrementing a counter, setting a counter to a specific value, and saving a "note" for later use. All tasks performed by the variable module 386 consist of either setting a variable to a value or updating a variable with a new value. In the illustrative embodiment, task statements may be assignment statements of the form: VAR_NAME=VALUE
Where VAR_NAME is the name of variable being set or updated and VALUE is the value that VAR_NAME is being set to. VALUE can be of any data type (integer, float, or string, e.g.). VALUE can be a single value, such as 6, or consist of an expression that can include the VAR_NAME, such as count+1. If present in the current variable record, a condition has to be met before the message is put into the message queue.
In illustrative embodiment, the variable module 386 may be implemented in the C programming language as a function of a Decision Engine object and perform the functions described in the pseudo code algorithm set forth below in which any characters following the "#" symbol on the same line are comments: 1 while TRUE # loop forever retrieve all records ordered by time in an ascending order from the variable queue with a LIMIT of 100 records 2 for each record if the the value of the action field is a non-empty string determine the name of the variable that is to be set or updated. The name of the variable will always be the Ivalue of the assignment statement and be of the form %[VAR_NAME]% = [SOME_VALUE] where VAR_NAME is replaced with the actual variable name (count, e.g.). Using the VAR_NAME create an SQL query that will determine whether or not a record for this variable exists in the variables table if the variable is not in the variables table, INSERT a record into the variables table with the varName set to VAR_NAME and value set to SOME_VALUE if the variable is in the variables table, UPDATE the record with varName set to VAR_NAME and value set to SOME_VALUE 3 if there is a non-null value in the condition field of the current record create an SQL query using the condition value ("count > 5", e.g.) that will test whether or expression defined in the condition is true or false perform the query 4 if the query returns "true" (i.e., the condition has been met) insert the message found in the message field of the current record into the message queue. # end if 3 # end if else there is no condition. insert the message found in the message field of the current record into the message queue else there is no condition. insert the message found in the message field of the current record into the message queue 2 # end for each record 1 # end loop forever
On Demand Status Poller Module
The on demand status poller module 388 retrieves records from the status_request table with a user defined frequency, e.g. every 10 seconds. The module improves efficiency by batching status requests which will all be "launched" at the same time. The retrieved status requests are "farmed out" to the appropriate poller module. The on demand status poller module 388 waits for the results of the status requests to be returned by the pollers. Based on the result, the appropriate message is inserted into the message queue.
In illustrative embodiment, the on demand status poller module 388 may be implemented in the C programming language as a function of the Decision Engine object and perform the functions described in the pseudo code algorithm set forth below, in which any characters following the "#" symbol on the same line are programmers comments: retrieve all records from the statReq table Based on the type of the poll request (ICMP, TCP, PLGN, etc) "farm out" t he status requests to the appropriate bulk poller. retrieve the results (up or down) returned by the bulk pollers for each status poll result insert the appropriate message into the message queue # end for loop
Timer Module
The timer module 390 retrieves records from the active_timers table, performs the tasks defined in the record, and, upon completion of the task, puts the associated message into the message queue. Currently defined tasks include expiring a timer and clearing a timer. If present in the current timer record, a condition has to be met before the message is put into the message queue. An example condition would be "UNIX_TIMESTAMP>exp_time", which checks to see if a timer has expired.
In illustrative embodiment, the timer module 390 may be implemented in the C programming language as a function of the Decision Engine object and perform the functions described in the pseudo code algorithm set forth below in which any characters following the "#" symbol on the same line are programmers comments: 1 while TRUE # loop forever retrieve all records with an action of either clearTimer, clearTimers, or resetTimer 2 for each record if the action is clearTimer if the current record has a non-blank argument, delete the oldest record with an action of setTimer and with a message that equals the value of the argument field for the current object/machine tuple. Otherwise, delete the oldest record with an action of setTimer for the current object/machine tuple without regard for the value of the message field else if the action is clearTimers delete all records with an action of setTimer for the current object/machine tuple else if the action is resetTimer reset the appropriate timer by updating the timer record that is to be reset with the following psuedoSQL statement: update timer_que set timer_id = current time, argument = current_argument where object = current object and message = current message. # end for each record delete all records with an action of either clearTimer or clearTimers retrieve all records where the action is setTimer and timer_id < current time with a LIMIT of 100 records 3 for each record 4 if there is a non-null value in the condition field of the current record create an SQL query using the condition value perform the query 5 if the query returns "true" (i.e., the condition has been met) insert the message found in the message field of the current record into the message queue. 5 # end if the condition is met 4 # end if there is a condition else there is no condition. insert the message found in the message field of the current record into the message queue. 3 # end for each record delete all of the records just retrieved. Delete the records based on the unique timer_id to ensure that the correct records are deleted. 1 # end loop forever
One or more of the above described processes or modules, including populate module 380, command module 382, decision module 384, variable module 386, on demand status poller module 388, and timer module 390, operate in conjunction to collectively perform the functions the elements of decision engine 334 and other elements of appliance 300 as noted herein.
Finite and Virtual State Machines
FIGS. 12A-C are provided as visual aid to help the reader understand the nature of state machines. A two-state state machine can be represented by the diagram illustrated in FIG. 12A. The diagram FIG. 12A can be interpreted as follows: If you are at StateA and if you get a message "message", then do what is specified in "transition" and after that we are at StateB. For design purposes, the same state machine can be represented as illustrated in FIG. 12B. A more complex machine may be illustrated in the diagram of FIG. 12C. The state machine illustrated in the diagram of FIG. 12C may be represented as a virtual state machine in database 352 as shown in Table I below: TABLE 1 "sm_Table" state_name Function Message Target_state Active A FuncA( ) Msg_1 B 1 B FuncB( ) Msg_2 A 0
In the illustrative embodiment, messages are the mechanism to make a state machine change state, in addition to control messages to initialize state machines or to forcefully change state. Messages arrive from a message queue. At any time only the active states can accept messages. The last column in Table 1 determines the active state for the state machine. Only one state is active (active=1) and all other states are inactive (active=0). If no active state can accept the message, the message is discarded. Initially, the state machine is at ground state, meaning the ground state is the only active state. After handling of the message, the machine returns to the ground state again.
Messages are kept in a database table and handled in a first come first served basis. Each message has an associated timestamp with it, which helps to determine which message arrived earlier. Since that timestamp is unique it is also used as the message id, as shown in Table 2 below: TABLE 2 "messages" msg_id msg 971456805855844 TOP_down 971456805878973 SNMP_down
A state machine will frequently request waiting before changing states. Instead of launching new processes for each wait request, a single timer process operating on a set of timers may do the same job with much less resource. A special timers table is employed for that purpose. Since a unique id for each timer is needed, a timestamp may also be used for that purpose, as shown in Table 3 below: TABLE 3 "timers" Timer_id expiration msg 971456805855844 971456865855844 Wait1min_over 971456805858344 971457105855844 Wait5min_over
The timer process operates on the timers table by checking for the expiration of timers and if the current time is past expiration, deletes the entry from table and inserts the message into the message queue.
Frequently the functions to be executed at state transitions are status requests. Instead of launching those requests everytime they are requested, the requests may be kept in a status_request table, as shown in Table 4 below. The status handler process handles the execution of those status requests using Table 4. TABLE 4 "status_request" Req_id StatusReqst_name msg 971456805858344 Check_TCP TCP_OK 971457105855844 Check_AC AC_OK
Given a fundamental understanding of state machines and how their respective states can be changed using message input, the finite state machine models on which all the virtual state machines used within the appliance 300 are is described hereafter. Records contained within database 352 define several finite state machine models managed by decision engine 334.
Finite State Machines
Decision Engine 334 is designed to minimize resource utilization, allow for the launching of multiple Finite State Machines, and conduct multiple activities simultaneously. Decision Engine 334 can be used to perform any decision making process which can be modeled by a Finite State Machine. A finite state machine model in accordance with the illustrative embodiment may be defined by the following: A finite set of states. Each state represents a condition or step in the decision process. Only one state in each machine may be active at a time, and this is referred to as the 'Current State' A finite set of inputs. (events that trigger state changes and the execution of actions) Inputs are represented as messages pertaining to objects, providing the events that trigger state changes and the execution of actions. Any message that does not have a Current State with a transition waiting (listening) for it will be considered invalid and discarded. This provides the validation process for the Decision Engine 334. An infinite number of possible messages are filtered to allow only a finite number of messages through when they are valid. Finite set of transitions. Given a particular state and a particular message, transfer is facilitated to the next state. At the point in time when the transition occurs, it can initiate any tasks defined for the transition and target state. Each transition is uniquely defined by the 'Current State, Message and Destination State'.
Set of transition tasks that define zero or more actions that are to be performed based on the current state and input received (e.g., anytime current state is 'StateA' and the input 'MessageA', perform the transition tasks for 'StateA, MessageA.' For example, actions may include launching the On-Demand Status Poller Module to recheck the status of an object, setting a timer, and opening a case that identifies an object as being critical. Set of state tasks that define zero or more actions that are to be performed based on the next state independent of the input or current state (e.g., anytime the target state is 'StateA' perform the state tasks for 'StateA').
To keep the number of records in database 352 manageable no matter how large the number objects managed by apparatus 300, each type of finite state machine is defined only once. For each managed object 314 a virtual state machine comprising the name of the object, the type of state machine and the current state of the state machine is added to and maintained by database 352. As events are received, the decision engine 334 uses database 352 to "look up" the next state and the actions to be performed in the tables and records that define the state machines. FIGS. 16-20 illustrate several finite state machine models supported by the illustrative embodiment of the apparatus 300 including the finite set of states within each finite state machine model and the input data necessary to change states. A description of each finite state machine model is described below.
noWaitVerify State Machine
FIG. 16 illustrates the noWaitVerify finite state machine model 1600 supported by the illustrative embodiment of appliance 300. The purpose of the noWaitVerify state machine 1600 is to verify the status of an object (as up or down) by requesting that the appropriate poller module recheck the status of the object. If the result of the recheck matches the last status of the object, the object's status is verified and a case is opened or updated as appropriate. The functionality of the noWaitVerify state machine is described in pseudo code forth below: Accept critical "status events" from the dependency module. Send a poll request to the on-demand status poller. If the "status" is verified to be critical, update a case with "warning". If the "status" remains critical for 10 minutes, update a case with "critical". If the "status" remains critical for 1 hour, update case. If the "status" returns to normal, verify status and update a case with "normal".
Table 5 below identifies the next state transitions and associated actions for the noWaitVerify state machine: State Name Input Next State Actions Ground Critical verifyCritical Start 10 min. Timer Start 1 hr. Timer Re- poll status of object verifyCritical Critical critical Start 500 sec. Timer Open new case verifyCritical Normal Ground No actions critical Critical600 critical Update case with 10 min. warning critical Critical3600 critical Update case with 1 hour warning critical Normal verifyNormal Re-poll status of object critical Retest critical Start 500 sec. Timer Re-poll status of object verifyNormal Critical critical Clear current 500 sec. Timer Start a new 500 sec. timer verifyNormal Normal Ground Update case with "returned to normal" message
icmpVerify State Machine
FIG. 17 illustrates the icmpVerify finite state machine model 1700 supported by the illustrative embodiment of the apparatus 300. The purpose of the icmpVerify state machine is to verify the status of an object (as up or down) by requesting that the appropriate poller recheck the status of the object. If the result of the recheck matches the last status of the object, the object's status is verified and a case is opened or updated as appropriate. What differentiates the noWaitVerify state machine from the icmpVerify state machine is that the icmpVerify state machine waits 40 seconds before requesting that an object's status be rechecked. The functionality of the icmpVerify state machine is described in pseudo code forth below: Accept critical "status events" from the dependency module. Wait at feast 40 seconds in case spanning tree is causing the problem. Send a poll request to the on-demand status poller. If the "status" is verified to be critical, open or update a case with 'Warning' If the "status" remains critical for 10 minutes, update a case with "critical". If the "status" remains critical for 1 hour, update case. If the "status" returns to normal, verify status and update a case with "normal".
slidingWindow State Machine
FIG. 18 illustrates the slidingWindow finite state machine model 1800 supported by the illustrative embodiment of the apparatus 300. The purpose of the slidingWindow state machine is to suppress case updates and the associated notifications caused by objects that are "flapping". That is, objects that have a status that is repeatedly changing back and forth from up and down. The functionality of the slidingWindow state machine is described in pseudo code forth below: Accept "extra_info" from other state machines and update cases. If the rate of AutoCase updates exceeds 5 in a sliding 30 minute window, suppress any more, update case saying "AutoCase updates Suppressed!" If any new AutoCases come in during the suppressed state, hold onto the latest info. When the rate drops below 4 per 30 minutes, update case with the last "info" and say "AutoCase updates Resumed!".
upsOnline State Machine
FIG. 19 illustrates the upsOnline finite state machine model 1900 supported by the illustrative embodiment of the apparatus 300. The purpose of the upsOnline state machine is to monitor the status of an uninterruptible power supply (UPS). The upsOnline State machine works in concert with the upsBattery state machine. The functionality of the upsOnline state machine is described in pseudo code forth below: Accept critical "status events" from the dependency module. Wait for up to 5 minutes to see if power will return or update case. When power returns wait 10 minutes to make sure it is stable. If the "status" remains critical for 10 minutes, update a case with "critical" If the "status" remains critical for 1 hour, update case.
upsBattery State Machine
FIG. 20 illustrates the upsBattery finite state machine model 2000 supported by the illustrative embodiment of the apparatus 300. The purpose of the upsBattery state machine is to monitor the battery charge level of a UPS. The upsBattery state machine works in concert with the upsOnline state machine. The functionality of the upsBattery state machine is described in pseudo code forth below: Uses object: "name:PLGN:upsBattery" Same as no WaitVerifyStateMachine, accepts, when OnBattery (from UPS OnLine State Machine), ignore any problems with the battery. However, when the power is restored, let the UPS OnLine State Machine know when the battery is OK (charged). Note: Destatus(n) represents 'comand (updateDEstatus.pl n), "," where (n) is the status index.
In addition to the upsBattery and upsOnline state machines, the remaining state machines aren't device specific. Accordingly, regardless if the device is a router, a switch, a personal computer, etc., the icmpVerify, icmpVerify, and slidingWindow state machines can be used. The inventive network appliance 300 reduces false positives through use of the state machines. When a device is first reported down, appliance 300 doesn't alert the end user that the device is down without confirmed verification. This process is done by waiting a certain amount of time and repolling the device. If the second poll shows that the device is still down, appliance 300 sends out an alert. This process of verifying statuses before reporting alarms is facilitated by the Decision Engine 334 and the state machines associated with the monitored device.
Decision Engine 334 uses the specially designed finite state machines to verify that monitored objects identified as critical by the Status Poller Module and Dependency Checker are in fact down. Decision Engine 334 then performs such functions as: Initiating detailed information in support of new case generation for the down object, or status updates to existing cases at specific time intervals for impacted objects, including device- or condition-specific messages that are provided by the state machine; updating existing cases when objects become available; and suppressing case updates for monitored objects that have exceeded a defined number of updates within a prescribed period of time.
As will be obvious to those reasonably skilled in the arts. Other state machine models may be accommodated by appliance 300 and used similarly without significant reconfiguring of the device beyond recompiling of the appropriate code segments. Extensibility is accomplished by allowing new and enhanced finite state machine models to be quickly developed and introduced without the need to change system code. For example, if a new Finite State Machine is needed because a new type of status poll has been created to better monitor or manage a specific object, the definition of this new State Machine does not require a change to the appliance 300 application software. Once the new State Machine is added to the system, any managed object that is of the new status poll type will be handled by the Decision Engine without requiring recompilation of any part of the underlying Decision Engine code. In addition, the functionality of the Decision Engine can be extended by its ability to run any program, script or utility that exists on the appliance 300 application. This function can be applied to instances such as when a process managed by appliance 300 is identified as "down", the Finite State Machine for that object can be designed to run a command that will attempt to restart the process without human intervention.
The virtual state machines provide a significant scaling advantage as compared to traditional state machines. Implementation of virtual state machines within a database solves several constraints including constraints associated with memory resident state machines implemented in RAM. With the memory constraint removed, the number of virtual state machines maintained concurrently may be increased by orders of magnitude. In addition, implementation of virtual machines in memory rather that as executing processes, allows the state data of monitored objects to be retained through a loss of power by the network appliance.
Decision Process
In terms of decision process, the Decision Engine 334 receives potential issues and supporting details following Root Cause Analysis. The defined Finite State Machine(s) for the identified objects are invoked to supplement the discovery and validation process. Based on its instructions, the Decision Engine 334 then seeks to validate the status of the device as well as other surrounding devices through the On-Demand Status Poller Module 335. The On-Demand Status Poller 335 returns status details to the Decision Engine 334 where the results are evaluated further. Once a network issue has been isolated and validated, the source of the problem and other supporting detail is passed to the Case Management system 336, which is the primary component of appliance 300's Service Management capability. Additionally, the status details relating to the root cause and devices affected through dependency are provided to the Status View Maintenance Module 385, which depicts the status in the Network Status Table and Status Maps 387. The various appliance 300 modules continue this course of action and provide updates to both cases and status indications as status conditions change.
The Status Poller polls managed objects and awaits a response within system defined parameters. Should a response not be received, the event is forwarded to the decision engine for further analysis. Concurrently, the Trap Receiver system fault trapper will collect and forward trap information to the decision engine for further analysis. The output of the decision engine is a validated problem requiring action or acknowledgement by a human operator. The decision engine uniquely identifies the problem for documentation. At a minimum the uniqueness of the problem is established by identifying the managed object effected and providing a date and time stamped description of the validated problem. The validated problem may be enhanced by further identifying the decision engine as the initiator of the problem, identifying the status of the problem, and assigning a priority to the problem. Any combination of fields within the database may be used to develop a list of problems and the order in which the problems should be addressed. For example, the database may be configured to sort and list problems by priority and date/time stamp. Thus the human technician may view a list of problems with priority one problems, sorted by age, at the top of the list. The human operator typically will document all actions taken. Actions taken will be date/time stamp and chronologically listed within the problem description along with all machine-generated information. Thus the documentation/notification engine will have recorded machine generated validated problems along with human actions within a self contained, chronological description of the problem and all actions through resolution.
The inventive appliance suppresses the generation of additional problems or cases by appending to existing problems previously identified. For example, the inventive decision engine can be configured to search for an unresolved problem previously opened by the decision engine for a specific managed object. By appending information to the existing problem the intended viewer of the problem text, i.e. the human technician, can view all machine and human generated information within its chronological context. This method significantly reduces event storms that typically inundate network management systems. Specifically, objects that continuously flap from a "known good state" to a "fault" state typically generate events associated with the transition from "known good state" to "fault" state. The inventive appliance will suppress such event storms by logically grouping all such events within one unresolved problem associated with the root cause object.
Database Tables and Field Definitions
A central relational database 352 is employed to facilitate data persistence and interprocess communication. Several processes or modules may access the same tables in the database, so the database provides a mechanism for interprocess communication. Database 352 may be implemented with any number of commercial SQL database server products, including mySQL commercially available from mySQL AB. The database server can handle a large number, e.g. 50 million records, in a single database table. In the illustrative embodiment, database 352 may include the following tables: poll, messages, current_state, state_machine, active_timers, variable_queue, command_queue, variables, transition_functions, state_functions, status_request. These tables are defined in greater detail hereinafter:
Messages Table
The message table serves as the queue for all messages used by the decision engine. All modules can place a message in the queue, but only the decision module reads messages from the queue. A message can refer to a specific object and the state machine for that object or, through the use of wildcards, multiple objects and state machines. The fields within the message table, the data type of the field and default value thereof are listed below: msg_id bigint(20) unsigned DEFAULT '0' NOT NULL, message char(255) DEFAULT ' ' NOT NULL, name char(50) DEFAULT ' ' NOT NULL, method char(20) DEFAULT ' ' NOT NULL, instance char(20) DEFAULT ' ' NOT NULL, extra_info char(255) DEFAULT ' ' NOT NULL, PRIMARY KEY (msg_id) current_state Table
The current_state table maintains the current state of each active state machine within the database. The fields within the current_state table, the data type of the field and default value thereof are listed below: machine char(20) DEFAULT ' ' NOT NULL, state_name char(20) DEFAULT ' ' NOT NULL, name char(30) DEFAULT ' ' NOT NULL, method char(20) DEFAULT ' ' NOT NULL, instance char(20) DEFAULT ' ' NOT NULL, KEY state_name state_machine Table
The state_machine table contains state transition information for every type machine in the system. There is one record for each possible state transition for each machine type. The fields within the current_state table, the data type of the field and default value thereof are listed below: machine char(20) DEFAULT ' ' NOT NULL, state_name char(20) DEFAULT ' ' NOT NULL, message char(255) DEFAULT ' ' NOT NULL, target char(20) DEFAULT ' ' NOT NULL, PRIMARY KEY (machine, state_name, message)
machine_definition Table
The machine_definition table defines the type of machine that is to be created for a managed object based on the "method" and "instance" of the object. The fields within the machine_definition table, the data type of the field and default value thereof are listed below: machine char(20) DEFAULT ' ' NOT NULL, method char(20) DEFAULT ' ' NOT NULL, instance char(20) DEFAULT ' ' NOT NULL, KEY (method) active_timers Table
The active_timers table serves as a queue for all requests for some kind of action on the part of the timer module. A request can refer to a specific object or, through the use of wildcards, multiple objects. Upon completion of the action and the meeting of an optional condition, a message will be placed into the message queue. The fields within the active_timers table, the data type of the field and default value thereof are listed below: timer_id bigint(20) unsigned DEFAULT '0' NOT NULL, name char(30) DEFAULT ' ' NOT NULL, method char(10) DEFAULT ' ' NOT NULL, instance char(20) DEFAULT ' ' NOT NULL, machine char(20) DEFAULT ' ' NOT NULL, arguments char(50) variable_queue Table
The variable_queue table serves as the queue for all requests for some kind of action on the part of the variable module. A request can refer to a specific object or, through the use of wildcards, multiple objects. Upon completion of the action and the meeting of an optional condition, a message will be placed into the message queue. The fields within the variable_queue table, the data type of the field and default value thereof are listed below: variable_id bigint(20) unsigned DEFAULT '0' NOT NULL, name char(30) DEFAULT ' ' NOT NULL, method char(10) DEFAULT ' ' NOT NULL, instance char(20) DEFAULT ' ' NOT NULL, machine char(20) DEFAULT ' ' NOT NULL, message char(255) command_queue Table
The command_queue serves as the queue for all requests for some kind of action on the part of the command module. A request can refer to specific object. or, through the use of wildcards, multiple objects. Upon completion of the action and the meeting of an optional condition, a message will be placed in the message queue. The fields within the command_queue table, the data type of the field and default value thereof are listed below: command_id big int(20) unsigned DEFAULT '0' NOT NULL, name char(30) DEFAULT ' ' NOT NULL, method char(10) DEFAULT ' ' NOT NULL, instance char(20) DEFAULT ' ' NOT NULL, machine char(20) DEFAULT ' ' NOT NULL, variables Table
The variables table contains the values of variables associated with a particular object that must be saved, modified, or retrieved in conjunction with a task. Examples of variables to be saved include 1) a count of the number of case updates for each managed object. It is the job of the variables module to increment, decrement or reset counters as it works off counter requests in the variable_queue. 2) the text of the last suppressed auto_open request. The fields within the variables table, the data type of the field and default value thereof are listed below: transition_functions Table name char(30) DEFAULT " NOT NULL, method char(10) DEFAULT " NOT NULL, instance char(20) DEFAULT " NOT NULL, machine char(20) DEFAULT " NOT NULL, varName char(10) DEFAULT " NOT NULL,
The transition_functions table contains the list of actions that are to be performed as the result of a particular machine receiving input I (a message) while in state S. For every machine type there is a record for every possible machine state/input combination. The fields within the transition_functions table, the data type of the field and default value thereof are listed below: state_functions Table machine char(20) DEFAULTs " NOT NULL, state_name char(20) DEFAULT " NOT NULL, input_message char(255) DEFAULT " NOT NULL, type char(20) DEFAULT " NOT NULL, action char(20) DEFAULT " NOT NULL, condition char(20) DEFAULT " NOT NULL, arguments char(50) DEFAULT " NOT NULL, output_message char(255) DEFAULT " NOT NULL, PRIMARY KEY (machine,state_name,input_message,type,action)
The state_functions table contains the list of actions that are to be performed as the result of a particular machine "arriving" at state regardless of the input. For every machine type there will be zero or more records for each state. The fields within the state_functions table, the data type of the field and default value thereof are listed below: status_request Table machine char(20) DEFAULT " NOT NULL, state_name char(20) DEFAULT " NOT NULL, type char(20) DEFAULT " NOT NULL, action char(20) DEFAULT " NOT NULL, condition char(20) DEFAULT " NOT NULL, arguments char(50) DEFAULT " NOT NULL, output_message char(50) DEFAULT " NOT NULL, PRIMARY KEY (machine,state_name,input_message,type,action)
The status_request table serves as the queue for all requests for status polls to be performed by the on demand status poller module. The fields within the status_request function table, the data type of the field and default value thereof are listed below: request_id bigint(20) unsigned DEFAULT '0' NOT NULL, name char(30) DEFAULT " NOT NULL, method char(10) DEFAULT " NOT NULL, instance char(20) DEFAULT " NOT NULL, message char(255) DEFAULT " NOT NULL, PRIMARY KEY (request id).
The illustrative embodiment of the invention has been described with an implementation using a database 352. It will be obvious to those skilled in the art the that the actual configuration of data storage components may be left to the system designer. For example, although a single database is shown, more than one database may be used, or data may be stored among a plurality of databases in distributed manner. In addition, the data described herein may be stored in traditional memory using look-up tables which contain data similar to that disclosed herein while still achieving the same results.
Wildcards in Messages
Wildcard usage is limited to the name, method and instance fields of the messages, active_timers, counter queu, and command_queue tables. In the illustrative embodiment an asterisk (*) is used as the wildcard character, however, it will be obvisious to those skilled in the arts that any number of characters may be used as acceptable wildcard characters. The use of an asterisk in place of a specific value in a name, method, or instance field means that this message refers to all objects that match the values in the non-wildcarded fields. For example, a message with the following values: 714536493, 'moveToState(Ground)', '*', 'TCP', '*'
means that the message is intended for all currently active state machines that exist for objects with the poll type of "TCP". The use of an asterisk in each of the name, method, and instance fields of a message means that the message is intended for all active machines.
User Interface
The appliance 300 includes a web server process 381 which generates a user interface which includes a number of menu selectable options and can dynamically generate a visual representation of the current state of managed objects and the Boolean relationships between objects at different layers of the Open Systems Interconnect network protocol model. In the illustrative embodiment, web server process 381 may be implemented a commercially available products such as the Apache Web server product. The dynamically generated visual representation of a managed object can scaled down to display the desired number of upstream and down stream objects from the target object, as illustrated in FIGS. 13-15 and 22. Data regarding a monitored object(s) can be viewed in the format of a Status Map or a Status View, as described hereafter.
The diagrams illustrated in FIGS. 13-15 are generated dynamically upon request from the user. Status Table and Status Map Module 387 within appliance 300 accesses the records within database 352 to determine the upstream and downstream devices for a selected node and their relationships thereto. The Module 387 queries the portion of database 352 which maintains the virtual state machines for the selected node and its respective parent and child nodes. The diagram is then generated from this information to accurately reflect the current configuration and status of all managed objects in the conceptual diagram.
Alternatively, a map of the entire network may be generated and stored statically in database 352 or other memory and updated periodically. In this embodiment, only the selected node and its data string of managed objects (i.e., devices on which it is dependent) will be cross referenced with the virtual state machines prior to display.
Status Map
As shown in FIG. 15, a web-based user interface is presented including navigation bar 1510, Status Map 1505 and a macroview graphic 1500 of the computer network being monitored. FIG. 22 illustrates a Status Map 2205 and a macroview graphic 2200, having substantially similar format to those shown in FIG. 15. A Selecting on the Map link under the Status menu on the navigation bar 1510 opens the Status Map 1505. Status Map 1505 provides a zoomed or microview physical map of the selected section of graphic 1500, designated with a box in graphic 1500. Status map 1505 shown managed objects shown in a navigable map format. Map 1505 provides a quick and easy visual guide to ascertain the network's health. A Dependency Summary, show in text form, may be provided near the top of the map indicating the number of objects in each possible status. The map view may be customized by selecting one or any combination of three options, including Pan/Full, Group/Dependency, and Single Status/All Status.
When the Status Map is opened, the top and left most section of the map is shown. This map view is referred to as the Pan mode. Navigation to other sections of the map may be performed using the single and double navigation arrows icons shown on the map. The single arrow will move the map one object to the left or right, or up and down. The double arrows will move the map one full screen either to the left or right, or up and down.
The entire Status Map 1505 may be displayed in the browser window, by selecting the View and Re-draw option commands causing the re-draw the status map to show the entire network. The horizontal and vertical scroll bars can be used to navigate to other parts of the map. To return to the Pan mode, selecting the View and Re-draw commands will cause the map to return to its default status.
By default, the Status Map opens in Dependency view, similar to Status Map 2205 shown in FIG. 22, showing physical connections between objects based on parent child relationships. When viewing the parent child dependency relationships between managed objects, the parent objects are situated to the left of child objects.
The Status Map for Groups can be viewed by checking the View check box and selecting the Re-draw button to re-draw the Status Map showing objects according to their Group affiliation. In Group mode, the context of parent-child is reversed. Since a Group cannot in itself be tested, the status of the Group (parent) is derived from its members (children). Parent Groups are to the left, and child members are to the right. The Group map depicts the relationship of various network objects in relation to how they are associated and configured in correlation to the Group. This permits monitoring by groups of like devices, location or site, or specific end-to-end processes. To return to the Dependency mode, selecting the View and Re-draw commands will cause the map to return to its default status.
Single Status/All Status
The Status Map (by default) shows you the Single Status view for all objects shown. Selecting the View and Re-draw commands will display a full complement of All Status icons (raw, dependency, decision engine and case), as shown in Status Map 2205 shown in FIG. 22. To show only the single dependency status, selecting the View and Re-draw commands again will display dependency status.
Each object in the status map may be visually depicted using icons specifically designed to provide easy recognition and visibility. Within the maps, the object's name may be listed directly underneath the icon. Next to the icon, the appropriate status may be listed in text or iconically (single status by default, all status when selected). Selecting on an object icon will return the Tools View for the respective item.
Relationship Indicators
The lines that connect one object to another indicate the relationship of an object to other objects in the network. In the illustrative embodiment, the parent objects are shown to the left and above; children objects are shown to the right and below. If groups are present in the map, appliance 300 provides information depicting the Boolean dependency expressions that have been formulated to determine what objects/nodes have an effect on determining the Group's operational status. Boolean dependency expression symbols, indicate that a Group has been created and this object is contributing to the overall determination of the Group's health and operational status. Appliance 300 allows the user to define during set-up the various individual conditions that constitute the status of a created Group.
A circle with an ampersand inside, similar to symbol 1512 of FIG. 15, indicates an 'AND' Boolean function test that is taking into consideration the operational status of individual nodes (i.e., Node A & Node B & Node C). If any of the nodes included in the expression is down, then the group status will show "down." A circle with a line through, similar to symbol 1514 of FIG. 15, means there is an 'OR' Boolean function test or expression. In such case, with multiple nodes being included in the expression (i.e., Node A or Node B or Node C), if all of the items are down, then the status for the group will show "down." An "f" in a circle symbol is used to indicate complex expressions involving a combination of 'AND' and 'OR' Functions between the members (i.e., [(NodeA|NodeB) & (NodeC|Node D)]' means the Group is normal if one of Node A 'OR' Node B 'AND' one of Node C 'OR' Node D is normal). No symbol bubble indicates that the Group contains only one member. There is no need to interpret these details as Appliance 300 automatically takes this logic into account when establishing a Group's status. Placing a pointing device such as a mouse pointer over any of these symbols on the network Status Maps will show you the specific details of the Boolean expression.
Network Health and Navigation Graphic
As shown in FIG. 15, in the upper-right portion of the Pan Map screen, Appliance 300 provides a small-scale version of the Status Map reflecting the entire network, referred to as a macroview or "whole" view of the network and labeled as graphic 1500. The square indicates the current location of the detail that is being shown in the main or "microview" Status Map. Selecting an area of the graphic map 1500 causes the Status Map 1505 to navigate to that portion of the network re-draw the main map at the location selected. In the contemplated embodiment, the map may be color coded to indicate which nodes or portions of the map have status other than normal, to facilitate selection thereof. Upon selecting a portion of the full network map, the user is presented with a node level diagram 1505, as illustrated in the remaining portion of FIG. 15. As shown, a selected node, as well as all other managed objects in its operational chain are illustrated conceptually, along with their status. As shown, the status of each managed object is indicated with a sphere, the color of which may indicate the status of the managed device.
Tools View
By selecting on the Tool icon or the node icons in the Status Map, the Tools View screen opens, revealing a 3-Gen map. FIGS. 13 and 14 illustrate "3-Gen" or three generation maps which display the parent and child devices to a selected object are presented and labeled accordingly. In addition, the status of the state machine for the selected node is illustrated. As with the presentation of FIG. 15, the status of each device presented in FIGS. 13 and 14 is illustrated with a sphere of changeable color. In the illustrative embodiment, green may be used to indicate a node object which is functioning properly, red may be used to indicate a node object which is non responsive or failing, other colors may be used to indicate node objects which are only partially functioning or offline, etc. It will be obvious to those skilled in the arts that other techniques may be used to represent the status of a managed object.
FIGS. 13 and 14 illustrate a Tools view of a map 1300 and 1400, respectively, that can navigated through by selecting the arrows next to the objects that are related to the object in question. The options above the map allow access to additional information about the object including case information, status information, performance information, and the ability to review any associated logs for the object. Under the Cases section, selecting the Active link will open the Case Browse screen showing all of the active cases for that object. A complete history of cases for the object, can be obtained by selecting the All link, which will open the Case Browse screen and show every case (both active and closed) for the object in question. Selecting the Table link or the Map link under the Status section opens the respective status screen, revealing the position of the object in the network. If Table is selected, the Group heading that includes the object in question opens at the top of the screen. If Map is selected, a section of the network Status Map is opened with the object in question approximately centered on the screen.
If performance graphing is provided for the object, it is directly accessible from the Tools View by selecting the Statistics link under the Performance section (only displayed if applicable) to open the MRTG graphs applicable to the object. If performance graphing is not applicable, 'n/a' (not available) will be listed under the Performance heading. Selecting the View Log link (under the Log section) will open the View Log screen. If the object open in the Tools View has associated log entries (typically process availability) for the current day, they are displayed here.
Performance polling data may be graphically depicted in various views representing each monitored performance element over different durations of time. Graphical displays are based on the ubiquitous Multi-Router Traffic Grapher (MRTG). Long duration views such as one (1) year are ideal tools for presentation of long term trending. Smaller duration views (in months, days, or hours) are useful to more precisely detect or evaluate specific anomalies or performance events that have occurred.
Performance thresholds can also be established for each performance element being monitored. Should performance levels surpass the pre-established performance baseline, appliance 300 can systematically identify and log this condition, and proceed to alert network management personnel through the integrated Case Management engine 336 and Notification engine 356.
Selecting the Table link under the Status menu on the navigation bar 2110 opens the Status Table 2100, as illustrated in FIG. 21. The Status Table lists managed objects in tabular format. A Dependency Summary may be provided above the table, indicating the number of objects in each possible status. Below that, each object is listed with its current status indicated next to it. Data presented includes: Available Tools, Object Name, Status Indicator Symbols and Description.
Appliance 300 provides the option of viewing performance in either a Single Status mode that reflects object operational status, or an All Status mode that shows a more detailed view of status and processes. When this mode is selected, there are four single status indicators used within the a Status Table and Status Maps. The status icons visually depict the operational status or severity of a network problem as shown in Table 6 below:
A dependency failure indicates that an object between the target object and Appliance 300 is not operating normally, and the status of the object in question is unknown due to its inaccessibility. By selecting the status icon for a non-dependency down object that responds to ICMP, a trace route is run between Appliance 300 and the respective object.
The architectural components of appliance 300 application detect a network's status, determine the root cause of a problem, verify operational status, and track cases pertaining to the devices, systems, services and applications. These integrated components work together to assist network management personnel identify real problems and focus their energy on efforts to manage the network.
The All Status mode provides a user with a more comprehensive view of network performance. A unique icon reflects specific information about an aspect of the appliance 300 with the color presented, thereby allowing the user to view object status as a complete process should they need additional background on the events leading to the status shown or case generation.
Table 7 below is a description of the status indicators used when All Status is reflected in the Status Map or Status Table. This information can assist in the troubleshooting and diagnostics process.
Raw Status
Icon Status pertains to the operation of the respective object as viewed on the Status Map or Status Table.
Decision Engine Status
Status of current operation of the Decision Module as it relates to analyzing the specific object.
Case Priority
Status indicates the presence of active cases for the object, including the priority as currently assigned to the case. If active cases are present, the user can click on the case icon and they will be routed to the Search Results screen where the case can be accessed.
Referring again to FIG. 22, an All Status view 2200 of a monitored object 2210 includes multiple status icons 2202, 2204, 2206, and 2208, in accordance with the description herein. The other managed objects within the view 2200 have similar status icons.
Groups
Appliance 300 allows a collection of monitored objects to be depicted as a Group. The Group is represented as an object, and it is dependent upon its member objects to determine the Group's status. The Group is then displayed as a standard object icon on all relevant maps. Additionally, Group objects are represented on group status maps and tables that depict the relationship of member objects to the Group.
Selecting a Group object from the Group Status Maps or Status Table will cause the display of an abbreviated map, which contains the Tools View for the Group object. Group members may be defined in the same manner as other object dependency strings. However, when a Group's status becomes dependency failure, an inference can be made as to the source of the problem.
Consider the example in which a site has three Uninterrupted Power Sources (UPSs) being monitored. The power supply may be modeled as a Group by creating a Group object, and adding 'OR' dependencies to all three of the UPSs. In this way, when all three UPSs fail at the same time, the status of the Group object will go show dependency failure, signifying a strong possibility that the entire site has lost power.
The All Status states of a Group object are:
Raw Status (Diamond Icon) Bad/Red-Member object's raw status caused Group's dependency expression to show "Failed" (depend down). Good/Green-Member object's raw status translates to good based on expressions established (Group's dependency expression shows "Up"). Dependency Status (Circle Icon) Bad/Red-This Group's member objects are considered the "root cause" of the failure(s) occurring. Bad/Blue-This Group is dependency down, and the root cause for failure(s) is not among the Group's members. Good/Green-Member object's status is good. Decision Engine Status (Triangle Icon) Red-This Group is being processed by the Decision Engine (is not in "Ground State"). Green-This Group is in "Ground State" in the Decision Engine. Case Status (Square Icon) Red-High priority AutoCase exists for this Group. Orange-Medium priority AutoCase exists for this Group. Yellow-Low priority AutoCase exists for this Group. Blue-Information Case exists for this Group.
The user interface described above is a web based user interface. It will be obvious to those skilled in the arts that other user interface formats, such as one compatible with the many version of the Windows operating system may be equivalently used with the present invention with the same results.
From the foregoing description and attached figures, the reader will appreciate that the present invention provides a device which is capable of monitoring the status of complex networks of devices or processes, providing information regarding the status of the network or a specific device through a plurality of different communication channels and displaying accurate visual representations of a node and its immediate relationships in the network, in a manner which is both intuitive and efficient.
Although various exemplary embodiments of the invention have been disclosed, it will be apparent to those skilled in the art that various changes and modifications can be made which will achieve some of the advantages of the invention without departing from the spirit and scope of the invention. It will be obvious to those reasonably skilled in the art that other components performing the same functions may be suitably substituted. Further, the methods of the invention may be achieved in either all software implementations, using the appropriate processor instructions, or in hybrid implementations which utilize a combination of hardware logic and software logic to achieve the same results. Such modifications to the inventive concept are intended to be covered by the disclosure herein and any claims deriving priority from the same.
Other References
- �??Flowcharting�?�, http://www.hci.com.au/hcisite2/toolkit/flowchar.htm, pp. 1-6.
01/17/2007 | ONJava.comUsing a rule engine provides a framework that allows a way to externalize business logic in a common place. This will in turn empower business users and subject matter experts of the business to easily change and manage the rules. Coding such rules directly into the application makes application maintenance difficult and expensive because the rules change so often. This article goes into detail on how to architect and build a service that uses Drools to provide business decisions. This service can be part of the overall enterprise SOA infrastructure. As such, it can either be a standalone service that is consumed in a one-to-many model by all contracted consumers, or part of a composite service that provides a complex business functionality. To illustrate this point, the article shows how a service using the Drools rule engine can hide the complexity of automating mortgage underwriting decisions that a mortgage company needs to make on a daily basis.
A rule engine such as Drools offers matching algorithms that can determine which rules need to be run and in which order, and provide a means of addressing conflict resolution. It allows facts to be reassessed by rules as they are being evaluated, causing the consequence of one rule to affect the fact base, or causing other rules to fire or retract as needed. By using a rule engine, rapidly changing business policies/rules can be externalized so that they can be maintained separately in one place. The rest of the enterprise applications can access the functionality through a service layer with well-defined contracts. The behavior of the service can then be modified without changing the interface contract or needing to recompile/redeploy. Rules are stored in human-readable form in a file so they can be changed with a text editor or rule editor. Many leading industry analysts have concluded that it is significantly more productive to build and change complex, decision-intensive applications with rules-based systems than with custom code.
Drools Rule Engine
Drools is a JSR-94-compliant rule engine that uses Rete, a matching algorithm developed by Charles Forgy. In the simplest terms, Rete builds a tree from all the rules to form a state machine. It begins with facts entering the tree at the top-level nodes as parameters to the rules, and working their way down the tree--if they match the conditions--until they reach the leaf nodes (rule consequences).
For this article, we use the JBoss Rules Workbench IDE as a tool to write and test the rules. The JBoss Rules workbench is delivered as an Eclipse plugin, which allows you to author and manage rules from within Eclipse. This is an optional tool; any other tool can be used to author and deploy the rules, provided the appropriate Drools libraries are included. Detailed instructions on how to obtain and install this plugin can be found at the Drools documentation site.
The following is a short description of the main libraries that constitute the Drools rule engine:
- drools-core.jar: Contains the core engine, the runtime component that implements both RETE and LEAPS algorithms. This is the only runtime dependency that's needed if you are precompiling rules and deploying them via
PackageorRuleBaseobjects.- drools-compiler.jar: Contains the compiler/builder components that take a rule source file and build executable rule bases. Like we mentioned previously, this .jar file is not needed if rules are precompiled. This .jar has a dependency on drools-core.
- drools-jsr94.jar: Contains a JSR-94-compliant implementation.
- drools-decisiontables.jar: Contains the decision tables compiler component. It has a dependency on the drools-compiler component. This supports both Excel and CSV input formats.
There are other dependencies that the above components require; for an exhaustive list please refer to the Drools documentation.
Drools is friendly to both developers and business users. DSLs allow developers to write almost natural language semantics for rule authors. GUIs and visual metaphors (RuleFlow, Decision tables in Spreadsheets) also reduce the gap between business and IT. A web based BRMS (Business Rule Management System) provides GUIs for managing rule assets.
Books
Jess in Action: Java Rule-based Systems
Ernest Friedman-Hill
ISBN: 1930110898Expert Systems: Principles and Programming
Joseph Giarratano, Gary D. Riley
ISBN: 0534384471Introduction to Expert Systems
Peter Jackson
ISBN: 0201876868Business Rules and Information Systems: Aligning IT with Business Goals
Tony Morgan
ISBN: 0201743914Principles of the Business Rule Approach
Ronald G. Ross
ISBN: 0201788934Business Rules Applied
Von Halle
ISBN: 0471412937
gNuImplicator.tar.gz (LSM entry) 2000-09-06implements about everything that has to do with PRODUCTION RULE EXPERT SYSTEM SHELLs. It also has all the functions necessary to define nets and parse grammers. (93034 bytes)
(LSM entry) 2000-09-06 implements about everything that has to do with PRODUCTION RULE EXPERT SYSTEM SHELLs. It also has all the functions necessary to define nets and parse grammers. (96071 bytes)
SEL, a new event pattern specification language for eventcorrelation
Dong Zhu; Sethi, A.S.Computer Communications and Networks, 2001. Proceedings. Tenth International Conference on
Volume , Issue , 2001 Page(s):586 - 589
Digital Object Identifier 10.1109/ICCCN.2001.956327Summary: Event pattern detection is the one of the major techniques used for event correlation in network and distributed systems management. This paper focuses on the design issues of event pattern specification languages. The discussion is organized around the event operators in existing event languages that we think are problematic and around the temporal specification aspect. Semantic issues are discussed and various languages are investigated. The study has revealed weaknesses of design in semantic appropriateness and completeness of certain event operators, in flexibility of operator usage and timing specification, in the effectiveness and efficiency of expressions, and in readability of the languages.
Based on the findings, we propose a new event language called SEL, which attempts to avoid some of these problems. SEL is novel in its negation operator usage, the way followed-by semantics is provided, and how composite event time is determined in the presence of the negation operator. It is comprehensive yet relatively simple and intuitive to use. Expressions written in SEL appear to be very readable and easy to maintain
CA Positioned in "Leaders" Quadrant in IT Event Correlation and Analysis
CA announced that its Service Availability solutions have been positioned in the "Leaders" quadrant in IT event correlation and analysis (ECA) according to a Gartner, Inc. report entitled "Magic Quadrant for IT Event Correlation and Analysis, 2006." CA's Service Availability Solutions help ensure reliable access to IT services by automating and optimizing the IT infrastructure to meet business demands.
CA Press Release: CA Positioned in "Leaders" Quadrant in IT Event Correlation and Analysis
Gartner Research Report: Magic Quadrant for IT Event Correlation and Analysis, 2006
CEP is a lightweight and agile complex event processing (CEP) engine. It aims to ease the cost of changing business logic, automating and monitoring business processes, and enabling an on demand business environment. Our unique CEP capabilities were recognized by Gartner as an emerging market in which "enterprises will achieve new levels of flexibility and a deeper understanding of their business processes by applying the techniques of complex event processing to their daily work".
CEP extends the message at a time paradigm, by detecting complex situations that involve a context-sensitive (semantic context, temporal context, spacious-temporal context) composition of messages and events. This functionality is extremely practical when applied to the processing of input from multiple event sources -- from the perspective of a business, application or infrastructure within different contexts. For example, such scenarios may involve SLA (Service Level Agreement) alerts and compliance checking, applicable to the financial markets, banking, and insurance industries.The following are some sample rules or events that can be monitored and detected using CEP:
- Suspicious money transfers - send notification if the total value of all withdrawals (ATM, check, etc.) in the last X days exceeds $Y (where X and Y are parameters that each customer can specify)
- Fraud detection - send an alert notification if two credit card purchases were made within one hour at a distance greater than 200 Km.
- Market trends - check for situations where the foreign exchange rate is up by more than X percent and Dow Jones is up by less than Y percent as compared to yesterday's closing rate.
- Customer care - send an alert if the same request was reassigned to three agents and no answer was given to the requester.
CEP lets business users and application developers configure the middleware in terms of business needs, thus triggering more sophisticated conclusions and enhancing automation and efficiency. CEP can be configured to monitor situations relating to specific rules/events. For example, you can pre-set and automatically correct parameters for breaches of Service Level Agreements.
CEP technology includes an Eclipse based authoring tool for the business user, and a Java-based execution engine for complex event processing.
The following diagram presents the concept of the CEP runtime architecture. All inputs to the system, including both the rule definitions and the events, enter the system through the Input Adapters. All the outputs of the system, including situation alerts, definition messages and system messages, go to the Output Adapters, and optionally to the Action Managers, if an action is required, for example, sending an email or updating a database. This flexible architecture allows the CEP engine to be integrated into any system, to receive inputs and then send alerts to continue the natural flow of information in the system.
- At build time, rules and conditions (called patterns) are composed using a wizard based authoring tool. The user can also use simulation to test these definitions and then export them to the runtime engine.
- During runtime, events of different format and from multiple sources are fed in. The CEP engine analyzes them based on current rules and conditions. Upon detection of the predefined patterns, alerts are sent out as messages and actions are triggered. These messages are also fed back into the engine and treated as incoming events, enabling nested patterns.
First, definitions are loaded through the Input Adapters to the Definition Manager. Definitions are parsed, and if they are consistent and complete, they are loaded into the Rule Engine through the Routing Manager. Success / Fail messages are sent to the Output listeners. At this point events can begin to flow into the system, upon their occurrence. Events enter from multiple sources through multiple Input Adapters. The events are routed to the Rule Engine, in order to participate in evaluation of a rule. When a rule is satisfied, a situation is detected.
A detection of a situation may result in three outcomes: Detected situations are sent to the Output Listeners, for further processing of the information; Situations may trigger stand-alone actions, such as sending email, storing information in a DB, etc.; Situations return to the system as incoming events, thus allowing nested rules to be executed.
Haifa's CEP rule engine is a unique attempt to build general purpose event processing engine. CEP is based on previous research focused on specific fields such as active database and network management. We extended pervious concepts and developed a flexible event processing rule engine while resolving several research challenges such as:
- How to support different kind of events and messages
- How to synchronize events that arrive from different source in different time due to network delays.
- How to identify the context (temporal, spatial, semantic) in which a situation detection is relevant
- How to change event processing rules without stopping the system (hot updates)
- How to support vast numbers of events and conditions in an optimal way
- How to detect cycles in rule firing sequence.
For the past seven years, the CEP team in the Haifa Research Lab has been working on complex event processing technology and event driven solutions, from defining and refining the CEP definition language and implementing and optimizating the run-time execution engine for high volume even processing in distributed environments, to building business level CEP tools and integrating them into IBM products, solutions and customer projects. This work on event processing was published in dozens of papers and patents and is helping to form an event processing community.
March 2004 (CA) Action is the enemy of fault. The following paper is designed to explain how CA's Network Fault Management solution (SPECTRUM) performs event correlation, impact analysis and root cause analysis for multiple vendors and technologies across network, system and application infrastructures. The Network Fault
Management solution uniquely offers three intelligent, automated and integrated approaches to problem solving - while also proactively communicating bi-directionally with infrastructure elements in a "trust but verify"
methodology. CA's software doesn't just listen for problems - it proactively talks with the infrastructure for health status and detailed diagnostic information. The end result is a cost-effective way to drive reliability, efficiency
and effectiveness in managing IT infrastructure as a business service.CA's three approaches to problem solving discussed in this paper are:
- Model-based Inductive Modeling Technology (IMT)
- Rules-based Event Management System (EMS)
- Policy-based Condition Correlation Technology (CCT)Our approach avoids the often technically religious arguments whether a model-based, rules-based or policy-based system is the best solution by leveraging all three. The Network Fault Management solution is fundamentally
a model-based system. Model-based systems are
adaptable to changes that regularly happen in a real-time, on-demand IT infrastructure - however, these systems are criticized because development of new models and relationships may require programming skills. Rules-based systems are flexible in allowing customers to add their own intelligence without requiring programming skills - however, these systems are criticized since rules must be constantly re-written every time there is a move/add/change. CA's software combines the best of both approaches, using models to keep up with changes
while leveraging easy-to-create rules running against the models to avoid the need for constant rule editing. Policy-based systems are automated means of stitching together seemingly unrelated pieces of information to determine
condition and state of physical devices and logical services. This condition correlation engine combines with the modeling engine and rules engine to deliver a higher level of cross-silo service analysis.Almost every service delivery infrastructure problem can be placed into one of three categories: availability, performance or threshold exceeded. Infrastructure faults occur when things break, whether they are related to
LAN/WAN, server, storage, database, application or security. Infrastructure performance problems often result in brown-out conditions where services are available but are performing poorly. A slow infrastructure is a broken infrastructure from the user's perspective. The final category is abnormal behavior conditions where performance, utilization or capacity thresholds have been exceeded as demand/load factors fall significantly above or below observed baselines. The Network Fault Management solution can pinpoint the cause of availability problems and proactively monitor response time to ensure performance, while also delivering
thousands of out-of-the-box thresholds to predict and/or prevent problems.
Today's diverse interconnected e-business components typically come with a lot of event information generated by touchpoints through log files or event emitters. Correlating event information to derive symptoms, or higher level business conclusions, is fundamental to identifying critical situations that need to be corrected. This article describes the IBM Active Correlation Technology (ACT), which provides built-in patterns that support event correlation and complex event processing.
ACT is a technology that is in the works at IBM. You will see it showing up in our products in the future. At this point, however, ACT is not available to be embedded into your own applications. However, if you understand the benefits that this new technology provides, you'll be better able to understand the direction in which autonomic computing technology is headed. Read this article for a sneak peek at what types of functions you'll be seeing in the future. As always, we like hearing what you think; chime in with your thoughts on the autonomic computing discussion forum in the Resources section of the article.
The article provides a brief overview of ACT, which is a set of modular event correlation components that deliver complex event processing functions, such as:
- Aggregating and filtering events
- Correlating and associating events for problem determination and detection of business situations
- Triggering automatic actions in response to events that cause situations
- Associating events with business information
ACT includes support for events that conform to the Common Base Event specification and other messaging formats. ACT is a technology that is being embedded in different IBM products and offerings.
This is a brief description of the use of a functional programming language in the real world product Hewlett-Packard Event Correlation Services (HP ECS) which has been recently announced. HP ECS is part of the HP Openview product.A telecommunication network sends event messages, such as failure alarms, to a network management station. These will be displayed for the operators. But some incidents in a telecommunication network may generate large numbers of events per incident, called an event storm. An example is when a trunk cable is cut. Typically each channel in the cable will generate an alarm message when it is cut and another notification when it is restored.
An event storm overloads the operators with information making it difficult to tell what kind of incident and where the incident occurred. To solve this problem an event correlation stage is inserted between the network and the management station. The correlator translates a groups of events into a single event that better describes the nature of the incident.
The correlator applies the expertise of the operator in judging the cause of the event storm. Some commercial products use an expert system to perform the correlation. These tend to be slow, too slow for event storms in large networks. The other extreme is to encode the expertise in the logic of a program in some conventional language such as C. This will give a fast correlator but one that is difficult to maintain.
The event correlation technology in HP ECS falls in between these extremes. The correlator algorithm is implemented as a network of processing nodes called the correlation circuit. Each node operates on one or more input streams of events to produce an output stream of events. The final output from the circuit is the correlated event stream.
An example of a node is the filter node. This splits a stream of events into two streams depending on a predicate applied to each event.
Netcool/NeuSecure is a security information management (SIM) platform designed to improve the effectiveness, efficiency and visibility of security operations and information risk management. The solution centralizes and stores security data from throughout the enterprise, automating incident recognition and response, streamlining incident handling, enabling policy monitoring enforcement and providing comprehensive reporting for regulatory compliance. The centralization and automation of these functions results in reduced costs of security and IT operations.
Aspects of information security are performed by various groups within an enterprise. Each group uses diverse technologies and distinct business processes, which results in miscommunications, duplication of efforts, and ultimately, a vulnerable enterprise infrastructure. Netcool/NeuSecure serves as the centralized, integrated software platform that unifies the people, processes, and technology required for successful security operations.
Why Netcool/NeuSecure?
- Superior Incident Recognition - Offers superior incident recognition capabilities, analyzing event data using four complementary correlation techniques: Rule-based Correlation, Vulnerability Correlation, Statistical Correlation and Susceptibility Correlation. The ability to weight the importance of assets during the correlation process enables Netcool/NeuSecure to prioritize security activities based on the organization's business priorities.
- Understanding the IT Operations Environment - Designed with an understanding of the operational challenges that security and IT teams face and has built-in features to address these challenges that will not be found in other products. Offers a distinct separation of data for environmental and organizational control with its security domains and the product can be administered using pervasive granular roles-based access.
- Integrated Incident Investigation & Response - Drastically reduces the time it takes to handle attacks, misconfigurations, and misuse by tightly integrating investigation and response tools, as well as by facilitating the escalation and tracking process. In one managed security service provider's security operations center, Netcool/NeuSecure reduced the average time spent investigating and responding to an attack from 1 hour to 6 minutes. This time to mitigation can mean the difference between stopping an attacker and suffering the consequences of a security breach.
- Download the brochure to read more about the Netcool/NeuSecure
Download the Supported Device List for Netcool/NeuSecure Download the Netcool/NeuSecure Aggregation Function Overview Download the Netcool/NeuSecure Correlation Function Overview 'All Together Now - Integrating Event Response' - Download this white paper to learn more about the importance of integrating security into your IT operations
The core of NerveCenter's ability to intelligently manage network behavior is its proven advanced correlation technology. NerveCenter is the first end-to-end event management solution that provides correlation across network and security devices, UNIX and Windows NT systems and applications. Events from multiple sources can be correlated to pinpoint problems that previously required operator analysis. Individual events may not be problematic, but when combined with other events, or when present at the same time as other events, helps correlate the root cause of network conditions and initiates the appropriate automated response
nervecenter-collateral dynamic root cause analysis and. intelligent event enrichment ... analyses and automatic downstream alarm suppression ...
SEC is an open source and platform independent event correlation tool that was designed to fill the gap between commercial event correlation systems and homegrown solutions that usually comprise a few simple shell scripts. SEC accepts input from regular files, named pipes, and standard input, and can thus be employed as an event correlator for any application that is able to write its output events to a file stream. The SEC configuration is stored in text files as rules, each rule specifying an event matching condition, an action list, and optionally a Boolean expression whose truth value decides whether the rule can be applied at a given moment. Regular expressions, Perl subroutines, etc. are used for defining event matching conditions. SEC can produce output events by executing user-specified shell scripts or programs (e.g., snmptrap or mail), by writing messages to pipes or files, and by various other means.
Working with SEC- the Simple Event Correlator [PDF] Real-time log file analysis using the Simple Event Correlator (SEC)
Westborough, MA - July 14, 2003 - Today, OpenService further establishes its position as a leader in the Network Security Information Management software market with the unveiling of the product roadmap for NerveCenter 4.0, OpenService's network fault management and real-time correlation technology. This release marks the next major milestone in the development of the company's core technology that enables organizations to identify and escalate potentially damaging network and security events as they are occurring.NerveCenter 4.0 will feature significant enhancements to its predecessor, NerveCenter 3.8, which was introduced in December 2002. Among the new capabilities are:
- Linux (Red Hat 8.0) support
- XML-based entity and model import/export
- Integration and management using the OpenService Management Console (OMC)
- Performance enhancements targeting multi-processor servers
- PERL extensions for richer correlation and root cause analysis models
- Usability enhancements to simplify common management tasks
"Improving network availability continues to be a primary area of concern for enterprise-scale organizations," said Dennis Drogseth, vice president, Enterprise Management Associates. "The capabilities coming in NerveCenter 4.0 shows that this proven technology will continue to meet the management challenges today's organizations face, as well as proving OpenService's commitment to making the product not only more powerful, but also simpler to use, manage and deploy."
NerveCenter 4.0, with its automated real-time event correlation, downstream alarm suppression, root cause analysis, and network polling functionality is one of the most robust network management and false positive reduction solutions on the market. With version 4.0, NerveCenter will allow organizations to leverage OpenService's Web-based management console to manage events, transfer models between third party applications, and construct complex and powerful network management environments with pre-defined models. Additionally, new support for Red Hat Linux 8.0 will enable Linux-based organizations to take advantage of NerveCenter for the first time.
"In order to combat the endless flood of false positives, organizations need solutions that not only sort through the data, but also elevate those events that require immediate action," said Phil Hollows, Vice President of Product Marketing, OpenService. "NerveCenter 4.0 is the next step for our more than 350 network management platforms. Its new capabilities will help organizations operate more efficiently, effectively and improve the overall performance, security and health of their networks. It will also power Security Threat Manager's leading real-time security event management correlation capabilities further, faster and better."
SAN FRANCISCO � Micromuse Inc. (Nasdaq: MUSE), one of the leading providers of service and business assurance software, today announced an offer to acquire all the shares of UK-based RiverSoft� (LSE: RSFT.L) for approximately �43 million (approximately $64 million) in cash. The foundation of RiverSoft's software portfolio is the NMOS� network intelligence engine, which enables flexible object modeling and root-cause analysis for new generation networks. Micromuse believes these capabilities will complement the advanced diagnosis and correlation solutions provided by its Netcool� suite of applications."Customers are increasingly demanding intelligent software that helps managers isolate and resolve the root causes underlying service-affecting problems," said Greg Brown, Micromuse's Chairman & CEO. "As networks are being optimized for today's business needs our enterprise and service provider customers, now more than ever, are looking to acquire these capabilities from one industry leading provider."
Micromuse is committed to delivering solutions to enhance its customers' service uptime, elevate their optimum performance, and help them further contain operational costs. Further, as Micromuse continually extends and freshens its product suite to drive rapid ROI for our service provider and enterprise customers, we believe the acquisition of this technology will be an evolutionary step toward realizing this overall vision. Micromuse expects that RiverSoft's technology will provide the following advancements to the Netcool suite:
- Comprehensive inventory management from a single pane of glass, enabled by end-to-end discovery across additional domains. The NMOS network intelligence engine expands Netcool's Layer 2 and Layer 3 IP network discovery technology into the domains of ATM/FR and MPLS, which are prevalent in today's enterprise and service provider environments.
- Visual relationships that associate the performance of network components to the uptime of business services. The NMOS object model technology maintains the interdependencies between the network, system, application and service layers. These are displayed in a dynamic topological view, allowing customers to quickly assess the status of business services or the physical infrastructure.
- Faster and more accurate identification and resolution of problems, enabled by an automated delivery of root-cause information. NMOS's downstream event and alarm suppression identifies the root cause, freeing operators to prioritize and resolve problems more effectively. This makes operators more productive and reduces the mean time to resolution of service-affecting issues.
Micromuse and RiverSoft have common customers, OEMs, reseller relationships and software alliance partners.
RiverSoft's NMOS� Technology
RiverSoft's Network Management Operating System (NMOS) has established itself as one of the leading technologies among the new breed of network and service management applications. NMOS encompasses:
- Network auto discovery;
- Advanced object modeling techniques for cataloging the network intelligence that is automatically captured from the network;
- Physical and logical topology mapping to abstract complex and massive networks into manageable and meaningful views for users and other applications;
- Network monitoring and root-cause analysis to maintain the accuracy of network intelligence and act intelligently upon notifications of network service degradation.
RiverSoft's NMOS is the foundation layer of the RiverSoft application suite and provides auto-discovered network intelligence on network inventory, topology, configuration, utilization and performance. RiverSoft Advanced Management Extensions for advanced network services are modules that plug into NMOS to provide advanced support for new-generation technologies such as MPLS not commonly supported by traditional management vendors.
Integration of NMOS and the Netcool� Suite
The Netcool solution for advanced diagnosis and correlation includes Micromuse's flagship Netcool/OMNIbus� application, which provides event deduplication and correlation; the Netcool/Impact� application, which provides business policy correlation; and the Netcool/Visionary� application, which provides device-level correlation. Micromuse anticipates that NMOS's downstream suppression, topology-based correlation and object modeling capabilities will be integrated with Micromuse's Netcool/Precision� application, which provides IP-layer discovery, polling, topology storage, and inventory management, resulting in a new Netcool product or enhanced application."We expect the RiverSoft technology to enhance our ability to discover and correlate inter-layer IP, ATM, Frame Relay and MPLS problems quickly, while also providing a platform to model and manage abstract services and applications," said Suhas Uliyar, Micromuse's Vice President, Product Management. "Like Netcool, NMOS is able to scale as network infrastructures grow � a key function for managing the complexities in today's service provider and large-scale enterprises."
Financial Terms
The Boards of Micromuse and RiverSoft have reached agreement on the terms of a recommended cash offer. Micromuse U.K. Ltd., a wholly owned subsidiary of Micromuse, will make the offer. The offer is for 17.75 pence per ordinary share for the entire issued and to be issued share capital of RiverSoft. The offer values the currently issued share capital of RiverSoft at approximately �43 million.To access the complete public information and timetable on the acquisition, go to the Micromuse Website at http://www.micromuse.com and click "Terms of the Offer."
Conference Call Information
Details of the transaction will be described in a simultaneous conference call and Webcast today at 2:00 PM Eastern Time. The call can be accessed by dialing (888) 428-4469 (U.S.) or (612) 288-0340 (international), please ask for "the Micromuse conference call." The Webcast can be accessed by clicking on:
http://www.corporate-ir.net/ireye/ir_site.zhtml?ticker=MUSE&script=2100Investors.A replay of the conference call will be available starting today after 2:30 PM Pacific Daylight Time (5:30 PM New York time, 10:30 PM London time) and continuing until midnight Pacific Daylight Time on June 26, 2002. The replay can be accessed by dialing (800) 475-6701 (U.S.) or(+1 320) 365-3844 (international) and entering access code 642631. A Webcast replay of the conference call will also be available on Micromuse's website at http://www.micromuse.com.
About the Netcool Suite
Micromuse's Netcool� software suite provides businesses with the assurance that their networks, services and applications are working. By allowing our customers to see what's happening throughout the infrastructure in realtime, Netcool applications enable them to respond to problems before they cause network-based business services to go down.Netcool suite applications install out-of-the-box, deploy rapidly and scale as networks grow. Micromuse's flagship, Netcool/OMNIbus� application, includes a library of off-the-shelf software modules that allow our customers to collect and consolidate fault information from more than 300 popular environments spanning voice and IP, cable/broadband, switches and routers, and enterprise management systems.
About Micromuse
Micromuse Inc. (Nasdaq: MUSE) is one of the leading providers of service and business assurance software. Micromuse's recent list of awards includes the Crossroads A-List Award for Best IP Network Diagnosis Product for the Netcool�/Visionary� application. In addition, Micromuse was recently recognized in the Forbes 500, Bloomberg's Tech 100, the Barron's 500, the Business Week Info Tech 100, Deloitte & Touche's Technology Fast 500, the San Francisco Chronicle 500 and Network World's NW200. Micromuse customers include AT&T, BT, Cable & Wireless, Charles Schwab, Deutsche Telekom, Digex, EarthLink, GE Appliances, ITC^DeltaCom, J.P. Morgan Chase, One 2 One and Verizon. Headquarters are located at 139 Townsend Street, San Francisco, Calif. 94107; (415) 538-9090. The Web site is at www.micromuse.com.About RiverSoft
RiverSoft develops, supports and markets advanced software products, used to simplify the monitoring and management of internet protocol, Ethernet, ATM, Frame Relay or MPLS networks. RiverSoft's NMOS (Network Management Operating System) products utilize a system that can automatically discover connectivity in such networks, thereby allowing RiverSoft to recognize and adapt to changes or problems on a network. The company's customer base covers diverse industries such as internet service providers, data service providers, enterprise organizations and telecommunications companies. Headquartered in Richmond, London, RiverSoft is listed on the London Stock Exchange under the symbol "RSFT.L". More information about RiverSoft is available at www.RiverSoft.com.###
Micromuse and Netcool are registered trademarks of Micromuse Ltd. RiverSoft is a registered trademark of RiverSoft. All other trademarks and registered trademarks in this document are the properties of their respective owners.
This press announcement does not constitute an offer or invitation to purchase any securities or a solicitation of an offer to buy any securities, pursuant to the proposed offer or otherwise. The offer will be made solely by the formal offer document and the form of acceptance accompanying it, which will contain the full terms and conditions of the offer, including details of how the offer may be accepted.
The availability of the offer to RiverSoft shareholders who are not resident in the United Kingdom may be affected by the laws of the relevant jurisdictions. RiverSoft shareholders who are not so resident should inform themselves of and observe such applicable requirements.
Unless otherwise determined by Micromuse and permitted by applicable law and regulation, the offer for RiverSoft will not be made, directly or indirectly, in or into, or by use of the mails of, or by any other means or instrumentality (including, without limitation, telephonically or electronically) of interstate or foreign commerce of, or of any facility of a national securities exchange of Canada, nor will it be made in or into Australia or Japan and the offer will not be capable of acceptance by any such use, means, instrumentality or facilities or from within Australia, Canada or Japan. Accordingly, unless otherwise determined by Micromuse and permitted by applicable law and regulation, neither copies of this announcement nor any other documents relating to the offer are being, or may be, mailed or otherwise forwarded, distributed or sent in or into Australia, Canada or Japan and persons receiving such documents (including custodians, nominees and trustees) must not distribute or send them in, into or from such jurisdictions.
The UK Panel on Takeovers and Mergers (the "Panel") wishes to draw the attention of member firms of the National Association of Securities Dealers in the United States to certain UK dealing disclosure requirements during the offer period. The offer period (in accordance with the City Code on Takeovers and Mergers (the "Code"), which is published and administered by the Panel) commences at the time when an announcement is made of a proposed or possible offer, with or without terms. RiverSoft has equity securities traded on the London Stock Exchange.
The above disclosure requirements are set out in more detail in Rule 8 of the Code. In particular, Rule 8 requires public disclosure of dealings during the offer period by persons who own or control, or who would as a result of any transaction own or control, one per cent. or more of any class of relevant securities of RiverSoft. Relevant securities include RiverSoft shares, and instruments convertible into RiverSoft shares. This requirement will apply until the first closing date or, if this is later, the date when the Offer becomes or is declared unconditional or lapses.
Seagate NerveCenter's New Smart Polling Architecture Integrates Off-the-Shelf with Micromuses' Netcool
SAN FRANCISCO - Micromuse, Inc., a leading provider of service-level management software, announced that its Netcool(tm) version 3.3 application, now shipping, will integrate off-the-shelf with Seagate Software's NerveCenter release 3.5, announced earlier today. The strategically complementary applications are able to exchange event management data seamlessly, a valuable feature for network operations centers (NOCs) managing huge volumes of events and multiple network environments.
This latest release of Seagate NerveCenter release 3.5 is an easy-to-use proactive event management solution that automatically manages network events and takes appropriate actions to maintain network health and avoid unforeseen network problems, all without operator intervention. Netcool is based on the ObjectServer, a memory-resident database that collects events from more than 50 management environments including Seagate NerveCenter, allowing operators in the NOC to custom-design realtime views of the availability of network services and applications.
"With some forward planning, we were able to base our network operations center on the concept of an integrated Netcool-Seagate NerveCenter architecture," said Allen Thomas, director, enterprise management services, at MindSpring Enterprises, one of the world's fastest-growing Internet service providers. "We discovered that the applications complement each other perfectly and together satisfy our SNMP requirement for realtime service-level management."
Seagate NerveCenter Pro 3.5 allows Netcool operators to easily access data collected by Seagate NerveCenter's polling engine from a tools menu. Netcool can connect directly to an operator-specifed network port, as a result of special hooks developed by Seagate Software to support the enhanced Netcool integration.
Micromuse is shipping an off-the-shelf Netcool software Probe written specifically to accept data polled by Seagate NerveCenter. Together, these extensions facilitate the integration of SNMP and non-SNMP events out of the box.
"Seagate NerveCenter release 3.5 includes the realization of a very tight, joint development effort between Seagate Software and Micromuse," said Michael Colemere, vice president product management and business alliance for Seagate Software, Network and Storage Management Group. "Seagate NerveCenter uses smart polling to filter and correlate events before sending an alert to Netcool, and Netcool allows operators to view and respond to realtime events affecting the availability of services."
"With Seagate NerveCenter's smart polling feature, network bandwidth usage is optimized and only critical events are reported to Netcool via a direct connection with a Netcool Probe," said Rosemary Hill, Netcool product manager for Micromuse. "Through our integration efforts, customers will save time and money, allowing them to focus on leveraging the strengths of each application."
The two companies announced the plan to integrate last year. The synergistic relationship of Netcool and Seagate NerveCenter has been documented at such state-of-the-art NOCs as MindSpring Enterprises and ICG Netcom.
Seagate Software contact:
Jan Jahosky
[email protected]
(407) 531-7908About Seagate Software
Seagate Software, a subsidiary of Seagate Technology, Inc., develops tools and applications for Enterprise Information Management (EIM); the solution for the growing need of corporations for superior information delivery, analysis and availability. Seagate Software's diverse technology and breadth of leading products - including the award-winning Seagate Backup Exec, Seagate Crystal Info, Seagate Crystal Reports, Seagate Desktop Management Suite, Seagate Holos and Seagate WinINSTALL - make it uniquely qualified to deliver EIM with an integrated infrastructure.
Seagate Software has established strategic relationships with Compaq, Hewlett-Packard Company, IBM, Informix, Microsoft, Netscape, Novell, Oracle, PeopleSoft and other industry leaders, and markets its products worldwide, through distributors, value-added resellers, systems integrators, retailers, and OEMs. Seagate Software's home page address on the World Wide Web is http://www.seagatesoftware.com.
Wikipedia
IBM products
WebSphere Business Events puts the power of BEP in the hands of the business user. Through an intuitive graphical user interface, it allows business users to describe, in business language, the business events and patterns to detect, evaluate, and react to in time to meet business objectives.
IBM Cognos Now! delivers an operational BI solution that continuously monitors time-sensitive key performance indicators and line-of-business operational metrics. Designed for rapid deployment and low total cost of ownership, the solution is delivered through a variety of platforms including a prepackaged hardware, software or virtual appliance.
IBM solidDB delivers extreme speed as a persistent, in-memory relational database designed to meet the performance demands of real-time applications.
InfoSphere Streams*
IBM InfoSphere Streams enables continuous and extremely fast analysis of massive
volumes of information-in-motion to help improve business insights and decision
making. Based on the latest stream computing innovations from IBM Research,
InfoSphere Streams represents a revolutionary approach for unlocking the business
value of information.
There are many different sources of data across an organization for monitoring business process functions. Tivoli Netcool/Impact meets the challenge of getting visibility to all different data sources, and can provide correlation, and other automated actions and then enables system administrators to define actions to take once key events have been detected.
IBM Tivoli� Netcool�/OMNIbus� software delivers real-time, centralized supervision and event management for complex IT domains and next-generation network environments. With scalability that exceeds many millions of events per day, Tivoli Netcool/OMNIbus offers round-the-clock management and high automation to help you deliver continuous uptime of business, IT and network services.
Monitoring your business processes can help you stay in touch with your business performance through customizable dashboards, helping to alert you to emerging business situations as they happen. Detecting these business events early helps reduce the impact and increase the ability of a business to respond as needed as soon as events are detected.
Business events occur continuously throughout your enterprise. As an Enterprise Service Bus, WebSphere Message Broker can help to detect events and make them visible, as they happen, anywhere in your business and can be configured to take action on those events as determined by business rules.
Tivoli
This chapter explains the importance of event correlation and automation. It defines relevant terminology and introduces basic concepts and issues. It also discusses general planning considerations for developing and implementing a robust event management system.
broad understanding about event management with a focus on best practices. It examines event filtering, duplicate detection, correlation, notification, escalation, and synchronization. Plus it discusses trouble-ticket integration, maintenance
URL: http://www.redbooks.ibm.com/abstracts/SG246094.html?...
Tivoli software - IBM Tivoli Event Correlation and Automation demo too much hype ;-)
Simple Event Correlation installation and configuration
A severe, practical problem of today's network, systems and application management is the inappropriate management of events. If a problem in the managed system occurs, e.g. a fault or a performance bottleneck, the administrator often is flooded by a burst of more or less meaningless events indicating some symptoms of the problem. Classical event filtering mechanisms had little impact on this. The aim of the event correlator we are developing is to reduce the number and enrich the meaning of the events shown to the administrator. Ideally the event correlator is able to condense the received events to a single event directly indicating the problem in the managed system. Our work is focussed on the methods to gain a dependency graph of the managed system, which is needed by a powerful event correlator.
Event correlation is also known as alarm correlation. This definition of "alarm filtering" basically means the same. However, I would replace "network device" by "managed object". I use the term "event filtering" to describe a mechanism separating relevant from irrelevant events and the term "event correlation" to describe a mechanism condensing relevant events to even more relevant events.
Event Correlators in the narrow sense
http://www.smarts.com/ System Management ARTS (linked with Columbia University and IBM) has an event correlator called InCharge. Its technology is based on Codebook Event Correlation as explained in High Speed & Robust Event Correlation by Yemini/Kliger et al..
Expert Systems
ToDo: Alcatel NM-Expert as described here
Gensym's G2 / Fault Expert is an expert system for fault management. Its rule base includes rules for event correlation. Is it the same as the Operations Assistant?
ILOG's ILOG Rules is a rule-based expert system that has been applied for fault management.
Talarian's expert system RTie was applied to correlate events. See RTworks Real-Time Software Tools for Advanced Alarm Correlation. Used by MCI, also see IBM NetView TMN Support Facility and RTie
ToDo: BIM Networks NetCortex (with Solstice)
Fault Management Tools
Computer Associates's Unicenter TNG has a event automation component called Unicenter TNG Automation Point Option, which includes rule-based event correlation capabilities. Extensible agents built with CA-Unicenter/AgentFactory are also intended to do some event correlation close to the components. See the technical white paper on Unicenter TNG for details.
MAXM's MAX/Enterprise is a rule-based event management system for automating the whole process of fault detection, localization and repair.
Stanford Telecom's NetCoach Fault Manager is a fault management tool for ATM devices including event correlation capabilities.
Management Platforms
Advent's Web NMS lets you specify your correlation rules in Java.
In Bull's ISM/OpenMaster management suite a rule-based event correlator called ISM Event Processor is mentioned in this technical whitepaper. But I couldn't find a real product description.
Cabletron's Spectum has an add-on called SpectroRx Resolution Expert, which uses case-based reasoning to localize faults. Another add-on, the Spectrum Alarm Notification Manager, provides filtering of events. Third-party products with event correlation capabilities include Spectrum and Seagate Nerve Center Pro and Spectrum and MAX/Enterprise and for security management Spectrum and OmniGuard / IntruderEvents (ITA).
In Linmor's Nebula - Network Management System object-oriented repository a MO's depended objects are stored. Event correlation is done by walking along the dependencies (see the white paper).
In MegaSys's Telenium event categories are defined to classify the impact of a fault to a MO. Model-based event correlation is enabled by relational information stored in the database. See here.
For Digital's TeMIP Framework for Digital Unix there is the TeMIP Fault and Trouble Management for Digital UNIX, which includes an event correlator. Events can be correlated by comibining filters, especially filters considering time aspects.
For HP's OpenView platform there are the Event Correlation Services (ECS) for IT/Operations. In ECS you program "correlation circuits" to define the processing of events. The manuals and an article about ECS from the HP-Journal are online. Internally ECS uses ECDL, a functional programming language. The HP OpenView Telecom version is simply called Event Correlation Services. There is another approach implemented for the telecommunications area within the HP OpenView Fault Management Platform (FMP) which is part of the HP OpenView Element Management Framework (OEMF). Here the user provides rules describing a root-cause relation. See the HP-Journal article for details. This approach can be combined with ECS.
Siemens Nixdorf Informationssysteme has a rule-based event correlator called Transview EventCenter. The user's guide is online.
Sun Microsystems's Solstice has an event correlator called Nerve Center within the Solstice Enterprise Manager. Using the Request Designer one can program "request templates". A request template is structured as a finite state machine. A state transition occurs when a certain condition is true. Conditions are programmed in the Request Condition Language (RCL), a imperative programming language. See the online manuals for details. Seagate's NerveCenter uses the same technology.
Tivoli's ("an IBM company") TME 10 Management Environment has a rule-based event correlation engine in its TME 10 Enterprise Console (TEC).
Other
Axent's tool for security management OmniGuard / IntruderEvents (ITA) detects intruders by analyzing events using its rule-based inference engine.
There still is Digital's Polycenter Manager on NetView. What about it after this? It is not mentioned here.
ToDo: BMC
Italtel ("a Stet and Siemens company") has solved (among other) the issue of event correlation for TMN-environments :-). I don't know how its SALT/SSRN does it.
Micromuse's event manager Netcool/OMNIbus has rule-based event correlation capabilities. Within their ObjectServer one can define "Trigger" to watch for certain types of events or certain conditions to occur. They compared it with NerveCenter.
ToDo: GTE's Enterprise Management System (GEMS) for the telecommunications area has a rule-based event correlator (see "Problem Resolution"). Some technical information can be found here. Is it still called "Impact"?
Event Management Standardisation Activities
Object Management Group (OMG):
Telecommunications Domain Task Force: Notification Service (Request For Proposal)
however not Management specific the "CORBAservices - Event Management Service" (ps, pdf) is also relevant
OpenGroup (the join of Open Software Foundation (OSF) and X-Open):
Systems Management: Event Management Service (XEMS) (preliminary specification) [local mirror @ mnmteam]
Joint Inter-Domain Management (JIDM): Specification Translation [local mirror @ mnmteam]; provides a mapping between CMIP Notifications and CORBA Events and between SNMP Traps and CORBA Events)
Internet Engineering Task Force (IETF)
SNMPv2 Framework: RFC1902-1908 (draft standard) [mirror @ leo]
Distributed Management WorkingGroup (disman):
Event MIB (internet draft) [mirror @ leo]
Notification MIB (internet draft) [mirror @ leo]
Disman Meeting Aug97@Munich (minutes)
WWW Distributed Authoring and Versioning (webdav) Note: The terminology complies to the Corba Event Service:
Requirements for Event Notification Protocol (internet draft, 16-Apr-98)
Requirements for Event Notification Protocol (internet draft, 05-May-98)
Architecture / Section Event Notification
Programmer's Guide / Section Event Management
Web-based Enterprise Management (WBEM): HMMP Events (still not a internet draft)
Telecommunications Information Networking Architecture Consortium (TINA-C):
Network Resource Architecture / Section 6: Fault Management
Engineering Modelling Concepts (DPE Architecture) / Section 6.5: Notification Service
TMN Management Functions - function set group "Alarm Surveillance" - function set "Alarm Correlation", ITU-M.3400 (content not online for free)
Online Resources
High Speed & Robust Event Correlation by Yemini/Kliger et al.
various product analyses (found on the Cabletron server)
The Section Alarm Correlation in Network Management - What it is and what it isn't. by Douglas W. Stevenson (duplicated here and here)
In the current Web-based Enterprise Management Proposal there is a paragraph called "Event Correlation and Forwarding" stating that WBEM knows OSI-like discriminator objects. Event correlation and event forwarding is not the same :-)
ToDo: search in techweb.cmp.com
Journal of Network and Systems Management: Vol. 5, No. 2, 2 June 1997 Special issue: Fault Management in Communication Networks
A comparison between Micromuse's Netcool/OMNIbus and Seagate's NerveCenter Pro (from Micromuse's webserver)
Guangtian Liu's home pageCo-author of JECTOR, JEM and JESL.
A Unified Approach for Specifying Timing Constraints and Composite Events in Active Real-Time Database Systems Constraints Formal approach to specification.
Tech Reports: HPL-98-74: Semantic Mapping of Events Petri-net approach for event correlation. Looks at the properties needed for advanced correlation: 1) traditional constructs 2) domain specific correlation 3) dynamic correlation 4) detection of data and temporal events 5) transperant event base management 6) performance
Composite Events for Network Event Correlation Discusses various algorithms and their performance for matching event patterns. Contains a lit-review of existing event correlation services (HP/ECS, NerveCenter, etc)
OpenGroup Event Management Service Prelimary Specification
Systems Management: Event Management ServiceThe Open Group
HP Books: Technical books: UNIX Fault Management: A Guide For ...
Tivoli SG246094 Ch 1. Introduction to event management
CSQL is a compact main memory database SQL engine that supports a limited set of features and provides fast responses to database queries. It supports features used by most real-time applications, which includes INSERT, UPDATE, DELETE, and SELECT on a single table with local predicates. It can also be used as middle tier caching solution for any open source or commercial database, thereby increasing the throughput by a factor of 20-100.
Querylog is a console tool for performing SQL queries on a (log) file. Lines from one or more text files or stdin are matched, using regular expressions to an in memory database on which SQL queries can be performed.
SHSQL is a standalone SQL database that stores data in ASCII text files. It has a small memory footprint and code size and can be embedded directly into applications; there is no server process. SHSQL is a pared-down SQL implementation but retains useful features such as timeout record locking and search engine comparison operators. A shsql database can be updated via SQL, or by editing data files with a text editor. Applications link to the supplied "C" language API. There is also a command-line SQL utility.
MonetDB is a database management system developed from a main-memory perspective using a fully decomposed storage model, automatic index management, extensibility of data types and search accelerators, and SQL and XQuery frontends.
Author:
Niels Nes [contact developer]
SUMMARY OF THE INVENTION
This invention describes a set of linked activities and supporting automation tools that provide for the analysis and documentation of a customer's systems and distributed computing network monitoring and event processing requirements. This methodology is designed as a front-end to effective implementation of event management products such as Tivoli Enterprise Console (TEC), which is a platform described herein for exemplary purposes only. This methodology is open, i.e., capable of front-ending the implementation of any distributed monitoring or event management product, and the invention is not limited to any specific products. The output of the methodology includes a set of design documents that serve as input to effective customization of monitoring and event processing facilities and the development of complex event correlation rules. The methodology is supported by a set of personal computer-based analysis and documentation tools. This specification also describes a software implementation of the result of such methodology, thus preventing an ad hoc approach by individual implementers.
Event Management Design (EMD) is a process developed by IBM Corporation to define the policies and procedures for managing the flow of events in a distributed computing environment. This encompasses the identification of events, filtering practices, and correlation analysis. The process is product independent. At the end of the design, the client is presented with a set of spreadsheets and graphical representations for every source of events in their particular environment. The spreadsheets contain the listings of all events, their enterprise significance, the event significance, and their necessity for correlational analysis. The resulting drawings, using a product such as Visio, are graphic representations of the correlations. These two documents provide all the necessary information for implementing the design as a practical solution.
IBM has further extended EMD to include a design implementation as described in co-pending patent application Ser. No. 09/488,689 which is incorporated by reference herein. This invention provides extensions to the functionality of the tools used in EMD. It includes a spreadsheet that is used to aid in the development of Basic Recording of Objects in C (BAROC) files. Once certain detailed information is added to this sheet, it automatically builds the BAROC files, using whatever class names are provided. The drawing diagrams include code that allows for the generation of Tivoli Enterprise Console (TEC) rules, using specified basic rule templates developed by the EMD implementor. The new drawing code propagates the templates with appropriate class names as determined from the drawings, as well as adding in status and severity changes, timing delays, and locations of scripts to be executed.
There is a single drawing file for each type of unique event source (e.g., hardware device, operating system platform, application). The entire suite of correlation drawings define an Event Relationship Network (ERN). The ERN includes a series of pages which show the subset of correlation relationships. Each of these pages is called a subnet. Subnets may link to other subnets, spanning as many pages as required to fully represent the set of correlational relationships. To a certain extent, the set of events on a given subnet is somewhat arbitrary. There is a physical limitation to the number of events that can be placed on any given page, and the break from page to page is the decision of the implementor. On the other hand, a subnet may contain a complete logical set of relationships, especially when it does not span to any other pages.
BRIEF DESCRIPTION OF THE DRAWINGS
FIG. 1 illustrates an example of a correlation diagram having a single event with a clearing event.
FIG. 2 illustrates an example of a correlation diagram having a single chain of events with clearing events.
FIG. 3 illustrates an example of a complex correlation diagram.
FIG. 4 illustrates a subnet descendant class structure of the present invention.
FIG. 5 illustrates a subnet ancestor class structure of the present invention.
FIG. 6 illustrates the complex correlation diagram of FIG. 3 with path identification numbers added.
FIG. 7 illustrates the complex correlation diagram of FIG. 3 with path identification and sequence identification numbers added.
FIG. 8 illustrates the processing logic to define an Event Relationship Network (ERN) in accordance with an exemplary embodiment of the present invention.
FIG. 9 illustrates the processing logic for generation of BAROC classes in accordance with a preferred embodiment of the present invention.
DETAILED DESCRIPTION OF THE INVENTION
The Tivoli Enterprise Console is used in the following description as the operating platform to facilitate understanding of the present invention. Tivoli's Enterprise Console is a powerful event management and automation application that provides rules-based event correlation for various system components including network, hardware, database, and applications. It offers a centralized, global view of a distributed computing enterprise, while ensuring high availability of applications and computing resources. The Enterprise Console has three primary features that distinguish it from other products: event integration, event processing, and event response and notification. The Enterprise Console receives, processes, and automatically responds to system events, such as a database server being down, a network connection being lost, or a batch processing job completing successfully. It acts as a central collection point for alarms and events from a variety of sources.
In a classic Tivoli implementation, the relationship of each event in the correlational chain with each and every other event in the chain has to be considered. As such, a simple information function can be defined that determines the number of relationships that must be known and implemented for any given chain of events. If I(�n)n represents the information function for a set of n related events, then a classic implementation requires that the total number of states to be known is:
However, the event relationship can be treated not as a linear flow of events, but rather as a hierarchical connected graph. These graphs are defined as hierarchical since any event potentially contains (implicitly) the information of all the preceding events. If this were not the case, then correlational analysis could not be performed since, by definition, the events would share no common information, and would then be random, unrelated occurrences. By examining the set of events as a connected graph, the amount of information required to understand an individual event's relationship to any other event in its connected network can be reduced. If ni represents an element in the chain, and pi represents the number of paths the element is connected to within the graph, and if s=1 is defined to be the sequence position along the graph, and by default a single condition of information, then the total number of conditions that need to be known for any element is: ##EQU1##For a chain of x events, the total number of states can be defined to be:
If a chain of events is considered, starting with a single root cause event, which then has two branches with each branch containing four resultant events, then the following results illustrate the advantage of the present invention:1. For a traditional Tivoli implementation, the total number of states that need to be known is: ##EQU2##
In the case of a hierarchical connected graph, the number of states that need to be known is: ##EQU3##
The first element represents the root cause (two branches plus one positional information equals three states). Since all other events only exist on a single path, they each have one branch plus one position equals two states. The propagation of this path and sequence information is done automatically by an EMD/IT tool, based on the constructs described herein.
Of the two driving purposes of TEC monitoring, i.e., 1) correlation to determine root cause, and 2) automated response to events, only the correlation problem is considered in this invention. In the present context, correlation analysis is defined as establishing a set of relationships where the ultimate causal event can be determined. This is the primary purpose of the TEC logic engine. Automated response to a causal event is not inherently built into the TEC code, but rather is the use of appropriate scripts executed in response to the determination of the causal event. As such, the scripts are external to the TEC code, and may vary among different implementations, depending on the system management process. The development of automated scripts is a separate process-driven function from correlation analysis.
The key elements of the present invention are as follows: 1. definition of events based on a connected graph model; 2. hierarchical naming convention to be used in the BAROC (Class Definition) files; 3. informational slot definitions required to effectively perform a correlation (root cause) analysis; 4. a basic ruleset template that handles all correlations; and 5. modifications to the software toolset described in co-pending patent application, Ser. No. 09/488,689 to automate the correlation process.
The present invention has a number of advantages as described in this paragraph. BAROC file class definition structure and naming structure are standardized. The naming conventions and structure are integrated into the logical design resulting from EMD. The logical flow of event correlation is totally reflected in the BAROC files. Any support person can now work through the logical structure without having access to the original EMD material. Path and sequence identification (ID) searches to determine event status is more efficient than current methods permit. It reduces the requirement to search the entire event cache for multiple events. By integrating the EMD results, BAROC files and rule sets, a system is created that lends itself to well-governed change management procedures. No changes can be made on any single component without affecting the others. As such, any change will require a comprehensive review of the logical structure, and the implications for the implementation. Documentation of changes is a requisite to maintain the integrity of the integration. By reducing to six the number of essential templates, implementation can be faster, and the skill level required to implement is reduced accordingly. A rulebase and BAROC structure are created that are consistent across the enterprise.
In order to make the most efficient use of the logic engine, only one event within a given set of causal relationships can be available for correlation at any given time. All other events will have some aspect of their status changed to remove them from future correlation analysis. There are many ways in which this can be achieved. The event can be dropped, closed, its severity changed, or a new slot can be created for all events which can be flagged for its status as a correlation candidate. The ultimate goal is that at any given time, a console can be viewed and the only events appearing would be the best estimate of a causal event at that given time.
The description of the logical flow of events in a given system makes use of the following definitions: Autonomous Events: These are isolated events. In other words, they can have no causal events, nor can they be a proximate cause for any other event. There can also be no clearing events for autonomous events. As such, these events will never appear in a Visio diagram, as there is no logic flow associated with their existence. All autonomous events are handled by a single rule as defined by policy, i.e., duplicate detection, escalation, trouble ticketing, etc. Primary Event: This can also be defined as the root cause event. It can have no precedent events, but may have any number of ancillary events as a result of its existence. Primary/Secondary Event: This event can be either a causal event, or can be the result of some other event distal to the root cause event. Secondary Event: This event can only result from some other event distal to the root cause event. It can never occur spontaneously, nor can it be the causal event for any other event. Clearing Event: This event signals a return to some defined steady state or normal status. A single clearing event can clear multiple events. A clearing event can never have a causal precedent. Subnet: A subnet is the set of events with appropriate logical flow completely diagrammed. It is represented by a single page within an ERN. A subnet can be autonomous, causal, or secondary to other subnets, and by inference, other events. Connector: The connector identifies the direction of logical flow. Using these definitions we can now redefine the several types of events as follows: Autonomous Event: has no connectors associated with it. Primary Event (P): can have n connectors flowing away from it; must have zero connectors flowing into it, with the exception of a connector from a clearing event. Primary/Secondary Event (P/S): can have n connectors flowing into it; can have m connectors flowing out of it. Secondary Event (S): can have n connectors flowing into it; must have zero connectors flowing out from it. Clearing Event (C): can have n connectors flowing out from it; must have zero connectors flowing into it.
Subnets can be defined under the same requirements. As such, there can be autonomous subnets, primary subnets, primary/secondary subnets, or secondary subnets. There is no such thing as a clearing subnet.
FIG. 1 illustrates an example of a single event with a clearing event. This is probably the simplest type of correlation possible. A single event occurs, and since it is neither caused by any other event, nor does it cause any other event, it is by definition a primary event. The only event associated with it is a clearing event that signals a return to normal events.
FIG. 2 illustrates an example of a single chain of events with clearing events. This represents a more typical system of correlation, where there is a single chain of causal events, and a set of explicitly defined clearing events. It should be noted that the event that clears both the primary/secondary event and the secondary event is normally represented in Visio as only clearing the primary/secondary event, since clearing of the secondary event is implied by the logical event flow. The explicit clearing in this case is a requirement under the automation system currently used by the EMD implementation in Tivoli Enterprise Console (TEC). The above system better expresses the definition of a subnet, where there is a complete set of events and logical flow designed. A point to consider, which is described further below, is that only the causal chain of events are required for correlation analysis, since the clearing events are restricted to the local subnet. As such, the concept of a path or paths of causal events within a subnet is important to bear in mind.
FIG. 3 illustrates an example of a complex correlation diagram. Intrinsic to this is the internal subnet, which consists of a single primary event, multiple primary/secondary and secondary events. Subnet A represents a causal subnet to one chain of logical flow, while Subnet B is a secondary subnet resultant from a single primary/secondary event. The logical flow illustrates the possibility of multiple paths from any particular event, as well as the possibility for multiple flow into any given event. This example provides all the necessary complexity to illustrate the principles for event management design of the present invention.
The necessary and sufficient conditions for correlation analysis are as follows: 1. the position of any event on a logical directed graph can be defined by two terms-path identification and sequence identification; 2. since the events may belong to multiple paths, the path identification must be a list of integers, conceptually, this is the set of all paths that flow through any given event; 3. the sequence identification is a single integer that defines the relative position of the event on the path or paths.
Events can then be redefined in the following expressions of path ID and sequence ID: Primary Event: Path ID={1,2,3, . . . n}; Sequence ID=0. Since the event is the root cause, it can be defined as its own class, and all other events flowing from it become a subclass of it. This accelerates the search process. Primary/Secondary Event: Path ID={1,2,3 . . . n}; Sequence ID ε{n, n+1, . . . m}. Secondary Event: Path ID={1,2,3, . . . n}; Sequence ID=maximum integer value for any of the paths of which it is a member. Clearing Event: Path ID={-;1,-;2,-;3, . . . -;n}; Sequence ID=0. The negative path ID is required to signal that this is a clearing event, and not a candidate for root cause correlation. Implicit to this is that any event that is cleared by this event has knowledge of the negative path ID associated with it.
Therefore, the only necessary condition required to determine the relative causal status of an event is as follows: Step 1: Is the event in the path of a known event? If yes, go to step 2. If no, the event is the current primary event. Step 2: What is the sequence ID of the event?If the event sequence number is greater than the known event in the path, then the event is a secondary event, and is removed from further correlational analysis. If the event sequence number is less than the known event in the path, then the event is the current primary event, and the previous known event is removed from further correlational analysis. It is necessary at this time to reiterate that only one event within a given path will remain open for correlation at any given time.
The above-described meta-algorithm is sufficient to determine the status (i.e., primary or secondary) of any event within a given subnet. A problem occurs when multiple subnets are introduced. Logically, the above algorithm can be extended through all connected subnets, but the problem becomes one of propagating all the path IDs in a consistent manner. This is not a true NP-hard problem, but is bounded by a very large polynomial time signature. However, by synthesizing the subnet names with the BAROC class definitions, the search process can be minimized to class structure only.
Unfortunately, simply identifying a subnet as a BAROC class is not sufficient. It is not inconceivable, and is actually probable, that only one path within a subnet leads to another subnet, and there may be other events within the primary subnet that should not be correlated with the secondary subnet. If all events in that subnet were events defined as descendant to the metaclass named for the subnet, then the process would result in spurious correlations. As such, a structure for BAROC class names and hierarchy needs to be defined that reflects the logical flow of events. The following is an exemplary structure for BAROC class naming. ERN_Class: All events within an event source (Lotus Notes, AIX, Cisco) become members of this class. ERN_Autonomous: All autonomous events go in this class, since they are handled by a single rule that handles issues like duplicate detection, trouble ticketing, etc. This is a descendant class of Event_Class. Subnet Class: All events in the subnet become members of this class. It is also a descendant class of ERN_Class. Subnet Clearing: All clearing events are in this class. This is a descendant class of ERN_Class.
If the subnet has no connections to other subnets, then this is the finest resolution necessary. All internal correlations are dependent on path ID and sequence ID, so there will be no searching of classes beyond the Subnet_Class level. If the subnet does connect to other subnets, then the following class structures must be incorporated: Subnet_Descendant#: If elements of the subnet are secondary to events on another subnet, than all events in the direct flow from the primary subnet entry point are members of this class. It is a descendant class of ERN_Class. The # value is merely indicative that there may be multiple flows within the subnet that need to be considered as separate classes. The subnet descendant class structure is illustrated in FIG. 4. Subnet_Ancestor#: This is the logical inverse of Subnet_Descendant. However, it poses some unique problems. The general definition is that if elements of a subnet are primary to another subnet, then those elements are a member of the class Subnet_Ancestor. These may be either descendant to ERN_Class or Subnet_Descendant, depending on the logical structure. Unlike Subnet_Descendant, not everything in the flow can be placed into one class. The problem comes when there are branches in the logical flow that lead to multiple subnets. In order to make class naming discrete, the following structure must be used. A nodal event is defined as one that has n paths flowing out of it. A proximal nodal event is one that is closer to the root cause event of the entire path, while a distal nodal event is one that is farther away. The terminal event is the event where the path flows to the next subnet, and is essentially a specialized distal nodal event. Events are then clustered into Subnet_Ancestor classes by following a simple rule. All events assigned to a specific Subnet_Ancestor are from a distal nodal event to the next most proximal nodal event. However, the cluster does not include that proximal event. The subnet ancestor class structure is illustrated in FIG. 5.
The correlation template described in co-pending patent application, Ser. No. 09/488,689 is modified as described below: 1. The following slots need to be defined in a BAROC file immediately descendant from root.baroc (the ancestral class definition for all events): path_id, sequence_id, descendant_class, and ancestral_class. The path_id will be a list of integers, the sequence_id is a single integer, and the descendant_class and ancestral_class are both a list of string names as defined in the BAROC file. 2. For any event on a subnet which has either primary or secondary subnets, and where that event lies in a logic flow that it connects to those subnets, it will have its ancestral_class slot populated with a list of all Subnet_Ancestor names for all classes which are primary to it and lie on the logical flows. The converse situation is used for Subnet_Descendant to populate the descendant_class slot. 3. Path_ID slot is propagated with the list of all the path numbers that the event is relevant to within its own ERN. An example is illustrated in FIG. 6 and described in the discussion on the propagation of path ID numbers below. 4. Sequence_ID slot is filled with the appropriate sequence number for that path. An example is illustrated in FIG. 7 and described in the discussion of sequence ID numbers below.
The generic correlation template becomes: Step 1: For any event of class within Subnet_Ancestor; if present, make the current event secondary, and remove from future correlation analysis. Step 2: For any event of class within Subnet_Descendant, if present, make the current event the primary event, and remove the older event from future correlation analysis. Step 3: For any event on the subnet (Subnet_Class) where the Path_ID of the current event intersects the Path_ID of the older event; if the current event sequence_ID
Other References
- Thoenen, David et al. "Event Relationship Networks: A Framework for Action Oriented Analysis in Event Management." Sep. 28, 2000.
- Koch, Thomas et al. "Rules and Agents for automated Management of distributed systems." Jun. 1996.
- "Audit Trail Support for Program Activity Implementations of Workflow Management Systems," Research Disclosure, Mar. 1998, pp. 309-310.
Society
Groupthink : Two Party System as Polyarchy : Corruption of Regulators : Bureaucracies : Understanding Micromanagers and Control Freaks : Toxic Managers : Harvard Mafia : Diplomatic Communication : Surviving a Bad Performance Review : Insufficient Retirement Funds as Immanent Problem of Neoliberal Regime : PseudoScience : Who Rules America : Neoliberalism : The Iron Law of Oligarchy : Libertarian Philosophy
Quotes
War and Peace : Skeptical Finance : John Kenneth Galbraith :Talleyrand : Oscar Wilde : Otto Von Bismarck : Keynes : George Carlin : Skeptics : Propaganda : SE quotes : Language Design and Programming Quotes : Random IT-related quotes : Somerset Maugham : Marcus Aurelius : Kurt Vonnegut : Eric Hoffer : Winston Churchill : Napoleon Bonaparte : Ambrose Bierce : Bernard Shaw : Mark Twain Quotes
Bulletin:
Vol 25, No.12 (December, 2013) Rational Fools vs. Efficient Crooks The efficient markets hypothesis : Political Skeptic Bulletin, 2013 : Unemployment Bulletin, 2010 : Vol 23, No.10 (October, 2011) An observation about corporate security departments : Slightly Skeptical Euromaydan Chronicles, June 2014 : Greenspan legacy bulletin, 2008 : Vol 25, No.10 (October, 2013) Cryptolocker Trojan (Win32/Crilock.A) : Vol 25, No.08 (August, 2013) Cloud providers as intelligence collection hubs : Financial Humor Bulletin, 2010 : Inequality Bulletin, 2009 : Financial Humor Bulletin, 2008 : Copyleft Problems Bulletin, 2004 : Financial Humor Bulletin, 2011 : Energy Bulletin, 2010 : Malware Protection Bulletin, 2010 : Vol 26, No.1 (January, 2013) Object-Oriented Cult : Political Skeptic Bulletin, 2011 : Vol 23, No.11 (November, 2011) Softpanorama classification of sysadmin horror stories : Vol 25, No.05 (May, 2013) Corporate bullshit as a communication method : Vol 25, No.06 (June, 2013) A Note on the Relationship of Brooks Law and Conway Law
History:
Fifty glorious years (1950-2000): the triumph of the US computer engineering : Donald Knuth : TAoCP and its Influence of Computer Science : Richard Stallman : Linus Torvalds : Larry Wall : John K. Ousterhout : CTSS : Multix OS Unix History : Unix shell history : VI editor : History of pipes concept : Solaris : MS DOS : Programming Languages History : PL/1 : Simula 67 : C : History of GCC development : Scripting Languages : Perl history : OS History : Mail : DNS : SSH : CPU Instruction Sets : SPARC systems 1987-2006 : Norton Commander : Norton Utilities : Norton Ghost : Frontpage history : Malware Defense History : GNU Screen : OSS early history
Classic books:
The Peter Principle : Parkinson Law : 1984 : The Mythical Man-Month : How to Solve It by George Polya : The Art of Computer Programming : The Elements of Programming Style : The Unix Hater�s Handbook : The Jargon file : The True Believer : Programming Pearls : The Good Soldier Svejk : The Power Elite
Most popular humor pages:
Manifest of the Softpanorama IT Slacker Society : Ten Commandments of the IT Slackers Society : Computer Humor Collection : BSD Logo Story : The Cuckoo's Egg : IT Slang : C++ Humor : ARE YOU A BBS ADDICT? : The Perl Purity Test : Object oriented programmers of all nations : Financial Humor : Financial Humor Bulletin, 2008 : Financial Humor Bulletin, 2010 : The Most Comprehensive Collection of Editor-related Humor : Programming Language Humor : Goldman Sachs related humor : Greenspan humor : C Humor : Scripting Humor : Real Programmers Humor : Web Humor : GPL-related Humor : OFM Humor : Politically Incorrect Humor : IDS Humor : "Linux Sucks" Humor : Russian Musical Humor : Best Russian Programmer Humor : Microsoft plans to buy Catholic Church : Richard Stallman Related Humor : Admin Humor : Perl-related Humor : Linus Torvalds Related humor : PseudoScience Related Humor : Networking Humor : Shell Humor : Financial Humor Bulletin, 2011 : Financial Humor Bulletin, 2012 : Financial Humor Bulletin, 2013 : Java Humor : Software Engineering Humor : Sun Solaris Related Humor : Education Humor : IBM Humor : Assembler-related Humor : VIM Humor : Computer Viruses Humor : Bright tomorrow is rescheduled to a day after tomorrow : Classic Computer Humor
The Last but not Least Technology is dominated by two types of people: those who understand what they do not manage and those who manage what they do not understand ~Archibald Putt. Ph.D
Copyright � 1996-2021 by Softpanorama Society. www.softpanorama.org was initially created as a service to the (now defunct) UN Sustainable Development Networking Programme (SDNP) without any remuneration. This document is an industrial compilation designed and created exclusively for educational use and is distributed under the Softpanorama Content License. Original materials copyright belong to respective owners. Quotes are made for educational purposes only in compliance with the fair use doctrine.
FAIR USE NOTICE This site contains copyrighted material the use of which has not always been specifically authorized by the copyright owner. We are making such material available to advance understanding of computer science, IT technology, economic, scientific, and social issues. We believe this constitutes a 'fair use' of any such copyrighted material as provided by section 107 of the US Copyright Law according to which such material can be distributed without profit exclusively for research and educational purposes.
This is a Spartan WHYFF (We Help You For Free) site written by people for whom English is not a native language. Grammar and spelling errors should be expected. The site contain some broken links as it develops like a living tree...
|
|
You can use PayPal to to buy a cup of coffee for authors of this site |
Disclaimer:
The statements, views and opinions presented on this web page are those of the author (or referenced source) and are not endorsed by, nor do they necessarily reflect, the opinions of the Softpanorama society. We do not warrant the correctness of the information provided or its fitness for any purpose. The site uses AdSense so you need to be aware of Google privacy policy. You you do not want to be tracked by Google please disable Javascript for this site. This site is perfectly usable without Javascript.
Created Jan 10, 2002; Last modified: March 12, 2019