A system log is a recording of certain events. The kind of events found in a
system log is determined by the nature of the particular log as well as configurations
used to control those events in daemons and applications that use the central logging
facility. System logs (as exemplified by the classic Unix syslog daemon) are usually text files
containing a timestamp and other information specific to the message or subsystem.
The importance of a network-wide, centralized logging infrastructure cannot be
underestimated. This is a really central part of any server monitoring infrastructure.
Analysis of logs also can be an important part of security infrastructure. Much
more important then fashionable Network Intrusion detection system -- a black hole
that consumes untold number of millions of dollars each year in most developed countries.
This page presents several approaches to collect and monitor system
logs, and first of all based on traditional Unix syslog facility. Some
important issues include:
Logfile filtering: You can improve the quality of the data
in your logs by using technologies used in spam filters. You can actually discard
50% of log records without losing any important data. But still the question
remains: How much data you need in logs and what events are useful and which
are not.
Logfile centralization: Building a central loghost for
Unix/Linux servers and integrating
MS Windows systems into your UNIX log system
Log management: Centralization, parsing, and storing all that data
possibly using specialized tools. Due to availability of large harddrives
now it is feasible temporary store logs in databases like MySQL which greatly simplify
processing. Another option is conversion to XML and using XML processing
infrastructure.
Log archiving: how long you need to store your logfiles
The first step in enterprise log analysis is creation of central Loghost server
-- the server that collects logs from all servers or all servers of specific type
(for example one for AIX, one for HP and one for Solaris).
Installing the recent linux version seems to come with a default setting of flooding the
/var/log/messages with entirely annoying duplicitous messages like:
systemd: Created slice user-0.slice.
systemd: Starting Session 1013 of user root.
systemd: Started Session 1013 of user root.
systemd: Created slice user-0.slice.
systemd: Starting Session 1014 of user root.
systemd: Started Session 1014 of user root.
Here is how I got rid of these:
vi /etc/systemd/system.conf
And then uncomment LogLevel and make it: LogLevel=notice
  1 # This file is part of systemd.
  2 #
  3 #  systemd is free software; you can redistribute it and/or modify it
  4 #  under the terms of the GNU Lesser General Public License as published by
  5 #  the Free Software Foundation; either version 2.1 of the License, or
  6 #  (at your option) any later version.
  7 #
  8 # Entries in this file show the compile time defaults.
  9 # You can change settings by editing this file.
 10 # Defaults can be restored by simply deleting this file.
 11 #
 12 # See systemd-system.conf(5) for details.
 13
 14 [Manager]
 15 LogLevel=notice
 16 #LogTarget=journal-or-kmsg
Using the journalctl utility of systemd, you can query these logs, perform various operations on them. For example, viewing the
log files from different boots, check for last warnings, errors from a specific process or applications. If you are unaware of these,
I would suggest you quickly go through this tutorial –
"use journalctl to View and Analyze
Systemd Logs [With Examples] " before you follow this guide.
Where are the physical journal log files?
The systemd's journald daemon collects logs from every boot. That means, it classifies the log files as per the boot.
The logs are stored as binary in the path /var/log/journal with a folder as machine id.
For example:
Screenshot of physical journal file -1
Screenshot of physical journal files -2
Also, remember that based on system configuration, runtime journal files are stored at /run/log/journal/ . And these
are removed in each boot.
Can I manually delete the log files?
You can, but don't do it. Instead, follow the below instructions to clear the log files to free up disk space using journalctl
utilities.
How much disk space is used by systemd log files?
Open up a terminal and run the below command.
journalctl --disk-usage
This should provide you how much is actually used by the log files in your system.
If you have a graphical desktop environment, you can open the file manager and browse to the path /var/log/journal
and check the properties.
systemd journal clean process
The effective way of clearing the log files should be done by journald.conf configuration file. Ideally, you should
not manually delete the log files even if the journalctl provides utility to do that.
Let's take a look at how you can delete it
manually , then I will explain
the configuration changes in journald.conf so that you do not need to manually delete the files from time to time; Instead,
the systemd takes care of it
automatically
based on your configuration.
Manual delete
First, you have to flush and rotate the log files. Rotating is a way of marking the current active log
files as an archive and create a fresh logfile from this moment. The flush switch asks the journal daemon to flush any log data stored
in /run/log/journal/ into /var/log/journal/ , if persistent storage is enabled.
Then, after flush and rotate, you need to run journalctl with vacuum-size , vacuum-time , and
vacuum-files switches to force systemd to clear the logs.
Example 1:
sudo journalctl --flush --rotate
sudo journalctl --vacuum-time=1s
The above set of commands removes all archived journal log files until the last second. This effectively clears everything. So,
careful while running the command.
journal clean up – example
After clean up:
After clean up – journal space usage
You can also provide the following suffixes as per your need following the number.
s: seconds
m: minutes
h: hours
days
months
weeks
years
Example 2:
sudo journalctl --flush --rotate
sudo journalctl --vacuum-size=400M
This clears all archived journal log files and retains the last 400MB files. Remember this switch applies to only archived log
files only, not on active journal files. You can also use suffixes as below.
K: KB
M: MB
G: GB
Example 3:
sudo journalctl --flush --rotate
sudo journalctl --vacuum-files=2
The vacuum-files switch clears all the journal files below the number specified. So, in the above example, only the last 2 journal
files are kept and everything else is removed. Again, this only works on the archived files.
You can combine the switches if you want, but I would recommend not to. However, make sure to run with --rotate switch
first.
Automatic delete using config files
While the above methods are good and easy to use, but it is recommended that you control the journal log file cleanup process
using the journald configuration files which present at /etc/systemd/journald.conf .
The systemd provides many parameters for you to effectively manage the log files. By combining these parameters you can effectively
limit the disk space used by the journal files. Let's take a look.
journald.conf parameter
Description
Example
SystemMaxUse
Specifies the maximum disk space that can be used by the journal in persistent storage
SystemMaxUse=500M
SystemKeepFree
Specifies the amount of space that the journal should leave free when adding journal entries to persistent storage.
SystemKeepFree=100M
SystemMaxFileSize
Controls how large individual journal files can grow to in persistent storage before being rotated.
SystemMaxFileSize=100M
RuntimeMaxUse
Specifies the maximum disk space that can be used in volatile storage (within the /run filesystem).
RuntimeMaxUse=100M
RuntimeKeepFree
Specifies the amount of space to be set aside for other uses when writing data to volatile storage (within the /run filesystem).
RuntimeMaxUse=100M
RuntimeMaxFileSize
Specifies the amount of space that an individual journal file can take up in volatile storage (within the /run filesystem)
before being rotated.
RuntimeMaxFileSize=200M
If you add these values in a running system in /etc/systemd/journald.conf file, then you have to restart the journald
after updating the file. To restart use the following command.
sudo systemctl restart systemd-journald
Verification of log files
It is wiser to check the integrity of the log files after you clean up the files. To do that run the below command. The command
shows the PASS, FAIL against the journal file.
Elastic Stack , commonly abbreviated as ELK , is a popular three-in-one log centralization, parsing, and visualization tool that
centralizes large sets of data and logs from multiple servers into one server.
ELK stack comprises 3 different products:
Logstash
Logstash is a free and open-source
data pipeline that collects logs and events data and even processes and transforms the data to the desired output. Data is sent to
logstash from remote servers using agents called ' beats '. The ' beats ' ship a huge volume of system metrics and logs to Logstash
whereupon they are processed. It then feeds the data to Elasticsearch .
Elasticsearch
Built on Apache Lucene , Elasticsearch is an open-source
and distributed search and analytics engine for nearly all types of data – both structured and unstructured. This includes textual,
numerical, and geospatial data.
It was first released in 2010. Elasticsearch is the central component of the ELK stack and is renowned for its speed, scalability,
and REST APIs. It stores, indexes, and analyzes huge volumes of data passed on from Logstash .
Kibana
Data is finally passed on to Kibana , which is a WebUI visualization
platform that runs alongside Elasticsearch . Kibana allows you to explore and visualize time-series data and logs from elasticsearch.
It visualizes data and logs on intuitive dashboards which take various forms such as bar graphs, pie charts, histograms, etc.
Graylog is yet another popular and powerful centralized log management
tool that comes with both open-source and enterprise plans. It accepts data from clients installed on multiple nodes and, just like
Kibana , visualizes the data on dashboards on a web interface.
Graylogs plays a monumental role in making business decisions touching on user interaction of a web application. It collects vital
analytics on the apps' behavior and visualizes the data on various graphs such as bar graphs, pie charts, and histograms to mention
a few. The data collected inform key business decisions.
For example, you can determine peak hours when customers place orders using your web application. With such insights in hand,
the management can make informed business decisions to scale up revenue.
Unlike Elastic Search , Graylog offers a single-application solution in data collection, parsing, and visualization. It rids the
need for installation of multiple components unlike in ELK stack where you have to install individual components separately. Graylog
collects and stores data in MongoDB which is then visualized on user-friendly and intuitive dashboards.
Graylog is widely used by developers in different phases of app deployment in tracking the state of web applications and obtaining
information such as request times, errors, etc. This helps them to modify the code and boost performance.
3. Fluentd
Written in C, Fluentd is a cross-platform and opensource log monitoring
tool that unifies log and data collection from multiple data sources. It's completely opensource and licensed under the Apache 2.0
license. In addition, there's a subscription model for enterprise use.
Fluentd processes both structured and semi-structured sets of data. It analyzes application logs, events logs, clickstreams and
aims to be a unifying layer between log inputs and outputs of varying types.
It structures data in a JSON format allowing it to seamlessly unify all facets of data logging including the collection, filtering,
parsing, and outputting logs across multiple nodes.
Fluentd comes with a small footprint and is resource-friendly, so you won't have to worry about running out of memory or your
CPU being overutilized. Additionally, it boasts of a flexible plugin architecture where users can take advantage of over 500 community-developed
plugins to extend its functionality.
4. LOGalyze
LOGalyze is a powerful
network monitoring and log management
tool that collects and parses logs from network devices, Linux, and Windows hosts. It was initially commercial but is now completely
free to download and install without any limitations.
LOGalyze is ideal for analyzing server and application logs and presents them in various report formats such as PDF, CSV, and
HTML. It also provides extensive search capabilities and real-time event detection of services across multiple nodes.
Like the aforementioned log monitoring tools, LOGalyze also provides a neat and simple web interface that allows users to log
in and monitor various data sources and
analyze log files .
5. NXlog
NXlog is yet another powerful and versatile tool for log collection and centralization.
It's a multi-platform log management utility that is tailored to pick up policy breaches, identify security risks and analyze issues
in system, application, and server logs.
NXlog has the capability of collating events logs from numerous endpoints in varying formats including Syslog and windows event
logs. It can perform a range of log related tasks such as log rotation, log rewrites. log compression and can also be configured
to send alerts.
You can download NXlog in two editions: The community edition, which is free to download, and use, and the enterprise edition
which is subscription-based.
Logreduce machine learning
model is trained using previous successful job runs to extract anomalies from failed runs'
logs.
This principle can also be applied to other use cases, for example, extracting anomalies
from Journald or other
systemwide regular log files.
Using machine learning to reduce noise
A typical log file contains many nominal events ("baselines") along with a few exceptions
that are relevant to the developer. Baselines may contain random elements such as timestamps or
unique identifiers that are difficult to detect and remove. To remove the baseline events, we
can use a k -nearest neighbors
pattern recognition algorithm ( k -NN).
Log events must be converted to numeric values for k -NN regression. Using the
generic feature extraction tool
HashingVectorizer enables the process to be applied to any type of log. It hashes each word
and encodes each event in a sparse matrix. To further reduce the search space, tokenization
removes known random words, such as dates or IP addresses.
The Logreduce Python software transparently implements this process. Logreduce's initial
goal was to assist with Zuul CI job failure
analyses using the build database, and it is now integrated into the Software Factory development forge's job logs
process.
At its simplest, Logreduce compares files or directories and removes lines that are similar.
Logreduce builds a model for each source file and outputs any of the target's lines whose
distances are above a defined threshold by using the following syntax: distance |
filename:line-number: line-content .
$ logreduce diff / var / log / audit / audit.log.1 /
var / log / audit / audit.log
INFO logreduce.Classifier - Training took 21.982s at 0.364MB / s ( 1.314kl / s ) ( 8.000 MB -
28.884 kilo-lines )
0.244 | audit.log: 19963 : type =USER_AUTH acct = "root" exe = "/usr/bin/su" hostname
=managesf.sftests.com
INFO logreduce.Classifier - Testing took 18.297s at 0.306MB / s ( 1.094kl / s ) ( 5.607 MB -
20.015 kilo-lines )
99.99 % reduction ( from 20015 lines to 1
A more advanced Logreduce use can train a model offline to be reused. Many variants of the
baselines can be used to fit the k -NN search tree.
$ logreduce dir-train audit.clf /
var / log / audit / audit.log. *
INFO logreduce.Classifier - Training took 80.883s at 0.396MB / s ( 1.397kl / s ) ( 32.001 MB -
112.977 kilo-lines )
DEBUG logreduce.Classifier - audit.clf: written
$ logreduce dir-run audit.clf / var / log / audit / audit.log
Logreduce also implements interfaces to discover baselines for Journald time ranges
(days/weeks/months) and Zuul CI job build histories. It can also generate HTML reports that
group anomalies found in multiple files in a simple interface.
The key to using k -NN regression for anomaly detection is to have a database of
known good baselines, which the model uses to detect lines that deviate too far. This method
relies on the baselines containing all nominal events, as anything that isn't found in the
baseline will be reported as anomalous.
CI jobs are great targets for k -NN regression because the job outputs are often
deterministic and previous runs can be automatically used as baselines. Logreduce features Zuul
job roles that can be used as part of a failed job post task in order to issue a concise report
(instead of the full job's logs). This principle can be applied to other cases, as long as
baselines can be constructed in advance. For example, a nominal system's SoS report can be used to find issues in a
defective deployment.
The next version of Logreduce introduces a server mode to offload log processing to an
external service where reports can be further analyzed. It also supports importing existing
reports and requests to analyze a Zuul build. The services run analyses asynchronously and
feature a web interface to adjust scores and remove false positives.
Reviewed reports can be archived as a standalone dataset with the target log files and the
scores for anomalous lines recorded in a flat JSON file.
Project roadmap
Logreduce is already being used effectively, but there are many opportunities for improving
the tool. Plans for the future include:
Curating many annotated anomalies found in log files and producing a public domain
dataset to enable further research. Anomaly detection in log files is a challenging topic,
and having a common dataset to test new models would help identify new solutions.
Reusing the annotated anomalies with the model to refine the distances reported. For
example, when users mark lines as false positives by setting their distance to zero, the
model could reduce the score of those lines in future reports.
Fingerprinting archived anomalies to detect when a new report contains an already known
anomaly. Thus, instead of reporting the anomaly's content, the service could notify the user
that the job hit a known issue. When the issue is fixed, the service could automatically
restart the job.
Supporting more baseline discovery interfaces for targets such as SOS reports, Jenkins
builds, Travis CI, and more.
If you are interested in getting involved in this project, please contact us on the
#log-classify Freenode IRC channel. Feedback is always appreciated!
No longer a simple log-processing pipeline, Logstash has evolved into a powerful and
versatile data processing tool. Here are basics to get you started. 19 Oct 2017 Feed 298
up Image by : Opensource.com x Subscribe now
Get the highlights in your inbox every week.
https://opensource.com/eloqua-embedded-email-capture-block.html?offer_id=70160000000QzXNAA0
Logstash , an open
source tool released by Elastic , is
designed to ingest and transform data. It was originally built to be a log-processing pipeline
to ingest logging data into ElasticSearch . Several versions later, it
can do much more.
At its core, Logstash is a form of Extract-Transform-Load (ETL) pipeline. Unstructured log
data is extracted , filters transform it, and the results are loaded into some form of data
store.
Logstash can take a line of text like this syslog example:
Sep 11 14:13:38 vorthys
sshd[16998]: Received disconnect from 192.0.2.11 port 53730:11: disconnected by user
and transform it into a much richer datastructure:
Depending on what you are using for your backing store, you can find events like this by
using indexed fields rather than grepping terabytes of text. If you're generating tens to
hundreds of gigabytes of logs a day, that matters.
Internal architecture
Logstash has a three-stage pipeline implemented in JRuby:
The input stage plugins extract data. This can be from logfiles, a TCP or UDP listener, one
of several protocol-specific plugins such as syslog or IRC, or even queuing systems such as
Redis, AQMP, or Kafka. This stage tags incoming events with metadata surrounding where the
events came from.
The filter stage plugins transform and enrich the data. This is the stage that produces the
sshd_action and sshd_tuple fields in the example above. This is where
you'll find most of Logstash's value.
The output stage plugins load the processed events into something else, such as
ElasticSearch or another document-database, or a queuing system such as Redis, AQMP, or Kafka.
It can also be configured to communicate with an API. It is also possible to hook up something
like PagerDuty to your Logstash
outputs.
Have a cron job that checks if your backups completed successfully? It can issue an alarm in
the logging stream. This is picked up by an input, and a filter config set up to catch those
events marks it up, allowing a conditional output to know this event is for it. This is how you
can add alarms to scripts that would otherwise need to create their own notification layers, or
that operate on systems that aren't allowed to communicate with the outside
world.
Threads
In general, each input runs in its own thread. The filter and output stages are more
complicated. In Logstash 1.5 through 2.1, the filter stage had a configurable number of
threads, with the output stage occupying a single thread. That changed in Logstash 2.2, when
the filter-stage threads were built to handle the output stage. With one fewer internal queue
to keep track of, throughput improved with Logstash 2.2.
If you're running an older version, it's worth upgrading to at least 2.2. When we moved from
1.5 to 2.2, we saw a 20-25% increase in overall throughput. Logstash also spent less time in
wait states, so we used more of the CPU (47% vs 75%).
Configuring the pipeline
Logstash can take a single file or a directory for its configuration. If a directory is
given, it reads the files in lexical order. This is important, as ordering is significant for
filter plugins (we'll discuss that in more detail later).
Here is a bare Logstash config file:
input { }
filter { }
output { }
Each of these will contain zero or more plugin configurations, and there can be multiple
blocks.
Input config
An input section can look like this:
input {
syslog {
port => 514
type => "syslog_server"
}
}
This tells Logstash to open the syslog
{ } plugin on port 514 and will set the document type for each event coming in
through that plugin to be syslog_server . This plugin follows RFC 3164 only, not
the newer RFC 5424.
Here is a slightly more complex input block:
# Pull in syslog data
input {
file {
path => [
"/var/log/syslog" ,
"/var/log/auth.log"
]
type => "syslog"
}
}
# Pull in application - log data. They emit data in JSON form.
input {
file {
path => [
"/var/log/app/worker_info.log" ,
"/var/log/app/broker_info.log" ,
"/var/log/app/supervisor.log"
]
exclude => "*.gz"
type => "applog"
codec => "json"
}
}
This one uses two different input { } blocks to call different invocations of
the file {
} plugin : One tracks system-level logs, the other tracks application-level logs. By
using two different input { } blocks, a Java thread is spawned for each one. For a
multi-core system, different cores keep track of the configured files; if one thread blocks,
the other will continue to function.
Both of these file { } blocks could be put into the same input { }
block; they would simply run in the same thread -- Logstash doesn't really care.
Filter
config
The filter section is where you transform your data into something that's newer and easier
to work with. Filters can get quite complex. Here are a few examples of filters that accomplish
different goals:
filter {
if [ program ] == "metrics_fetcher" {
mutate {
add_tag => [ 'metrics' ]
}
}
}
In this example, if the program field, populated by the syslog
plugin in the example input at the top, reads metrics_fetcher , then it tags the
event metrics . This tag could be used in a later filter plugin to further enrich
the data.
filter {
if "metrics" in [ tags ] {
kv {
source => "message"
target => "metrics"
}
}
}
This one runs only if metrics is in the list of tags. It then uses the
kv { } plugin to populate a new set of fields based on the
key=value pairs in the message field. These new keys are placed as
sub-fields of the metrics field, allowing the text pages_per_second=42
faults=0 to become metrics.pages_per_second = 42 and metrics.faults =
0 on the event.
Why wouldn't you just put this in the same conditional that set the tag value?
Because there are multiple ways an event could get the metrics tag -- this way,
the kv filter will handle them all.
Because the filters are ordered, being sure that the filter plugin that defines the
metrics tag is run before the conditional that checks for it is important. Here
are guidelines to ensure your filter sections are optimally ordered:
Your early filters should apply as much metadata as possible.
Using the metadata, perform detailed parsing of events.
In your late filters, regularize your data to reduce problems downstream.
Ensure field data types get cast to a unified value. priority could be
boolean, integer, or string.
Some systems, including ElasticSearch, will quietly convert types for you.
Sending strings into a boolean field won't give you the results you want.
Other systems will reject a value outright if it isn't in the right data
type.
The
mutate { } plugin is helpful here, as it has methods to coerce fields
into specific data types.
Here are useful plugins to extract fields from long strings:
date : Many
logging systems emit a timestamp. This plugin parses that timestamp and sets the timestamp of
the event to be that embedded time. By default, the timestamp of the event is when it was
ingested , which could be seconds, hours, or even days later.
kv : As
previously demonstrated, it can turn strings like backup_state=failed
progress=0.24 into fields you can perform operations on.
csv : When
given a list of columns to expect, it can create fields on the event based on comma-separated
values.
json : If a
field is formatted in JSON, this will turn it into fields. Very powerful!
xml : Like
the JSON plugin, this will turn a field containing XML data into new fields.
grok :
This is your regex engine. If you need to translate strings like The accounting
backup failed into something that will pass if [backup_status] ==
'failed' , this will do it.
Elastic would like you to send it all into ElasticSearch, but anything that can accept a
JSON document, or the datastructure it represents, can be an output. Keep in mind that events
can be sent to multiple outputs. Consider this example of metrics:
output {
# Send to the local ElasticSearch port , and rotate the index daily.
elasticsearch {
hosts => [
"localhost" ,
"logelastic.prod.internal"
]
template_name => "logstash"
index => "logstash-{+YYYY.MM.dd}"
}
if "metrics" in [ tags ] {
influxdb {
host => "influx.prod.internal"
db => "logstash"
measurement => "appstats"
# This next bit only works because it is already a hash.
data_points => "%{metrics}"
send_as_tags => [ 'environment' , 'application' ]
}
}
}
Remember the metrics example above? This is how we can output it. The events
tagged metrics will get sent to ElasticSearch in their full event form. In
addition, the subfields under the metrics field on that event will be sent to
influxdb
, in the logstash database, under the appstats measurement. Along
with the measurements, the values of the environment and application
fields will be submitted as indexed tags.
There are a great many outputs. Here are some grouped by type:
API enpoints : Jira, PagerDuty, Rackspace, Redmine, Zabbix
Logreduce machine learning model is trained
using previous successful job runs to extract anomalies from failed runs' logs.
This principle can also be applied to other use cases, for example, extracting anomalies
from Journald or other
systemwide regular log files.
Using machine learning to reduce noise
A typical log file contains many nominal events ("baselines") along with a few exceptions
that are relevant to the developer. Baselines may contain random elements such as timestamps or
unique identifiers that are difficult to detect and remove. To remove the baseline events, we
can use a k -nearest neighbors
pattern recognition algorithm ( k -NN).
Log events must be converted to numeric values for k -NN regression. Using the
generic feature extraction tool
HashingVectorizer enables the process to be applied to any type of log. It hashes each word
and encodes each event in a sparse matrix. To further reduce the search space, tokenization
removes known random words, such as dates or IP addresses.
The Logreduce Python software transparently implements this process. Logreduce's initial
goal was to assist with Zuul CI job failure
analyses using the build database, and it is now integrated into the Software Factory development forge's job logs
process.
At its simplest, Logreduce compares files or directories and removes lines that are similar.
Logreduce builds a model for each source file and outputs any of the target's lines whose
distances are above a defined threshold by using the following syntax: distance |
filename:line-number: line-content .
$ logreduce diff / var / log / audit / audit.log.1 /
var / log / audit / audit.log
INFO logreduce.Classifier - Training took 21.982s at 0.364MB / s ( 1.314kl / s ) ( 8.000 MB -
28.884 kilo-lines )
0.244 | audit.log: 19963 : type =USER_AUTH acct = "root" exe = "/usr/bin/su" hostname
=managesf.sftests.com
INFO logreduce.Classifier - Testing took 18.297s at 0.306MB / s ( 1.094kl / s ) ( 5.607 MB -
20.015 kilo-lines )
99.99 % reduction ( from 20015 lines to 1
A more advanced Logreduce use can train a model offline to be reused. Many variants of the
baselines can be used to fit the k -NN search tree.
$ logreduce dir-train audit.clf
/ var / log / audit / audit.log. *
INFO logreduce.Classifier - Training took 80.883s at 0.396MB / s ( 1.397kl / s ) ( 32.001 MB -
112.977 kilo-lines )
DEBUG logreduce.Classifier - audit.clf: written
$ logreduce dir-run audit.clf / var / log / audit / audit.log
Logreduce also implements interfaces to discover baselines for Journald time ranges
(days/weeks/months) and Zuul CI job build histories. It can also generate HTML reports that
group anomalies found in multiple files in a simple interface.
The key to using k -NN regression for anomaly detection is to have a database of
known good baselines, which the model uses to detect lines that deviate too far. This method
relies on the baselines containing all nominal events, as anything that isn't found in the
baseline will be reported as anomalous.
CI jobs are great targets for k -NN regression because the job outputs are often
deterministic and previous runs can be automatically used as baselines. Logreduce features Zuul
job roles that can be used as part of a failed job post task in order to issue a concise report
(instead of the full job's logs). This principle can be applied to other cases, as long as
baselines can be constructed in advance. For example, a nominal system's SoS report can be used to find issues in a
defective deployment.
The next version of Logreduce introduces a server mode to offload log processing to an
external service where reports can be further analyzed. It also supports importing existing
reports and requests to analyze a Zuul build. The services run analyses asynchronously and
feature a web interface to adjust scores and remove false positives.
Reviewed reports can be archived as a standalone dataset with the target log files and the
scores for anomalous lines recorded in a flat JSON file.
Project roadmap
Logreduce is already being used effectively, but there are many opportunities for improving
the tool. Plans for the future include:
Curating many annotated anomalies found in log files and producing a public domain
dataset to enable further research. Anomaly detection in log files is a challenging topic,
and having a common dataset to test new models would help identify new solutions.
Reusing the annotated anomalies with the model to refine the distances reported. For
example, when users mark lines as false positives by setting their distance to zero, the
model could reduce the score of those lines in future reports.
Fingerprinting archived anomalies to detect when a new report contains an already known
anomaly. Thus, instead of reporting the anomaly's content, the service could notify the user
that the job hit a known issue. When the issue is fixed, the service could automatically
restart the job.
Supporting more baseline discovery interfaces for targets such as SOS reports, Jenkins
builds, Travis CI, and more.
If you are interested in getting involved in this project, please contact us on the
#log-classify Freenode IRC channel. Feedback is always appreciated!
How can I see the content of a log file in real time in Linux? Well there are a lot of utilities
out there that can help a user to output the content of a file while the file is changing or continuously
updating. Some of the most known and heavily used utility to display a file content in real time
in Linux is the
tail command (manage files effectively).
As said, tail command is the most common solution to display a log file in real time. However,
the command to display the file has two versions, as illustrated in the below examples.
In the first example the command tail needs the -f argument to follow the content
of a file.
$ sudo tail -f /var/log/apache2/access.log
Monitor Apache Logs in Real Time
The second version of the command is actually a command itself: tailf . You won't need to use
the -f switch because the command is built-in with the -f argument.
$ sudo tailf /var/log/apache2/access.log
Real Time Apache Logs Monitoring
Usually, the log files are rotated frequently on a Linux server by the logrotate utility. To watch
log files that get rotated on a daily base you can use the -F flag to tail command
The tail -F will keep track if new log file being created and will start following
the new file instead of the old file.
$ sudo tail -F /var/log/apache2/access.log
However, by default, tail command will display the last 10 lines of a file. For instance, if you
want to watch in real time only the last two lines of the log file, use the -n file
combined with the -f flag, as shown in the below example.
$ sudo tail -n2 -f /var/log/apache2/access.log
Watch Last Two Lines of Logs 2. Multitail Command – Monitor Multiple Log Files in Real Time
Another interesting command to display log files in real time is
multitail command
. The name of the command implies that multitail utility can monitor and keep track of multiple files
in real time. Multitail also lets you navigate back and forth in the monitored file.
To install mulitail utility in Debian and RedHat based systems issue the below command.
Multitail Monitor Logs 3. lnav Command – Monitor Multiple Log Files in Real Time
Another interesting command, similar to multitail command is the
lnav
command . Lnav utility can also watch and follow multiple files and display their content in
real time.
To install lnav utility in Debian and RedHat based Linux distributions by issuing the below command.
lnav – Real Time Logs Monitoring 4. less Command – Display Real Time Output of Log Files
Finally, you can display the live output of a file with
less
command if you type Shift+F .
As with tail utility , pressing Shift+F in a opened file in less will start following
the end of the file. Alternatively, you can also start less with less +F flag to enter
to live watching of the file.
$ sudo less +F /var/log/apache2/access.log
Watch Logs Using Less Command
That's It! You may read these following articles on Log monitoring and management.
Inside OSSEC we call log analysis a LIDS, or log-based intrusion detection.
The goal is to detect attacks, misuse or system errors using the logs.
LIDS - Log-based intrusion detection or security log analysis are the processes
or techniques used to detect attacks on a specific network, system or application
using logs as the primary source of information. It is also very useful to detect
software misuse, policy violations and other forms of inappropriate activities.
If you need to search a set of log files in /var/log , some of which have been compressed
with gzip as part of the
logrotate procedure,
it can be a pain to deflate them to check them for a specific string, particularly where you want
to include the current log which isn't compressed:
It turns out to be a little more elegant to use the -c switch for gzip
to deflate the files in-place and write the content of the files to standard output, concatenating
any uncompressed files you may also want to search in with
cat :
$ gzip -dc log.*.gz | cat - log | grep pattern
This and similar operations with compressed files are common enough problems that short scripts
in /bin on GNU/Linux systems exist, providing analogues to existing tools that can work
with files in both a compressed and uncompressed state. In this case, the
zgrep tool is of the most
use to us:
$ zgrep pattern log*
Note that this search will also include the uncompressed log file and search it normally.
The tools are for possibly compressed files, which makes them particularly well-suited to
searching and manipulating logs in mixed compression states. It's worth noting that most of these
are actually reasonably simple shell scripts.
The complete list of tools, most of which do the same thing as their z-less equivalents, can be
gleaned with a quick whatis call:
$ pwd
/bin
$ whatis z*
zcat (1)   - compress or expand files
zcmp (1)   - compare compressed files
zdiff (1)  - compare compressed files
zegrep (1) - search possibly compressed files for a regular expression
zfgrep (1) - search possibly compressed files for a regular expression
zforce (1) - force a '.gz' extension on all gzip files
zgrep (1)  - search possibly compressed files for a regular expression
zless (1)  - file perusal filter for crt viewing of compressed text
zmore (1)  - file perusal filter for crt viewing of compressed text
znew (1)   - recompress .Z files to .gz files
Since the disclosures by WikiLeaks in 2010, the Pentagon has taken steps
to better protect its classified networks.
It has banned the use of thumb drives
unless special permission is given, mandated that users have special smart cards
that authenticate their identities and required analysts to review computer
logs to identify suspicious behavior on the network.
In a lively discussion at the
RedHat offices two weeks ago in Brno, a number of well respected individuals
were discussing how logging in general, and Linux logging in particular could
be improved. As you may have guessed I was invited because of syslog-ng, but
representatives of other logging related projects were also in nice numbers:
Steve Grubb (auditd), Lennart Poettering (systemd, journald), Rainer Gerhards
(rsyslog), William Heinbockel (CEE, Mitre) and a number of nice people from
the RedHat team.
We discussed a couple of pain points for logging, logging
is usually an afterthought during development, computer based processing, correlation
of application logs is nearly impossible. We roughly agreed that the key to
improve the situation is to involve the community at large, initiate a momentum
and try to get application developers on board and have them create structured
logs. We also agreed that this will not happen overnight and we need to take
a gradual approach.
To move into that direction, the benefits of good logging needs to be communicated
and delivered to both application developers and their users.
We also talked about what kind of building blocks are needed to deliver a
solution fast, and concluded that we basically have everything available, and
even better they are open source. The key is to tie these components together,
document best practices and perhaps provide better integration.
some applications already produce logs in structured format, those should
be integrated (auditd for instance)
we need to define a mechanism to submit structured logs to local logging
services for further processing (ELAPI and some enhanced syslog)
we need to make sure that local logging services cope with structured
data (already available for a long time now)
we need to define a mechanism to store messages in a structured form
and a way query them
last, but not least we need to define a naming scheme for event data
which CEE can bring to the table
Most of these is already possible by using a combination of tools and proper
configuration, however learning how to do this is not a trivial undertaking
for those who only want to develop or use applications.
Changing that is the primary aim of
Project Lumberjack. If you are interested in logging, make sure to check
that out.
In syslog-ng 3.0 a new message-parsing and classifying feature (dubbed pattern
database or patterndb) was introduced. With recent improvements in 3.1 and the increasing
demand for processing and analyzing log messages, a look at the syslog-ng capabilities
is warranted.
The nine-year-old syslog-ng project is a popular, alternative syslog daemon
- licensed under GPLv2 - that has established its name with reliable message
transfer and flexible message filtering and sorting capabilities. In that time
it has gained many new features including the direct logging to SQL databases,
TLS-encrypted message transport, and the ability to parse and modify the content
of log messages. The SUSE and openSUSE distributions use syslog-ng as their
default syslog daemon.
In syslog-ng 3.0 a new message-parsing and classifying feature (dubbed pattern
database or patterndb) was introduced. With recent improvements in 3.1 and the
increasing demand for processing and analyzing log messages, a look at the syslog-ng
capabilities is warranted.
The main task of a central syslog-ng log server is to collect the messages
sent by the clients and route the messages to their appropriate destinations
depending on the information received in the header of the syslog message or
within the log message itself. Using various filters, it is possible to build
even complex, tree-like log routes. For example:
It is equally simple to modify the messages by using rewrite rules instead
of filters if needed. Rewrite rules can do simple search-and-replace, but can
also set a field of the message to a specific value: this comes handy when client
does not properly format its log messages to comply with the syslog RFCs. (This
is surprisingly common with routers and switches.) Version 3.1 of makes it possible
to rewrite the structured data elements in messages that use the latest syslog
message format (RFC5424).
Artificial ignorance
Classifying and identifying log messages has many uses. It can be useful
for reporting and compliance, but can be also important from the security and
system maintenance point of view. The syslog-ng pattern database is also advantageous
if you are using the "artificial ignorance" log processing method, which was
described by
Marcus
J. Ranum (MJR):
Artificial Ignorance - a process whereby you throw away the log entries
you know aren't interesting. If there's anything left after you've thrown
away the stuff you know isn't interesting, then the leftovers must be interesting.
Artificial ignorance is a method to detect the anomalies in a working system.
In log analysis, this means recognizing and ignoring the regular, common log
messages that result from the normal operation of the system, and therefore
are not too interesting. However, new messages that have not appeared in the
logs before can signify important events, and should therefore be investigated.
The syslog-ng pattern database
The syslog-ng application can compare the contents of the received log messages
to a set of predefined message patterns. That way, syslog-ng is able to identify
the exact log message and assign a class to the message that describes the event
that has triggered the log message. By default, syslog-ng uses the unknown,
system, security, and violation classes, but this can be customized, and further
tags can be also assigned to the identified messages.
The traditional approach to identify log messages is to use regular expressions
(as the logcheck project does for example).
The syslog-ng pattern database uses
radix trees for this task,
and that has the following important advantages:
Classifying messages is fast, much faster than with methods based on
regular expressions. The speed of processing a message is practically independent
from the total number of patterns. What matters is the length of the message
and the number of "similar" messages, as this affects the number of junctions
in the radix tree.
Regular-expression based methods become increasingly slower as the number
of patterns increases. Radix trees scale very well, because only a relatively
small number of simple comparisons must be performed to parse the messages.
The syslog-ng message patterns are easy to write, understand, and maintain.
For example, compare the following:
A log message from an OpenSSH server:
Accepted password for joe from 10.50.0.247 port 42156 ssh2
A regular expression that describes this log message and its variants:
    Accepted \
        (gssapi(-with-mic|-keyex)?|rsa|dsa|password|publickey|keyboard-interactive/pam) \
        for [^[:space:]]+ from [^[:space:]]+ port [0-9]+( (ssh|ssh2))?
An equivalent pattern for the syslog-ng pattern database:
    Accepted @QSTRING:auth_method: @ for @QSTRING:username: @ from \
        @QSTRING:client_addr: @ port @NUMBER:port:@ @QSTRING:protocol_version: @
Obviously, log messages describing the same event can be different: they
can contain data that varies from message to message, like usernames, IP addresses,
timestamps, and so on. This is what makes parsing log messages with regular
expressions so difficult. In syslog-ng, these parts of the messages can be covered
with special fields called parsers, which are the constructs between '@' in
the example. Such parsers process a specific type of data like a string (@STRING@),
a number (@NUMBER@ or @FLOAT@), or IP address (@IPV4@,
@IPV6@, or @IPVANY@). Also, parsers can be given a name and
referenced in filters or as a macro in the names of log files or database tables.
It is also possible to parse the message until a specific ending character
or string using the @ESTRING@ parser, or the text between two custom
characters with the @QSTRING@ parser.
A syslog-ng pattern database is an XML file that
stores patterns and various metadata about the patterns. The
message patterns are sample messages that are used to identify the incoming
messages; while metadata can include descriptions, custom tags, a message class
- which is just a special type of tag - and name-value pairs (which are yet
another type of tags).
The syslog-ng application has built-in macros for using the results of the
classification: the .classifier.class macro contains the class assigned
to the message (e.g., violation, security, or unknown) and the .classifier.rule_id
macro contains the identifier of the message pattern that matched the message.
It is also possible to filter on the tags assigned to a message. As with syslog,
these routing rules are specified in the syslog-ng.conf file.
Using syslog-ng
In order to use these features, get syslog-ng 3.1 - older versions use an
earlier and less complete database format. As most distributions still package
version 2.x, you will probably have to download it from the
syslog-ng download page.
The syntax of the pattern database file might seem a bit intimidating at
first, but most of the elements are optional. Check
The syslog-ng 3.1 Administrator Guide [PDF] and the
sample
database files to start with, and write to the mailing list if you run into
problems.
A small utility called pdbtool is available in syslog-ng 3.1 to help the
testing and management of pattern databases. It allows you to quickly check
if a particular log message is recognized by the database, and also to merge
the XML files into a single XML for syslog-ng. See pdbtool --help for
details.
Closing remarks
The syslog-ng pattern database provides a powerful framework for classifying
messages, but it is powerless without the message patterns that make it work.
IT systems consist of several components running many applications, which means
a lot of message patterns to create. This clearly calls for community
effort to create a critical mass of patterns where all this becomes usable.
To start with, BalaBit - the developer of syslog-ng - has made a number of
experimental
pattern databases available. Currently, these files contain over 8000 patterns
for over 200 applications and devices, including Apache, Postfix, Snort, and
various common firewall appliances. The syslog-ng pattern databases are freely
available for use under the terms of the Creative Commons Attribution-Noncommercial-Share
Alike 3.0 (CC by-NC-SA) license.
MultiTail lets you view one or multiple files like the original tail program.
The difference is that it creates multiple windows on your console (with ncurses).
It can also monitor wildcards: if another file matching the wildcard has a more
recent modification date, it will automatically switch to that file. That way
you can, for example, monitor a complete directory of files. Merging of 2 or
even more logfiles is possible. It can also use colors while displaying the
logfiles (through regular expressions), for faster recognition of what is important
and what not. It can also filter lines (again with regular expressions). It
has interactive menus for editing given regular expressions and deleting and
adding windows. One can also have windows with the output of shell scripts and
other software.
When viewing the output of external software, MultiTail can mimic the functionality
of tools like 'watch' and such.
For a complete list of features, look
here.
Summary: Monitoring system logs or the status of a command that
produces file or directory output are common tasks for systems administrators.
Two popular open source tools simplify these activities for modern systems administrators:
the multitail and watch commands. Both are terminal-oriented
commands, which means that they are easily ported to most UNIX® or UNIX-like
systems because they do not depend on any specific graphical desktop environment.
Perl-based log analyzer with some interesting capabilities.
Kazimir is a log analyzer. It has a complete configuration file used to describe
what kind of logs (or non-regression test) to be watched or spawned and the
kind of regexp to be found in them. Interesting information found in logs may
be associated with "events" in a boolean and chronological way. The occurrence
of events may be associated with the execution of commands.
FSHeal aims to be a general filesystem tool that can scan and report vital
"defective" information about the filesystem like broken symlinks, forgotten
backup files, and left-over object files, but also source files, documentation
files, user documents, and so on. It will scan the filesystem without modifying
anything and reporting all the data to a logfile specified by the user which
can then be reviewed and actions taken accordingly.
About: Skulker is a rules-based tool for log and temporary file management.
It offers a wide range of facilities to help manage disk space, including compression,
deletion, rotation, archiving, and directory reorganization. It provides dry-run
facilities to test new rules, as well as detailed space reclaimed reporting.
Changes: The pattern match limit functionality that allows a particular
rule to limit the number of files processed in any one invocation had a bug
when using negative numbers. This has now been resolved and works as per the
documentation.
Adapters created using the Generic Log Adapter framework can be used for
building log parsers for the Log and Trace Analyzer. The following adapter configuration
files are provided as examples for creating rules-based adapters and static
adapters.
log4sh is a logging framework for shell scripts that works similar to the other
wonderful logging products available from the Apache Software Foundataion (eg.
log4j, log4perl). Although not as powerful as the others, it can make the task
of adding advanced logging to shell scripts easier, and has much more power
than just using simple "echo" commands throughout. In addition, it can be configured
from a properties file so that scripts in a production environment do not need
to be altered to change the amount of logging they produce.
Release focus: Major feature enhancements
Changes:
This release finally flushes out nearly all of the planned features for the
1.3 development series. It will hopefully be the last release in the 1.3 series
before moving to the 1.4/1.5 series. In this release, the SyslogAppender is
now fully functional, several bugs have been fixed, and there are additional
unit tests to verify functionality. There is also a new Advanced Usage section
in the documentation.
Frequently, it is useful for security professionals, network administrators
and end users alike to monitor the logs that various programs in the system
write for specific events -- for instance, recurring login failures that might
indicate a brute-force attack. Doing this manually would be a daunting, if not
infeasible, task. A tool to automate log monitoring and event correlation can
prove to be invaluable in sifting through continuously-generated logs.
The
Simple Event Correlator (SEC) is a Perl script that implements an event
correlator. You can use it to scan through log files of any type and pick out
events that you want to report on. Tools like logwatch can do much the same
thing, but what sets SEC apart is its ability to generate and store contexts.
A context is an arbitrary set of things that describe a particular event. Since
SEC is able to essentially remember (and even forget) these contexts, the level
of noise generated is remarkably low, and even a large amount of input can be
handled by a relatively small number of rules.
Looking for root login attempts
For instance, let's start with something basic, like looking for direct ssh
root logins to a machine (security best practice is to completely not allow
such logins, but let's not follow that for the sake of this example):
   Feb  1 11:54:48 192.168.22.1 sshd[20994]: [ID 800047 auth.info] Accepted publickey for root
     from 192.168.15.3 port 33890 ssh2
Ok, so we can create an SEC configuration file (let's call it root.conf)
that contains the following:
   type=Single
   ptype=RegExp
   pattern=(^.+\d+ \d+:\d+:\d+) (\d+\.\d+\.\d+\.\d+) sshd\[\d+\]: \[.+\] Accepted (.+) for root
     from (\d+\.\d+\.\d+\.\d+)
   desc=direct ssh root login on $2 from $4 (via $3) @ $1
   action=add root-ssh_$2 $0; report root-ssh_$2 /usr/bin/mail -s "Direct root login on $2 from $4"
     [email protected]
This is an example of a rule in SEC. The first line describes the type, in
this case, "Single" which tells SEC that we just want to deal with single instances
of this event. The second line, ptype, tells SEC how we want to search for patterns.
In this case we've chosen "RegExp" which says to use Perl's powerful regular
expression engine. We can choose other types of matches, such as substring matches,
tell the rule the utilize a Perl function or module, or tell it to look at the
contents of a variable you can set.
The next line in this rule, the pattern in this case, is a big regular expression
(regex) that would match on log entries where someone is logging in directly
as root. We've grouped the timestamp, the IPs for both the source and destination
and the method used to login for us to use later in an email. (If you're familiar
with Perl, you can see SEC uses a similar regex grouping.)
The next line is the description of this rule. The final line is the action
we intend to take. In this case, we add the entire log entry to a context called
root-ssh_$2, where $2 will expand out to be the IP address of the machine being
logged into. Finally, the rule will send mail out to [email protected] with the
contents of the context, which will include the matching log entry.
Say this rule chugs away and sends you e-mail every morning at 5am when your
cron job from some machine logs into another machine (as root!) to run backups.
You don't want to get email every morning, so we can suppress those using the
aptly named suppress rule type. To do that, we insert the following rule above
our existing "look for root logins" rule:
   type=Suppress
   ptype=RegExp
   pattern=^.+\d+ \d+:\d+:\d+ \d+\.\d+\.\d+\.\d+ sshd\[\d+\]: \[.+\] Accepted .+ for root from 192.168.55.89
Then we can send SIGABRT to the sec process we started previously:
which will tell that SEC process to reread its configuration file and continue.
Looking for brute force attacks
Now let's look at using SEC to watch for a brute force attack via ssh:
   # create the context on the initial triggering cluster of events
   type=SingleWithThreshold
   ptype=RegExp
   pattern=(^.+\d+ \d+:\d+:\d+) (\d+\.\d+\.\d+\.\d+) sshd\[\d+\]: \[.+\] Failed (.+)
     for (.*?) from (\d+\.\d+\.\d+\.\d+)
   desc=Possible brute force attack (ssh) user $4 on $2 from $5
   window=60
   thresh=5
   context=!SSH_BRUTE_FROM_$5
   action=create SSH_BRUTE_FROM_$5 60 (report SSH_BRUTE_FROM_$5 /usr/bin/mail -s
     "ssh brute force attack on $2 from $5" [email protected]); add SSH_BRUTE_FROM_$5
     5 failed ssh attempts within 60 seconds detected; add SSH_BRUTE_FROM_$5 $0
   # add subsequent events to the context
   type=Single
   ptype=RegExp
   pattern=(^.+\d+ \d+:\d+:\d+) (\d+\.\d+\.\d+\.\d+) sshd\[\d+\]: \[.+\] Failed (.+)
     for (.*?) from (\d+\.\d+\.\d+\.\d+)
   desc=Possible brute force attack (ssh) user $4 on $2 from $5
   context=SSH_BRUTE_FROM_$5
   action=add SSH_BRUTE_FROM_$5 "Additional event: $0"; set SSH_BRUTE_FROM_$5 30
This actually specifies two rules. The first is another rule type within
SEC: SingleWithThreshold. It adds two more options to the Single rule we used
above: window and thresh. Window is the times pan this rule should be looking
over and thresh is the threshold for number of events that need to appear within
the window to trigger the action in this rule. We're also using the context
option, which tells this rule to trigger only if the context doesn't exist.
The rule will trigger if it matches 5 failed login events within 60 seconds.
The action line creates the context ($5 representing the IP of the attacker)
which expires in 60 seconds. Upon expiration it sends out an e-mail with a description
and the matching log entries. The second rule adds additional events to the
context, and extends the context's lifetime by 30 seconds, as long as the context
already exists; otherwise it does nothing.
The flexibility of SEC
The creation and handling of these contexts which are created dynamically
lies at the heart of SEC's power and what set it apart from other "log watcher"
style programs.
For example, a printer having a paper jam may issue a lot of incessant log
messages until someone gets over to the printer to deal with it, and if a log
watcher was set to send an e-mail every time it matched on the paper jam message,
that's a lot of e-mail, most of which will get deleted. It would be worse if
it was an e-mail to a pager. SEC can create a context stating, "I've seen a
paper jam event and have already sent out a page," which the rule can check
for in the future and suppress further e-mails if the context already exists.
Another good example of this is
included with SEC, a simple horizontal portscan detector, which will trigger
an alarm if 10 hosts have been scanned within 60 seconds, which has been traditionally
a difficult thing to detect well.
John P. Rouillard has an extensive paper in which he demonstrates much of
the power of SEC's contexts and we highly recommend reading it for much more
of the gory details on log monitoring in general and SEC in particular.
In addition to contexts, SEC also includes some handy rule types beyond what
we've shown so far (from the sec manual page):
SingleWithScript - match input event and depending on the exit value
of an external script, execute an action.
SingleWithSuppress - match input event and execute an action immediately,
but ignore following matching events for the next t seconds.
Pair - match input event, execute an action immediately, and ignore following
matching events until some other input event arrives. On the arrival of
the second event execute another action.
PairWithWindow - match input event and wait for t seconds for other input
event to arrive. If that event is not observed within a given time window,
execute an action. If the event arrives on time, execute another action.
SingleWith2Thresholds - count matching input events during t1 seconds
and if a given threshold is exceeded, execute an action. Then start the
counting of matching events again and if their number per t2 seconds drops
below the second threshold, execute another action.
Calendar - execute an action at specific times.
The Calendar rule type, for instance, allows us to look for the absence
of a particular event (e.g. a nightly backup being kicked off). Or, you can
use it to create a particular contexts, like this example from the SEC man page:
This way, you can have your other rules check to see if this context is active
and take different actions at night versus during the day.
More examples
Let's say we want to analyze Oracle database TNS-listener logs. Specifically,
we want to find people logging into the database as one of the superuser accounts
(SYSTEM, SYS, etc), which is a Bad Thing (tm):
In my environment, we chop up the listener logs everyday and we run the following
rules on each day's log:
   type=Single
   ptype=RegExp
   pattern=^(\d{2}-\p{IsAlpha}{3}-\d{4} \d{1,2}:\d{1,2}:\d{1,2}).*CID=\((.*)\)\(HOST=(.*)\)\
     (USER=(SYSTEM|INTERNAL|SYS).*HOST=(\d+.\d+.\d+.\d+).*
   desc=$4 login on $5 @ $1 from $3 ($2)
   action=add $4_login $0; create FOUND_VIOLATIONS
   #
   type=Single
   ptype=substr
   pattern=SEC_SHUTDOWN
   context=SEC_INTERNAL_EVENT && FOUND_VIOLATIONS
   desc=Write all contexts to stdout
   action=eval %o ( use Mail::Mailer; my $mailer = new Mail::Mailer; \
   $mailer->open({ From => "root\@syslog", \
				To => "admin\@example.com", \
				Subject => "SYSTEM Logins Found",}) or die "Can't open: $!\n";\
   while($context = each(%main::context_list)) { \
	print $mailer "Context name: $context\n"; \
	print $mailer '-' x 60, "\n"; \
	foreach $line (@{$main::context_list{$context}->{"Buffer"}}) { \
	print $mailer $line, "\n"; \
	} \
	print $mailer '=' x 60, "\n"; \
   } \
   $mailer->close();)
We run this configuration using the following Perl script that will pick
out today's logfile to parse:
   #!/usr/bin/perl
   use strict;
   use Date::Manip;
   my $filedate = ParseDate("yesterday");
   my $fileprefix = UnixDate($filedate, "%Y-%m-%d");
   my $logdir = "/var/log/oracle-listener";
   opendir(LOGDIR, $logdir) or die "Cannot open $logdir! $!\n";
   my @todaysfiles = grep /$fileprefix/, readdir LOGDIR;
   if (scalar(@todaysfiles) > 1 ) { print "More than one file matches for today\n"; }
   closedir LOGDIR;
   foreach (@todaysfiles) {
    my $secout = `sec -conf=/home/tmurase/sec/oracle.conf -intevents
     -cleantime=300 -input=$logdir/$_ -fromstart -notail`;
       print $secout, "\n";
   }
The Perl script invokes SEC with the -intevents flag which generates internal
events that we can catch with SEC rules. In this case, we wish to catch that
SEC will shutdown after it finishes parsing the file. Another option, -cleantime=300
gives us 5 minutes of grace time before the SEC process terminates.
Here we are using the first rule to simply add events to an automatically
named context, much as we did above, and creating the context FOUND_VIOLATIONS
as a flag for the next rule to evaluate. The second rule will check for the
existence of FOUND_VIOLATIONS and the SEC_INTERNAL_EVENT context which is raised
during the shutdown sequence, and we look for the SEC_SHUTDOWN event come across
input using a simple substring pattern. (This technique of dumping out all contexts
before shutdown is pulled from SEC FAQ 3.23.)
As you can see, the action line of the second rule has a lot going on. What
we're doing is calling a small Perl script from within SEC that will generate
an email with all of the database access violations the first rule collected.
Another thing that we often wish to monitor closely are the nightly backups.
Namely, we want to make sure they've actually started, and that they actually
managed to finish.
Say that a successful run looks like this in the logs:
An unsuccessful run would be, for our purposes, the absence of these two
log entries. We can kick off a Calendar rule to set a context that indicates
we are waiting for the first log entry to show up:
Here we create the context "Wait4Backup" and set it to expire at 55 minutes
after midnight, whereupon it executes a shell script that will presumably do
some cleanup actions and notifications. The time parameter for the calendar
rule uses a crontab-esque format with ranges and lists of numbers allowed.
We'll want to delete the Wait4Backup context and create a new context when
the log entry for the start of the backup shows up:
The first rule takes care of what to do when it does finish successfully.
The latter takes care of what happens when the backup script has errors. With
these four rules, we have SEC covering the various possible states of our simple
backup script, catching even the absence of the script starting on time.
Go forth and watch logs!
SEC is a powerful tool that builds on simple statements to handle the type
of application monitoring and log monitoring that rivals commercial tools such
as Tivoli or HP Openview. It does not have a GUI frontend or convenient reports,
however, so a little more time must be spent on generating and formatting output
of SEC's information. For those looking for more examples, a new rules collection
has been started up at
http://www.bleedingsnort.com/sec/.
The
Simple Event Correlator (SEC) is a Perl script that implements an event correlator.
You can use it to scan through log files of any type and pick out events that you
want to report on. Tools like logwatch can do much the same thing, but what sets
SEC apart is its ability to generate and store contexts. A context is an arbitrary
set of things that describe a particular event. Since SEC is able to essentially
remember (and even forget) these contexts, the level of noise generated is remarkably
low, and even a large amount of input can be handled by a relatively small number
of rules.
Event logging and event log monitoring
Event correlation – concept and existing solutions
This tool is amazing in that it supports a variety input and output formats
including reading in syslog and outputting into databases are pretty Excel charts.
The filtering uses an SQL syntax. The tool comes with a DLL that can be registered,
so that scripters (VBScript, Perl, JScript, etc.) can access the power of this
tool.
This book not only covers the tool (alternative being to scrape the network
for complex incomprehensible snippets), but shows real world practical solutions
with the tool, from analyzing web logs, system events, security and network
scans, etc.
This tool is just heavensend for analysis and transforming of any data in a
variety of formats. The book and tool go hand-in-hand, and I highly recommend
incorporating this into your tool (and book) into your tool kit and/or scripting
endeavors immediately.
[Feb 20, 2007] NIST Guide to Computer Security Log Management, September 2006
Adobe .pdf
(1,909 KB)
syslog-ng is an alternative system logging tool, a replacement
for the standard Unix syslogd system-event logging application. Featuring reliable logging to remote servers via the TCP network
protocol, availability on many platforms and architectures, and high-level message filtering capabilities, syslog-ng is part of several
Linux distributions. We discussed the highlights of last month's version 2.0 release with the developer, Balázs Scheidler.
NewsForge: How and why did you start the project?
Balázs Scheidler: Back in 1998 the main Hungarian telecommunication company was looking for someone on a local
Linux mailing list to port nsyslog to Linux. nsyslog -- developed by Darren Reed -- was at that time incomplete, somewhat buggy,
and available only for BSD. While at university, I had been working for an ISP and got often annoyed with syslogd: it creates too
many files, it is difficult to find and move the important information, and so on. Developing a better syslog application was a fitting
task for me.
NF: Why is it called syslog-ng?
BS: syslog-ng 1.0 was largely based on nsyslog, but nsyslog did not have a real license. I wanted to release
the port under GPL, but Darren permitted this only if I renamed the application.
NF: What kind of support is available for the users?
BS: There is a community FAQ and an active
mailing list. If you are stuck with the compiling
or the configuration, the mailing list is the best place to find help. My company,
BalaBit IT Security, offers commercial support for those who need quick support.
NF: Documentation?
BS: The
reference guide is
mostly up-to-date, but I hope to improve it someday. I am sure there are several howtos floating around on the Internet.
NF: Who uses syslog-ng?
BS: Everyone who takes logging a bit more seriously. I know about people who use it on single workstations, and
about companies that manage the centralized logging of several thousand devices with syslog-ng. We have support contracts even with
Fortune 500 companies.
NF: What's new in version 2.0?
BS: 1.6 did not have any big problems, only smaller nuances. 2.0 was rewritten from scratch to create a better
base for future development and to address small issues. For example, the data structures were optimized, greatly reducing the CPU
usage. I have received feedback from a large log center that the new version uses 50% less CPU under the same load.
Every log message may include a timezone. syslog-ng can convert between different timestamps if needed.
It can read and forward logfiles. If an application logs into a file, syslog-ng can read this file and transfer the messages to
a remote logcenter.
2.0 supports the IPv6 network protocol, and can also send and receive messages to multicast IP addresses.
It is also possible to include hostnames in the logs without having to use a domain name server. Using a DNS would seriously limit
the processing speed in high-traffic environments and requires a network connection. Now you can create a file similar to /etc/hosts
that syslog-ng uses to resolve the frequently used IP addresses to hostnames. That makes the logs much easier to read.
syslog-ng 2.0 uses active flow control to prevent message losses. This means that if the output side of syslog-ng is accepting
messages slowly, then syslog-ng will wait a bit more between reading messages from the input side. That way the receiver is not flooded
with messages it could not process on time, and no messages are lost.
NF: Is syslog-ng available only for Linux, or are other platforms also supported?
BS: It can be compiled for any type of Unix -- it runs on BSD, Solaris, HP-UX, AIX, and probably some others
as well. Most bigger Linux distributions have syslog-ng packages: Debian, SUSE, Gentoo.... I think Gentoo installs it by default,
replacing syslogd entirely.
NF: What other projects do you work on?
BS: syslog-ng is a hobby for me; that is why it took almost five years to finish version 2.0. My main project
is Zorp, an application-level proxy firewall developed by my company. Recently I have been working on an appliance that can transparently
proxy and audit the Secure Shell (SSH) protocol.
During development I stumble into many bugs and difficulties, so I have submitted patches to many places, such as glib and the
tproxy kernel module.
NF: Are these projects also open source?
BS: No, these are commercial products, but the Zorp firewall does have a GPL version.
NF: Any plans for future syslog-ng features?
BS: I plan to support the syslog protocol that is being developed by IETF.
I would like to add disk-based buffering, so you could configure syslog-ng to log into a file if the network connection goes down,
and transmit the messages from the file when the network becomes available again.
It would be also good to transfer the messages securely via TLS, and to have application-layer acknowledgments on the protocol
level.
December 13, 2006 (Linux.com
) syslog-ng
is an alternative system logging tool, a replacement for the standard Unix syslogd
system-event logging application. Featuring reliable logging to remote servers
via the TCP network protocol, availability on many platforms and architectures,
and high-level message filtering capabilities, syslog-ng is part of several
Linux distributions. We discussed the highlights of last month's version 2.0
release with the developer, Balázs Scheidler.
NewsForge: How and why did you start the project?
Balázs Scheidler: Back in 1998 the main Hungarian telecommunication
company was looking for someone on a local Linux mailing list to port nsyslog
to Linux. nsyslog -- developed by Darren Reed -- was at that time incomplete,
somewhat buggy, and available only for BSD. While at university, I had been
working for an ISP and got often annoyed with syslogd: it creates too many files,
it is difficult to find and move the important information, and so on. Developing
a better syslog application was a fitting task for me.
NF: Why is it called syslog-ng?
BS: syslog-ng 1.0 was largely based on nsyslog, but nsyslog
did not have a real license. I wanted to release the port under GPL, but Darren
permitted this only if I renamed the application.
NF: What kind of support is available for the users?
BS: There is a
community
FAQ and an active
mailing list.
If you are stuck with the compiling or the configuration, the mailing list is
the best place to find help. My company,
BalaBit IT Security, offers
commercial support for those who need quick support.
NF: Documentation?
BS: The
reference guide is mostly up-to-date, but I hope to improve it someday.
I am sure there are several howtos floating around on the Internet.
NF: Who uses syslog-ng?
BS: Everyone who takes logging a bit more seriously. I know
about people who use it on single workstations, and about companies that manage
the centralized logging of several thousand devices with syslog-ng. We have
support contracts even with Fortune 500 companies.
NF: What's new in version 2.0?
BS: 1.6 did not have any big problems, only smaller nuances.
2.0 was rewritten from scratch to create a better base for future development
and to address small issues. For example, the data structures were optimized,
greatly reducing the CPU usage. I have received feedback from a large log center
that the new version uses 50% less CPU under the same load.
Every log message may include a timezone. syslog-ng can convert between different
timestamps if needed.
It can read and forward logfiles. If an application logs into a file, syslog-ng
can read this file and transfer the messages to a remote logcenter.
2.0 supports the IPv6 network protocol, and can also send and receive messages
to multicast IP addresses.
It is also possible to include hostnames in the logs without having to use
a domain name server. Using a DNS would seriously limit the processing speed
in high-traffic environments and requires a network connection. Now you can
create a file similar to /etc/hosts that syslog-ng uses to resolve the frequently
used IP addresses to hostnames. That makes the logs much easier to read.
syslog-ng 2.0 uses active flow control to prevent message losses. This means
that if the output side of syslog-ng is accepting messages slowly, then syslog-ng
will wait a bit more between reading messages from the input side. That way
the receiver is not flooded with messages it could not process on time, and
no messages are lost.
NF: Is syslog-ng available only for Linux, or are other
platforms also supported?
BS: It can be compiled for any type of Unix -- it runs on
BSD, Solaris, HP-UX, AIX, and probably some others as well. Most bigger Linux
distributions have syslog-ng packages: Debian, SUSE, Gentoo.... I think Gentoo
installs it by default, replacing syslogd entirely.
NF: What other projects do you work on?
BS: syslog-ng is a hobby for me; that is why it took almost
five years to finish version 2.0. My main project is Zorp, an application-level
proxy firewall developed by my company. Recently I have been working on an appliance
that can transparently proxy and audit the Secure Shell (SSH) protocol.
During development I stumble into many bugs and difficulties, so I have submitted
patches to many places, such as glib and the tproxy kernel module.
NF: Are these projects also open source?
BS: No, these are commercial products, but the Zorp firewall
does have a GPL version.
NF: Any plans for future syslog-ng features?
BS: I plan to support the syslog protocol that is being
developed by IETF.
I would like to add disk-based buffering, so you could configure syslog-ng
to log into a file if the network connection goes down, and transmit the messages
from the file when the network becomes available again.
It would be also good to transfer the messages securely via TLS, and to have
application-layer acknowledgments on the protocol level.
October 21, 2004 (Computerworld) --
As the IT market grows, organizations are deploying more security solutions
to guard against the ever-widening threat landscape. All those devices are known
to generate copious amounts of audit records and alerts, and many organizations
are setting up repeatable log collection and analysis processes.
However, when planning and implementing log collection and analysis infrastructure,
the organizations often discover that they aren't realizing the full promise
of such a system. This happens due to some common log-analysis mistakes.
This article covers the typical mistakes organizations make when analyzing audit
logs and other security-related records produced by security infrastructure
components. No. 1: Not looking at the logs
Let's start with an obvious but critical one. While collecting and storing logs
is important, it's only a means to an end -- knowing what 's going on in your
environment and responding to it. Thus, once technology is in place and logs
are collected, there needs to be a process of ongoing monitoring and review
that hooks into actions and possible escalation.
It's worthwhile to note that some organizations take a half-step in the right
direction: They review logs only after a major incident. This gives them the
reactive benefit of log analysis but fails to realize the proactive one -- knowing
when bad stuff is about to happen.
Looking at logs proactively helps organizations better realize the value of
their security infrastructures. For example, many complain that their network
intrusion-detection systems (NIDS) don't give them their money's worth. A big
reason for that is that such systems often produce false alarms, which leads
to decreased reliability of their output and an inability to act on it. Comprehensive
correlation of NIDS logs with other records such as firewalls logs and server
audit trails as well as vulnerability and network service information about
the target allow companies to "make NIDS perform" and gain new detection capabilities.
Some organizations also have to look at log files and audit tracks due to regulatory
pressure. No. 2: Storing logs for too short a time
This makes the security team think they have all the logs needed for monitoring
and investigation (while saving money on storage hardware) and then leading
to the horrible realization after the incident that all logs are gone due to
its retention policy. The incident is often discovered a long time after the
crime or abuse has been committed.
If cost is critical, the solution is to split the retention into two parts:
short-term online storage and long-term off-line storage.
Looking at logging output in an enterprise environment can be very
difficult. To make this really useful you need to aggregate information in a
central repository, from all different servers/apps running on many machines.
For true heavy duty log analysis you need to resort to tools such as
SenSage [sensage.com]'s
log storage/analysis tool.
Any other tool will choke on the volume of information you'll be chugging
through in an enterprise environment, unless you pay for a multi-million-dollar
Oracle deployment.
A Linux-based product used by Blue Cross/Blue Shield, Yahoo, Lehman Brothers,
etc. For true enterprise security you need something like this.
[Dec 12, 2005] http://syslog-win32.sourceforge.net
A very interesting open source implementation of syslog daemon for windows by Alexander
Yaworsky. Quality coding.
This is another syslog for windows, it includes
daemon and client. Features:
Logalizer
is a Perl script that will analyze log files and email you the results.
One of the most important things a system administrator
should do is to examine his system log files. However, most system administrators,
myself included, have neither the time nor inclination to to do so. After setting
up appropriate site filters (a bit of work), logalizer will automatically analyze
log files and send the reports to you by email so that you can more easily detect
attempted break-ins or problems with your systems.
This program is very easy to install. Customization
to minimize the amount of noise is done by writing regular expressions to include
and exclude parts of the log files that are interesting. Sample filter files
are provided, but they will need to be tuned for your site.
Thanks to ...
devnull at adc.idt.com
Cody
Rob Rankin
Carsten Hey
Tom Yates
devnull at adc.idt.com and Tom Yates came with the upto the point solution for me.
I have added following line to my /etc/syslog.conf file and then touched /var/log/sulog
file.
----
auth.info /var/log/sulog
# ^^^^ this white space is TABs, not spaces
-----
and then,
/etc/init.d/syslog restart
We wanted to do this as following line was creating too large a file and we also write
our logs to syslog server.
----
*.info;mail.none;authpriv.none;cron.none /var/log/messages
----
So, we changed our above line to ... (which made a loose su log info)
------
*.notice;mail.none;authpriv.none;cron.none /var/log/messages
-------
Sorry for the late summary posting as was sick at home since Friday after making the
changes on Thursday. Hope this helps all.
Regards, Bhavin
Bhavin Vaidya wrote:
> Hello,
>> We would like to customise the sulog activity accross all (Solaris, HP-UX, AIX and
> Red Hat) OSs.
> Red Hat logs the login and sulogin activity under /var/log/messages file.
>> We would like to customise the sulog written to it's own log file say /var/log/sulog,
> like it does on rest of the other OSs. I have tried looking at /etc/pam.d/su but
> didn't find any config statement there.
>> Will appriciate if any one let me know how I can achive this.
>> BTW, I'm the Solaris, HP-UX and AIX tech and very new to Red Hat Linux.
>> Thanks in advance and with regards,
> Bhavin
I vote for /var/log/cron.19990220,
/var/log/ftp.19990220, /var/log/authlog.199902, etc. Do you have so many
logs online that they need more than one flat directory? Then go one more
level down, but not 4. Also, putting the timestamp in the filename makes restores
and greps of the files less confusing.
But I think the problem is even bigger than that.
Some log files grow VERY RAPIDLY -- many megabytes per day. Some grow very slowly.
authlog comes to mind. It's best to keep individual log files under some certain
size. 1MB is great. 10MB is OK. 50MB is getting kinda big.
But with these different growth rates, the tendency is to age some of them daily,
others weekly, others yearly(!).
Then there's the annoying ones like wtmp that are binary.
And let's not forget that some processes need to be restarted after a logfile
move, while others don't.
And some programs follow the paradigm "my logfile must exist and be writable
by me or else I will silently log nothing".
I've always considered writing some tool that would allow you to manage and
age all your log files from one config file. Maybe the config file would
be a table that lists the base logfile name, the interval at which it gets aged,
the number of logs or amount of space to keep online before deleting them, etc.
Anybody know of any such program? It might be too much work for too little
gain.
The ultimate would be an ADAPTIVE process that keeps fewer old logs online if
space is getting tight, etc. Personally I think an adaptive news expire
program would be nice, too.
I'll get right on these, as soon as I get this other stuff done for my boss...
:-)
Todd Williams
Manager, Computer and Communication Systems
MacNeal-Schwendler Corp. ("MSC"), 815 Colorado Blvd., Los Angeles,
CA 90041 [email protected]
(323)259-4973
http://www.macsch.com/
geek n. : a carnival performer often billed as a wild man whose act usu.
includes biting the head off a live chicken or snake -Webster's New Collegiate
Solaris systems use the /var directory to store
logs and other local files so that the operating system can support other directories
being mounted as read only, sometimes from file servers elsewhere on the network.
The /var directory is thus often on a partition that is local to the system.
All of the log files described below can be found
in subdirectories under /var. There may be other application-specific log files
that you will also need to inspect. However, it is beyond the scope of this
implementation to describe all of the log files that you might want to inspect
for your specific Solaris installation.
Because log files often provide the only indication
of an intrusion, intruders often attempt to erase any evidence of their activities
by removing or modifying the log files. For this reason, it is very important
that your log files be adequately protected to make it as difficult as possible
for intruders to change or remove then. See the practice
"Managing logging and other data collection mechanisms" for more information
on this topic.
Log file are used by the system and applications to record actions,
errors, warnings, and problems. They are often quite useful for investigating
system quirks, for discovering the root causes of tricky problems, and for watching
attackers. There are typically two types of log files in the Solaris Operating
Environment: system log files which are typically managed by the syslog daemon
and application logs which are created by the application.
set sys:coredumpsize = 0
Log Files Managed by syslog
The syslog daemon receives log messages from several sources
and directs them to the appropriate location based on the configured facility
and priority. There is a programmer interface, syslog(), and a system command,
logger, for creating log messages. The facility (or application type) and the
priority are configured in the /etc/syslog.conf file to direct the log messages.
The directed location can be a log file, a network host, specific users, or
all users logged into the system. By default, the Solaris Operating Environment
defines two log files in the /etc/syslog.conf file. The /var/adm/messages log
files contains a majority of the system messages. The /var/log/syslog file contains
mail system messages. A third log file is defined but commented out by default.
It logs important authentication log messages to the /var/log/authlog file.
Uncomment the following line in /etc/syslog.conf to enable logging these messages:
Save the file and use the following command to force syslogd to re-read its
configuration file:
All of these files should be examined regularly for errors,
warnings, and signs of an attack. This task can be automated by using log analysis
tools or a simple grep command.
Application Log Files
Application log files are created and maintained by commands
and tools without using the syslog system. The Solaris Operating Environment
includes several commands that maintain their own log files. Here is a list
of some of the Solaris Operating Environment log files:
/var/adm/sulog messages from /usr/bin/su
/var/adm/vold.log messages from /usr/sbin/vold
/var/adm/wtmpx user information from /usr/bin/login
/var/cron/log messages from /usr/sbin/cron
The /var/adm/wtmpx file should be viewed with the last command.
The /var/adm/loginlog file does not exist in the default of
the Solaris Operating Environment installation, but it should be created.
If this file exists, the login program records failed login attempts. All of
these logs should also be monitored for problems.
Solaris systems use the /var directory to store
logs and other local files so that the operating system can support other directories
being mounted as read only, sometimes from file servers elsewhere on the network.
The /var directory is thus often on a partition that is local to the system.
All of the log files described below can be found
in subdirectories under /var. There may be other application-specific log files
that you will also need to inspect. However, it is beyond the scope of this
implementation to describe all of the log files that you might want to inspect
for your specific Solaris installation.
Because log files often provide the only indication
of an intrusion, intruders often attempt to erase any evidence of their activities
by removing or modifying the log files. For this reason, it is very important
that your log files be adequately protected to make it as difficult as possible
for intruders to change or remove then. See the practice
"Managing logging and other data collection mechanisms" for more information
on this topic.
During the past several years I have found that there is an increase use
in the number of Windows based systems appearing in our predominately all UNIX
environment.
This paper will familiarize the reader with the
basics of syslog as defined by RFC 3164, describe some variations of syslog
as implemented by various network hardware vendors, provide an overview specifically
of Kiwi's syslog utility and its' functionality, demonstrate basic configuration
of the syslog utility, and finally provide examples of some advanced configurations
of the syslog utility that will offer specific automated functionality tailored
toward specific needs. Screenshots and other information will be presented in
order to provide a clearer understanding of how to accomplish these tasks using
the utility. After reading this document, a security professional should have
a good understanding of how Kiwi's syslog utility could be implemented to provide
an effective means of providing network information used for a wide range of
tasks.
This paper discusses a specific implementation
of using OLAP technology on log analysis, in particular by using the Seagate
Analysis OLAP client. The Seagate Analysis OLAP client, which is released free
to registered users since February 2000, snuggly fits into this role for log
analysis. This tool is free and powerful enough to be the first step for practitioners
to explore OLAP�s utility. We will discuss how OLAP alleviates the log analysis
problem, basic ideas on OLAP and related database design concepts. There is
also an iteration through a mini project that uses the Seagate Analysis on Windows
NT Event Logs.
In this article we are going to talk about one of the basics, but powerful,
methods of Intrusion Detection: Firewall's Log analysis. Although a firewall
generates a lot of log, being difficult to analyze it, you can use the OsHids
tool to monitor your logs (generating an easy to view log in html with an PHP
interface) and help you visualize any attempt to bypass your firewall policy.
A discussion of the methods used by hackers to attack IIS web servers, and
how you can use event log monitoring on your web server to be alerted to successful
attacks immediately.
The Event log service is by design a distributed system, and there are no
native Windows tools available to facilitate centralization of logging functions.
In addition, the failure to conform to any external logging format standard
makes it impossible to interoperate with the logging functions of other operating
systems or network devices. The Windows Event viewer application offers only
basic functionality and is inadequate for monitoring the audit log files of
any medium to large size network. In this paper, I survey some of the options
available to access the Windows Event log and demonstrate how to implement a
versatile centralized remote logging solution using a commercially available
Win32 implementation of the Syslog protocol.
If a break-in occurs and you want to track the cracker down, the system administrator
will first check the log files for evidence of a break-in, so she must be 100%
SURE that the log files are valid and haven't been tampered with.
A remote log server is nothing more then a system preconfigured at install-time
to provide hard drive space for other systems to log to. This system must be
completely secured and locked down. No unencrypted remote access should be allowed,
all RPC Daemons and other misc. services should be turned off as well. The only
data allowed to the machine should be UDP/Port 514. We will be walking you through
a step-by-step process that details how to configure, install, and deploy a
remote log server. Utilizing some of the most renowned security experts across
the globe for input, I've compiled a comprehensive, and easy to understand guide
on ensuring this to be a successful launch.
During the past several years I have found that there is an increase use
in the number of Windows based systems appearing in our predominately all UNIX
environment. This has been a downfall especially since UNIX and Windows systems
are so different with regards to logging facilities, UNIX with its syslog facilities
and Windows Eventlog; therefore I needed to find a way so that our Windows and
UNIX systems could utilize a more robust logging facility. With budget concerns,
being a major contributing factor, I needed to find a solution that was inexpensive.
Therefore all the items that I chose to implement at this time are freeware
and applications that already exist in our environment. The Windows systems
needed to be configured so that they would audit the proper events and then
forward that onto a UNIX system for storage and eventually analysis. Next, the
UNIX systems needed a bit of tuning to get syslog to log the correct items.
Finally, the logs needed to be retained and rotated.
The purpose of this research topic is to identify the purpose of the event
log in today's network security environment. This topic came about to solve
an every day business problem. Simply, there is not enough time in the day to
perform all security analyst tasks and adequately monitor all network security
devices. However, expectations were that monitoring all components of network
security is essential. It's the way things had been done and anything short
of that may render a device or component of network security as "insecure".
It was clear that something must be done.
Firewalls are necessary for a defense-in-depth strategy. Microsoft entered
the firewall market with Internet Security and Acceleration Server (ISA Server).
ISA Server was a follow-on release of Microsoft Proxy Server and part of the
.Net Family. As with most Microsoft products, logging capabilities are included.
ISA Server contains detailed security and access logs. You can install ISA Server
in three different modes: firewall mode, web caching mode, or integrated mode.
In firewall mode, you can secure communication between an internal network and
the Internet using rules. You can publish internal servers so that their services
are available to Internet users. In web caching mode, you can decrease network
bandwidth with ISA Server storing commonly accessed objects locally. You can
route web requests from the Internet to an internal Web Server. In integrated
mode, all of these features are available.
As a systems administrator, knowing the status of the systems in your network
is a must. This can be quite a challenge when you are dealing with tens, hundreds
or thousands of different systems. A multitude of options are available for
obtaining systems statistics, many of them freely available. For my purposes,
I had a number of different requirements that most packages did not meet. In
the end, I opted to build my own. This article explains the design of my solution,
as well as its installation and configuration for use in your own environment.
One of my first requirements for systems statistics monitoring was any solution
has to include a SQL backend. At the very least, it needs to have some way to
export its data easily to allow it to be loaded into a SQL database. I wanted
all data to be stored in a set of tables, but for simplicity and speed I decided
to store only a single set of current data in the primary data table. Historical
data then would be archived to an archive table, allowing reporting tools to
use much simpler queries to obtain either current or historical data and to
increase the speed and efficiency of queries against the current data table.
I debated whether to use a central data collection system or to allow each
client to collect its own data. In the end, I decided to have each client collect
the data and update the database. This made it much simpler to do asynchronous
status updates without using a threaded server using a pull model. The agent
needs to run on each host to collect the data, so why not have it make the database
updates too?
The data gathering was a much more difficult problem to tackle due to portability
issues. After spending some time implementing data-gathering functions, I came
upon libstatgrab, a cross-platform systems statistics gathering library written
in C. Many of the statistics I needed were handled by libstatgrab, so the first
version uses libstatgrab exclusively to collect the data.
Figure 1 contains a simple graph showing the data flow from the OS level
to ssclient via libstatgrab and then from ssclient to the database via libmysqlclient.
Epylog is a log notifier and parser that periodically tails system logs on
Unix systems, parses the output in order to present it in an easily readable
format (parsing modules currently exist only for Linux), and mails the final
report to the administrator. It can run daily or hourly. Epylog is written specifically
for large clusters where many systems log to a single loghost using syslog or
syslog-ng.
CCZE is a robust and modular log colorizer with plugins for apm, exim, fetchmail,
httpd, postfix, procmail, squid, syslog, ulogd, vsftpd, xferlog, and more.
Complete System Resource Monitor and Task Organizor consists of a daemon, a client,
and a WWW-server (within the daemon). The daemon can run tasks and handle client-daemon
and WWW-daemon requests. Clients can receive statistics and issue commands. Monitoring
and maintenance is performed as prescheduled tasks. The system includes a process
monitor and handler, a basic WWW-client, and a console client.
FSHeal aims to be a general filesystem tool that can scan and report vital
"defective" information about the filesystem like broken symlinks, forgotten
backup files, and left-over object files, but also source files, documentation
files, user documents, and so on. It will scan the filesystem without modifying
anything and reporting all the data to a logfile specified by the user which
can then be reviewed and actions taken accordingly.
Ganglia - Monitoring core branch
by
Matt Massie - Saturday, January 19th 2002 23:28 PST
About:
Ganglia is a scalable distributed monitoring system for high-performance
computing systems such as clusters and grids. It is based on a hierarchical
design targeted at federations of clusters. Ganglia is currently in use
on over 500 clusters around the world and has scaled to handle clusters
with 2000 nodes.
By default, the syslog file will contain
only messages from mail (as defined in the /etc/syslog.conf
file). Look for anything that looks unusual.
/var/adm/messages
This log records system console output and
syslog messages. Look for unexpected system halts.
Look for unexpected system reboots.
Mar 31 12:48:41 ahost.domain.com unix: rebooting...
Look for failed su and
login commands.
Mar 30 09:14:00 <hostname> login: 4 LOGIN FAILURES ON 0, <userid>
Mar 31 12:37:43 <hostname> su: 'su root' failed for <userid> on /dev/pts/??
Look for unexpected successful su commands.
Mar 28 14:31:11 <hostname> su: 'su root' succeeded for <userid> on /dev/console
/var/adm/pacct
This log records the commands run by all users. Process accounting must be turned
on before this file is generated. You may want to use the
lastcomm command to audit commands run
by a specific user during a specified time period.
compile <userid> ttyp1 0.35 secs Mon Mar 31 12:59
/var/adm/aculog
This log keeps track of dial-out modems. Look for records of dialing out that
conflict with your policy for use of dial-out modems. Also look for unauthorized
use of the dial-out modems
Other log files
Solaris includes Basic Security Module (BSM),
but it is not turned on by default. If you have configured this service, review
all the files and reports associated with BSM for the various kinds of entries that
have been described in the practice
"Inspect your system and network logs."
If your site has large networks of systems with many log files to inspect, consider
using tools that collect and collate log file information. As you learn what is
normal and abnormal for your site, integrate that knowledge into your specific procedures
for inspecting log files.
The Last but not LeastTechnology is dominated by
two types of people: those who understand what they do not manage and those who manage what they do not understand ~Archibald Putt.
Ph.D
FAIR USE NOTICEThis site contains
copyrighted material the use of which has not always been specifically
authorized by the copyright owner. We are making such material available
to advance understanding of computer science, IT technology, economic, scientific, and social
issues. We believe this constitutes a 'fair use' of any such
copyrighted material as provided by section 107 of the US Copyright Law according to which
such material can be distributed without profit exclusively for research and educational purposes.
This is a Spartan WHYFF (We Help You For Free)
site written by people for whom English is not a native language. Grammar and spelling errors should
be expected. The site contain some broken links as it develops like a living tree...
You can use PayPal to to buy a cup of coffee for authors
of this site
Disclaimer:
The statements, views and opinions presented on this web page are those of the author (or
referenced source) and are
not endorsed by, nor do they necessarily reflect, the opinions of the Softpanorama society.We do not warrant the correctness
of the information provided or its fitness for any purpose. The site uses AdSense so you need to be aware of Google privacy policy. You you do not want to be
tracked by Google please disable Javascript for this site. This site is perfectly usable without
Javascript.
Image by : Internet Archive Book Images . Modified by Opensource.com. CC BY-SA 4.0 x Get the newsletter


Introducing Logreduce
Managing baselines
Anomaly classification service

Tristan de Cacqueray - OpenStack Vulnerability Management Team (VMT) member working at Red Hat.
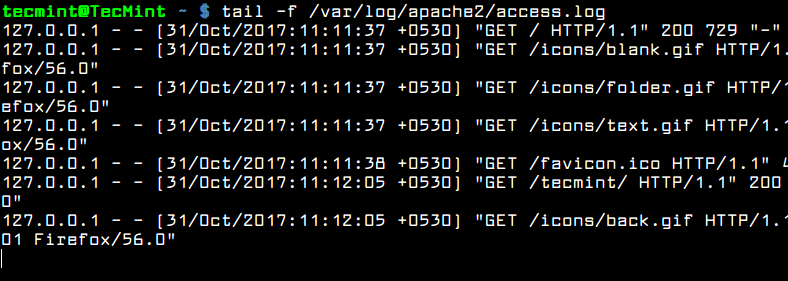
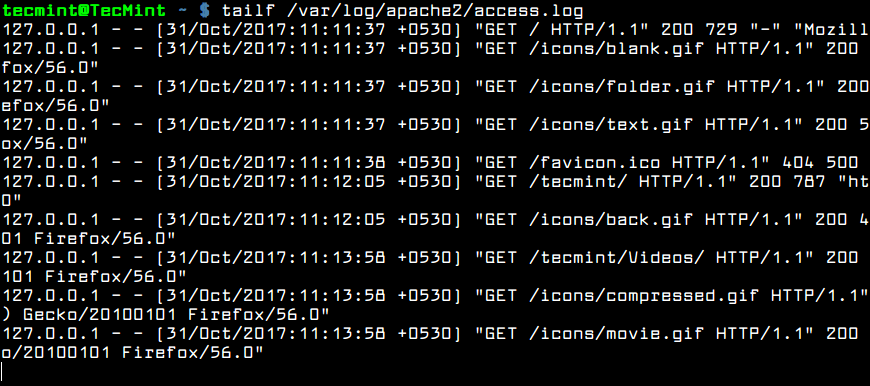
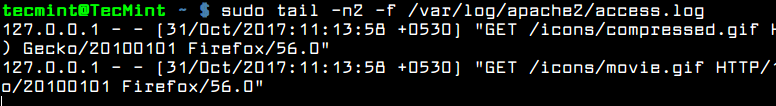
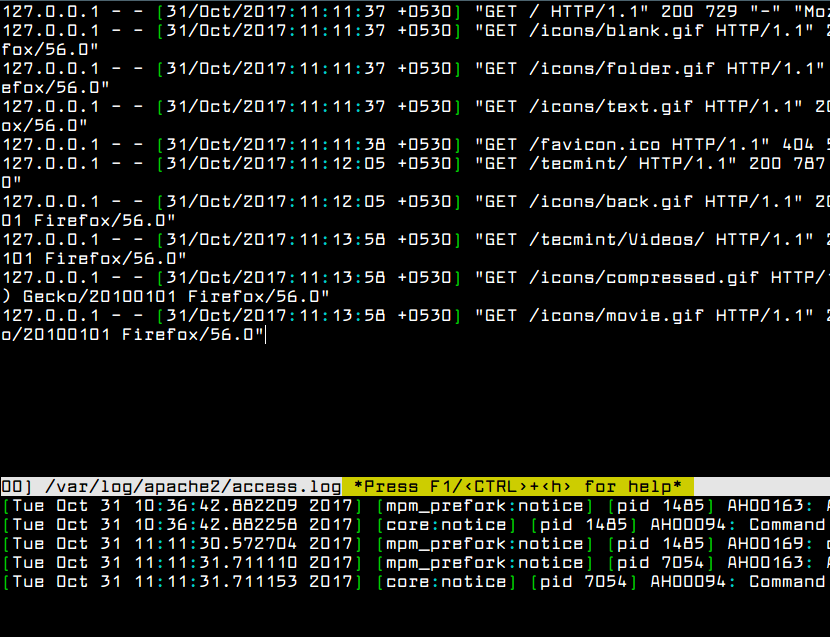
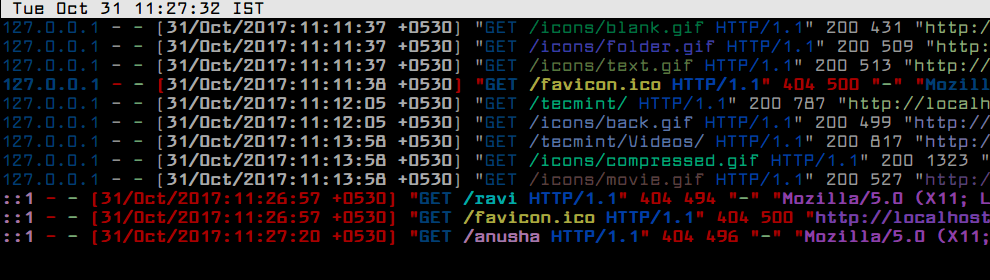
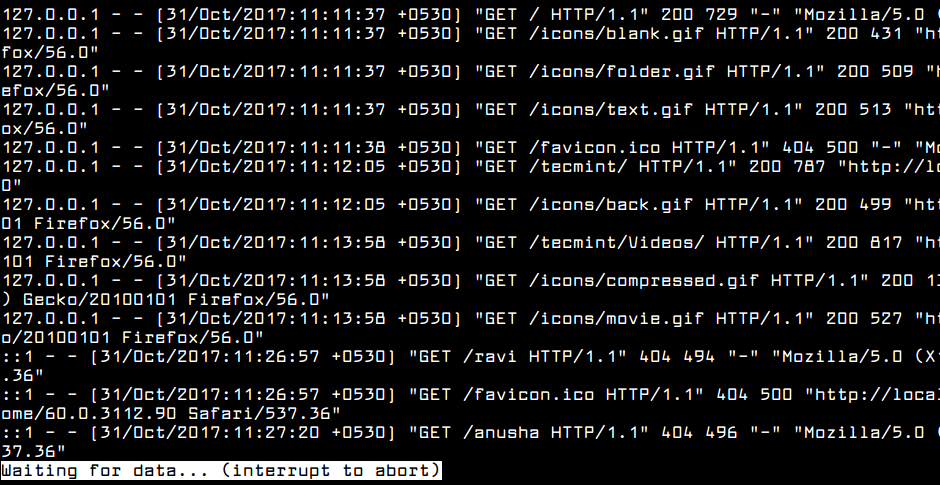
Dream Book on Dream Tool, October 3, 2006