|
|
Home | Switchboard | Unix Administration | Red Hat | TCP/IP Networks | Neoliberalism | Toxic Managers |
| (slightly skeptical) Educational society promoting "Back to basics" movement against IT overcomplexity and bastardization of classic Unix | |||||||
Version 2.01 (March 2017)
|
Any sufficiently large and complex monitoring package written in C contains
buggy Reinterpretation of P. Greenspun quote about Lisp |
|
|
System monitoring, specifically Unix system monitoring, is an old idea and there was not much progress for the last thirty years in comparison with state of the art in early 1990th when Tivoli and OpenView entered the marketplace. Moreover now it is clear that any too complex monitoring system is actually counterproductive: sysadmins simply don't use it or use small fraction of its functionality because they are unable or unwilling to master the required level of complexity. they have already too much complexity on the plate to want more.
Another important factor (or nail into expensive proprietary monitoring system, such as IBM Tivoli, or HOP OpenView, coffin) is the tremendous success of protocols such as ssh and tool like rsync that change the equation making separate/proprietary channels of communication between the monitoring clients and the "mother ship" less necessary.
Another important development is proliferation and relative success of Unix/Linux configuration management system which also have some monitoring component (or can be programmed to perform those tasks along with configuration tasks).
Even HP OpenView which is somewhat better that several other commercial systems looks like a huge overkill for a typical sysadmin. Too much staff to learn, too little return on investment. And if OpenView is managed by a separate department this is simply a disaster: typically those guys are completely detached from the needs of the rank-and-file sysadmins and live in their imaginary (compartmentalized) world. Moreover they are prone of creating red tape and as a result stupid, unnecessary probes are installed and stupid tickets are generated.
In one organization those guys decided to offload the problem of dying Open Views agents daemons ( which in Open View tent to die regularly and spontaneously) to sysadmins, creating a stream of completely useless tickets. That was probably the easiest way to condition sysadmins to hate OpenView. As a result, communication lines between OpenView team and sysadmins became frozen, the system fossilized and served no useful purpose at all. Just "waiving dead chicken type of system. Those "monitoring honchos" enjoyed their life for a while until they were outsourced. At the same time useful monitoring of filesystems free space was done by a simple shell script, written by one of sysadmins ;-). So much for investment in Open View and paying for specialized monitoring staff.
As for Tivoli deployments, sometimes I think that selling their products in a kind of a subversive work of some foreign power (is not IBM too cozy with China :-) which wants to undermine the USA IT. They do produced good eBooks called Redbooks, though ;-)
At the core monitoring system is a specialized scheduler that executes local or remote jobs (called probes) at predetermined time (typically each N minutes). In case of remote servers execution can be agentless (in this case ssh or telnet typically are used as an agent, but shared filesystem like NFS also can be used) or using specialized agent (end point). There was not any really revolutionary ideas in this space for the last 20 years or so. That absence of radical new ideas permits commodization of the field and corresponding downward pressure on prices. With open source product now "good enough". Some firms still try to play the "high price" - "high value" game with the second rate software they own, but I think that time for premium prices for monitoring products has gone.
Now the baseline for comparison is several open source systems which you can try free and buy professional support later on, which usually has lower maintenance costs them proprietary systems. That does not mean that they can compete in all areas and, for example, agent-based monitoring and event correlation is still done better by proprietary, closed source systems, but they are usually more adaptable and flexible which is an important advantage. Here is one apt quote:
Nagios is frankly not very good, but it's better than most of the alternatives in my opinion. After all, you could spend buckets of cash on HP OpenView or Tivoli and still be faced with the same amount of work to customize it into a useful state....
|
|
Unix system monitoring includes several layers:
In this page we will mainly discuss operating system monitoring. And we will discuss it from our traditional "slightly skeptical" viewpoint. First of all it is important to understand that if the system is geographically remote it is considerably more difficult to determine what went wrong, as you lose significant part of the context of the situation that is transparent to the local personnel. Remote cameras can help to provide some local context, but still they are not enough. It's much like flying airplane at night: you need to rely solely on instruments. In this case you need more a sophisticated system. Another large and somewhat distinct category are virtual machines. Which actually can be remote, in distant locations too.
Most system processes write some messages to syslog, if things went wrong. That means that first thing in OS monitoring should be monitoring of system logs, but this is seldom done and extremely rarely done correctly. the second thing is monitoring of disks free space. Which also seldom is done correctly, as this simple problem does not have a simple solution and have a lot of intricate details that needs to be taken into account (various filesystem usually need to have different thresholds, 100% utilization of some filesystem in Ok, while others (such a /tmp is a source of problems, But logs and free space is two areas were the real work on a robust monitoring system should start. Not from acquiring system with a set of some useful or semi-useful probes but getting a sophisticated log analyzer and writing yourself a customized for your environment free filesystems space analyzer. Reasonably competent free space analyzer that allows individual thresholds for filesystem and two stages of alerted (warning and critical) can be written in less then 1000 lines of Perl or Python and that means that it can be written and debugged in a week or two.
Please be aware that some commercial offerings in the category of log analyzers are weak and are close to junk and (in case of commercial offerings) survive only due to relentless marketing (splunk might be one such example).
Some use databases to process log. Which is not a bad idea but it depends on your level of familiarity with database and SQL (typically this attractive option for those sysadmin, who maintain a lof of MySQL or Oracle databases) and the size of your log files. With extremely large log files you better stay within flat file paradigm, although SSD changed this equation recently. Spam filters can serve as a prototype for useful log analyzers. In case of analyzing flat file usage of regex is a must, so Perl looks like a preferable scripting language for this typ of alayser. A reasonably competent analyzer can be written in 2-3K of code. Multiple prototypes can be downloaded from he Web or from the distribution you are using (see, for example, Logwatch ). The key problem here (vividly represented by Logwatch) is that the set of "informative" log messages tend to fluctuate with time and is generally OS version depends (varying even from one release to another, but drastically different for example between RHEL 5 and RHEL 6) and in one year and a couple of upgrades your database of alerts becomes semi-useless. If you have time to do another cycle of modifying the script -- then good, if not, you have another monitoring script that is "waving dead chicken". One way to avoid this situation is to use Syslog Anomaly Detection Analyzers but ther are still pretty raw and can produce many false positives.
If you manage large number of systems it is important for your sanity to see the situation on existing boxes via dashboard and integrated alert stream. You just physically can't login and check boxes one by one. While monitoring is not a one-size-fits-all solution, a lot of tasks can be standardized and instead of reinventing the bicycle adopted from or with some existing open source system. Reinventing the bicycle (unless your a real expect in LAMP) is usually pretty expensive exercise. You probably are better off betting on one of the popular open source system such as Nagios and using its framework for writing your own scripts.
The problem of monitoring is complicated by the fact that situation with Unix systems monitoring in most large organizations typically is far from rational. Which means that sometimes it is close of Kafkaesque level of bureaucratic absurdity ;-) Here we means that it is marked by a senseless, illogical, disorienting, often menacing complexity and bureaucratic barriers. Most large organizations have crippled by this phenomenon monitoring infrastructures. The following situations are pretty typical:
Proliferation of overlapping tools is a typical situation in large corporations, where left hand does not know what
right is doing and the current infrastructure is a slight adaptation of a mess created by serial
acquisitions. In a way, this is also yet another case of overcomplexity, but instead of single too complex
tool (or two) that supposedly unifies most aspects of monitoring of Unix systems, we have multiple overlapping tools. Often
such tools contain redundant, expensive components which don’t play well with one another or are
completely useless. Often
some acquired or were inherited via acquisitions and might be used for very limited cases but
not
discarded. Sometime acquired via acquisitions tools that are mercilessly discarded (with expensive
licenses) are far superior to the existing solutions.
Higher level IT management often can't distinguish between reality and illusion produced
by skilled marketing and force rank-and-file workers into systems that are not that useful (to
say politely). And it is low level staff, especially system administrators, who later
pays for top brass state of self-indulged juvenility. Delusional marketing of pretty weak IT products
to the IT brass (the tactic perfected by IBM, but used by all major vendors), when a crappy
system is sold as the next revelation
is pretty successful in keeping fools and their money parted, but in this case we are talking about
multi-billion corporations and that's a chump change for them. Still the fact on the ground is that
IT brass prefer to cling to fantasies that some expensive IT system from top four vendors recommended
by Gartner (which has huge problems with distinguishing between marketing hype and reality, see
Gartner Magic Quadrant for IT Event Correlation and Analysis) will snatch them from the current
harsh reality and create a Disneyland out of the messed up corporate datacenter. Those gullible
IT management clowns destroy the existing American programmers and system administration culture
of Unix system adaptation and integration (which created many first class products by adapting average
product to the organizational needs) adopting Windows-style approach and make their staff enslaved in the support of complex but
inefficient system with GUI. Without critical thinking, without a culture of "do/adapt it yourself"
business IT is doomed to fall victim to charlatans, who sell one or the other version of snake oil.
Typically such situation is a side effect of outsourcing.
Excessive bureaucratization of IT paralyzes effective decision making. There are very few places where Jerry Pournelle’s Iron Law of Bureaucracy is more prevalent than in large corporate IT:
“In any bureaucracy, the people devoted to the benefit of the bureaucracy itself always get in control and those dedicated to the goals the bureaucracy is supposed to accomplish have less and less influence, and sometimes are eliminated entirely.”
Few people understand that the key question in sound approach to monitoring is the selection of the level of complexity that is optimal both for the system administrators (who due to the overload is the weakest link in the system) and at the same time produce at least 80% of the results necessary to keep a healthy system. Actually in many cases useful set of probes is much smaller that one would expect. For example, monitoring of disk filesystems for free space typically is No.1 task that in many cases of enterprise deployment probably constitute 80% of total value of monitoring system, monitoring performance of few parameters the server (CPU, uptime, I/O) is probably No.2 that has 80% of residual 20% and so on. In other word Pareto law is fully applicable to monitoring
Simplicity pays nice dividends: if tool is written in a scripting language and matches the level of skills of sysadmins they can better understand it and possibly adapt it to the environment and thus get far superior results then any "of the shelf" tool. For example, if local sysadmins just know shell (no Perl, no Javascript), then the ability to write probes in shell is really important and any attempt to deploy tools like ITM 5.1 (with probes written in JavaScript) is just a costly mistake.
Also avoiding spending a lot of money on acquisition, training and support of overly complex tool provide opportunity to pay more for support including separately paid incidents which vendors love and typically serve with very high priority as for unlike annual maintenance contract they represent "unbooked" revenue source.
Let's think if any set of proprietary tools that companies like IBM try to push thou the throat for, say, half-million dollars in just annual maintenance fees (using cheap tricks like charging per core, etc) are that much better that a set of free open source tools that covers the same set of monitoring and scheduling tasks. I bet you get pretty good quality 24x7 support for a small fraction of this sum and at the end of the day it all that matter. I saw many cases in which companies used an expensive package and implemented subset of functionality that was just a little more then ICMP (aka ping) monitoring. Or that the subset of used functionality can be replicated much more successfully by a half dozen simple Perl scripts. The Alice in Wonderland of perversions of corporate system monitoring still need to be written, but it is clear that regular logic is not applicable to a typical corporate environment. Or many if should be not Alice of Wonderland but
Another important consideration is what we can call Softpanorama law of monitoring: If in a large organization, the level of complexity of a monitoring tool exceeds certain threshold (which depends on the number and the level of specialization of dedicated to this task sysadmins and the level of their programming skills of all other sysadmins) the monitoring system usually became stagnant and people are reluctant to extend and adapt it to new tasks. Instead of being a part of the solution such a tool becomes a part of the problem.
This is typical situation on the level of complexity typical for Tivoli, CA Unicenter and, to a slightly lesser extent, HP Operations Manager (former Open View). For example, writing rules for Tivoli TEC requires some understanding of Prolog (which is very rare, almost non-existent skill, among Unix sysadmins) as well as Perl ( knowledge of which is far more common, but far from universal among sysadmins, especially on Windows).
Adaptability means that simpler open source monitoring systems that uses just the language sysadmin know well be it Bash or Perl has tremendous advantages over the complex one in the long run. Adaptability of the tool is an important characteristic and it is unwise (but pretty common) to ignore it.
|
If in a large organization if the level of complexity of a monitoring tool exceeds certain threshold (which depends on the number and the level of specialization of dedicated to this task sysadmins and the level of their programming skills) the monitoring system usually became stagnant and people are reluctant to extend and adapt it to new tasks. Adaptability of the tool is an important characteristic and it is unwise (but pretty common) to ignore it. |
I suspect that the level of complexity should be much lower that the complexity of monitoring solutions used in most large organizations (actually Goldman Sachs extensively uses Nagios, despite being probably the richest organization on the planet ;-). Such cases allow to overcome corporate IT bureaucracy. In any case that fact on the ground is that in many current implementations in large organization complex monitoring system are badly maintained (to the extent they become almost useless as in example with Open View above) and their capabilities are hugely underutilized. That demonstrate that raising above certain level of complexity of monitoring system is simply counterproductive, and simple, more nimble systems have an edge. sometime two simple systems (one for OS monitoring, one for network and applications probes) outperform a single complex system by large margin.
In other words most organizations suffer from the feature creep in monitoring systems in the same way they are suffering from feature creep in regular applications.
Like love system monitoring is a word with multiple meanings. We can define several categories of operating system monitoring:
Monitoring system logs. This is
sine
qua non of operating system monitoring. A must. If this is not done (and done
properly), there not reason to discuss any
other aspects of monitoring because as
Talleyrand characterized such situation "this is worse then a crime -- this is a blunder." In Unix this
presuppose the existence of centralized server, so called LOGHOST server.
Few people understand that log analyses on LOGHOST server by itself represents a pretty decent distributed monitoring
system and that instead reinventing the wheel it is possible to enhance it by writing probes
that run from cron and which
write messages to syslog as well as monitoring script on the LOGHOST that pickup specific messages (or sets of messages) from the
log.
In a typical Unix implementation such as Solaris or RHEL 6 a wealth of information is collected by syslog daemon and put in /var/log/messages
(linux) or /var/adm/messages (Solaris, HP-US). There are now "crippled"
distributions that uses jounald without syslog daemon, but RHEL in version 7 continues
to use rsyslogd.
Unix syslog, which originated from Sendmail project records various conditions including
crashes of components, failed login attempts, and many other useful things including information
about health of key daemons. This is an integral area that overlaps each and every areas described
above, but still deserve to be treated as a separate. System logs provide a wealth of information
about the health of the system, most of which is usually never used as it is buried in the noise
and because regular syslog daemon outlived its usefulness (syslog-ng
used as a replacement for syslogd in Suse 10 and 11 provides quite good abilities to filter logs,
but unfortunately they are very complex to configure and difficult to debug).
Sending log stream from all similar systems to the special log server is also important from the
security standpoint.
Monitoring System Configuration Changes This category includes monitoring for changes in hardware and software configurations that can be caused by an operating system upgrade, patches applied to the system, changes to kernel parameters, or the installation of a new software application.
The root cause of system problems can often be traced back to an inappropriate hardware or software configuration change. Therefore, it is important to keep accurate records of these changes, because the problem that a change causes may remain latent for a long period before it surfaces. Adding or removing hardware devices typically requires the system to be restarted, so configuration changes can be tracked indirectly (in other words, remote monitoring tools would notice system status changes).
However, software configuration changes, or the installation of a new application, are not tracked in this way, so reporting tools are needed. Also, more systems are becoming capable of adding hardware components online, so hardware configuration tracking is becoming increasingly more important.
Here version control systems and Unix configuration management tools directly compete with
monitoring systems. As I mentioned some Unix configuration management systems have agents and as
such can replicate lion share of typical Unix monitoring system tasks.
Monitoring System Faults. After ensuring that the configuration is correct, the first
thing to monitor is the overall condition of the system. Is the system up? Can you talk to it, ping
it, run a command? If not, a fault may have occurred. Detecting system problems varies from determining
whether the system is up to determining whether it is behaving properly. If the system either isn't
up or is up but not behaving properly, then you must determine which system component or application
is having a problem.
Monitoring System Resource Utilization. For an application to run correctly, it may need
certain system resources such as the amount of CPU, memory or I/O bandwidth an application
is entitled to use during a time interval. Other examples include the number of open files or sockets,
message segments, and system semaphores that an application has. Usually an application (and operating
system) has fixed limits for each of these resources, so monitoring their use at levels close to
threshold is important. If they are exhausted, the system may no longer function properly. Another
aspect of resource utilization is studying the amount of resources that an application has used.
You may not want a given workload to use more than a certain amount of CPU time or fixed amount
of disk space. Some resource management tools, such as quota, can help with this.
Monitoring System Performance. Monitoring the performance of system resources can help
to indicate problems with the operation of the system. Bottlenecks in one area usually impact system
performance in another area. CPU, memory, and disk I/O bandwidth are the important resources to
watch for performance bottlenecks. establish baselines you should monitor system during typical
usage periods. Understanding what is "normal" helps to identify when system resources are
scares during a particular periods (for example "rush hours"). Resource management tools are
available that can help you to allocate system resources among applications and users.
Monitoring System Security. While the ability to protect your systems and information from determine intruders is a pipe dream due to existence of such organizations as NSA and CIA (and you really should consider the return to typewriters for such materials disallowing any electronic copy) , some level of difficulties for intruders can and should be created. Among other things that includes so called "monitoring for unusual activities" . This type of monitoring includes monitoring of last log, unusual permissions, unusual changes in /etc/passwd files and other similar "suspicious" activities. This is generally a separate area from "regular monitoring" for which specialized systems exist. A separate task is so called hardening of the system -- ensuring compliance with the policies set for the systems (permissions of key files, configuration of user accounts, set of people who can assume the role of root), etc. This is type of monitoring that is difficult to do right as the notions of superior activity is so fuzzy. Performance and resource controls are also can be useful for detecting such activities. The value of specialized security tools is often overstated, but in small doses they can be useful not harmful. That first of all is applicable to so called hardening scripts and local firewall configurators. For example it is easy to monitor for world writable files and wrong permissions on home directories and key system directories. There no reason not to implement this set of checks. In many cases static (configuration settings) security monitoring can be adapted from existing hardening package such as (now obsolete) Titan or its more modern derivatives.
As a side note I would like to mention that rarely used and almost forgotten
AppArmor (that is available in
Suse by default) can do wonders with application security.
Monitoring system performance. Here in the simplest form, the output of System Activity Reporter (sar) can be processed and displayed. Sar is a simple and very good tool first developed for Solaris and later adopted by all other flavors of Unix, including Linux. This solution should always be implemented first, before any more complex variants of performance monitoring are even considered. Intel provides good performance monitoring tools with their compiler suit.
"The big four" - HP Operations Center (with Operations Manager as the key component), Tivoli. BMC and CA Unicenter dominate large enterprise space. They are very complex and expensive products, products which require dedicated staff and provide relatively low return on investment. Especially taking into account the TCO which dramatically increases with each new version due to overcomplexity. In a way dominant vendors painted themselves into a corner by raising the complexity far above the level normal sysadmin can bear.
My experience with big troika is mainly in "classic" Tivoli (before Candle, aka Tivoli Monitoring 6.1, and Micromuse, aka Netcool, acquisitions) and HP_Operations Manager, but still I think this statement reflects the reality of all "big vendors ESM products": also mentioned vendors use overcomplexity as a shield to protect against competitors and to extract a rent from customers. IBM is especially guilty in "incorrect" behavior as it become very greedy resorting to such dirty tricks as licensing of their software products per socket or, worse, per core. You reject such offers as a matter of prudency: you can definitely utilize your money ten times more efficiently then buying such a product by using a decent open source product such as Puppet (which while not a monitoring system per se duplicates much of this functionality) with professional support. Nothing in monitoring space even remotely justifies licensing per socket or per core. Let Watt Street firms use those wonderful products as only for them one million more one million less is a rounding error.
Also despite level of architectural thinking is iether completely absent, or is very low, new versions of such commercial systems are produced with excessive frequency to keep the ball in play. While the technologies used can be ridiculously outdated: those products often use obsolete of semi-obsolete architecture and sometimes obscure, outdated and difficult to understand and debug protocols. In the latter case, the products became the source of hidden (or not so hidden) security vulnerabilities. That actually is not limited to monitoring tools and it typical for any large complex enterprise applications (HP Data Protector with its free root telnet for all nodes in an insecure mode comes to mind). In a way, the agents on each server are always should be viewed as hidden backdoors, not that different from backdoors used for "zombification" of servers by hackers. That does not mean that agentless tools are more secure. If they use protocols such as SSH for running remote probes, the "mothership" server that host such a system became a "key to the kingdom" too. This is a pretty typical situation for such tools as Nagios and HP SiteScope.
For major vendors of monitoring products with substantial installed userbase overcomplexity is to certain extent unavoidable: they need to increase complexity with each version due to the feeling of insecurity and the desire to protect and extend their franchise. What is bad is that overcomplexity is used as the mean of lock-in of users and as a shield that protects against competitors simultaneously helping to extract rent from existing customers (the more complex the tool is the more profitable are various training classes). Certain vendors simply cannot and do not want to compete on the basis of functionality provided. They do need a lock-in to survive and prosper.
| For major vendors of monitoring products with substantial installed userbase overcomplexity is to certain extent unavoidable: they need to increase complexity with each version due to the feeling of insecurity and the desire to protect and extend their franchise. What is bad is that overcomplexity is used as the mean of lock-in of users and as a shield that protects against competitors simultaneously helping to extract rent from existing customers (the more complex the tool is the more profitable are various training classes). |
In a way, this is very similar pressures to those that destroyed the US investment banks in recent "subprime mess". Due to such pressures vendors are logically pushed by events into the road which inevitably leads to converting their respective systems into barely manageable monsters. They still can be very scalable despite overcomplexity, but the flexibility of the solutions and the quality of interface suffers greatly. And only due to high quality and qualification of tech support those system can be maintained and remain stable in a typical enterprise.
That opens some space for open source monitoring solutions which can be much simpler and rely much more on established protocols (for example, HTTP, SMTP and SSH). Important fact which favors simpler solutions is that in any organization, usefulness of the monitoring package is limited to the ability of personnel to tweak it to the environment. Packages with tuning that are above the head of the personnel can actually be harmful (Tivoli Monitoring 5.1 with its complex API and JavaScript-based extensions is a nice example of the genre)
| In any organization, usefulness of the monitoring package is limited to the ability of personnel to tweak it to the environment. Packages with the complexity of tuning that are above the head of the personnel can actually be harmful (Tivoli Monitoring 5.1 with its complex API and JavaScript-based extensions is a nice example of the genre) |
Since adequate (and very expensive) training for those products is often skipped as an overhead, it' not surprising that many companies never get more than the most basic functionality for a very expensive (and theoretically capable) product. And basic functionality is better provided by simple free or low cost packages. So extremes meet. This situation might be called a system monitoring paradox. That's exactly what makes Tivoli, HP Operations Center, BMC and CA Unicenter consultants happy and in business for many years.
|
System monitoring paradox is that both expensive and cheap monitoring solution usually provide very similar quality of monitoring and both have adequate capabilities for a typical large company |
It costs quite a lot to maintain and customize tools like Tivoli or Open view in large enterprise environment where money for this are readily available. Keeping good monitoring specialist on the job is also a problem as once person become really good in scripting they tend to move to other, more interesting areas, like web development. There is nothing too exciting in daily work of monitoring specialist and after a couple of years the usual feeling is that his/her IQ is underutilized is to be expected. So most capable people typically move on. The strong point of big troika is support and availability of professional services but the costs are very high. But it is important to understand that complex products to a certain extent reflect the large datacenter environment complexity and not all tasks can be performed by simple products although 80% might be s a reasonable estimate.
That means that the $3.6 billion market for enterprise system management software is ripe for competition from products that utilize scripting languages instead of trying to foresee each and every need the enterprise can have. Providing simple scripting framework for writing probes and implementing the event log, dashboard and configuration viewer on a webserver lower the barrier of entry.
But such solutions are not in the interests of large vendors as they can lower their profits. They cannot do not want to compete in this space. What is interesting is that scripting-based monitoring solutions are pretty powerful and proved to be competitive with much more complex "pre-compiled" or Java-based offerings. There are multiple scripting-based offerings from startups and even individual developers which can deliver 80% of the benefits of big troika products for 20% of cost of less and without millions of lines of Java code, an army of consultants and IT managers and annual conferences for big brass.
In other words "something is rotten in the state of Denmark." (Hamlet Quotes)
Scripting languages beat Java in area of monitoring hands down and if a monitoring product is written in a scripting language this should be considered to be a strategic advantage. Advantage that is worth to fight for.
| Scripting languages beat Java in the area of monitoring hands down and if a monitoring product is written in a scripting language and/or is extendable using scripting language this should be considered to be a strategic advantage. Advantage that is worth fighting for. |
First of all because codebase is more maintainable and flexible. Integration of plug-ins written in the same scripting language is simpler. Debugging problems is much simpler. Everything is simpler because scripting language is a higher level language then Java or C#. But at the same time I would like to warn that open source is not a panacea and it has its own (often hidden) costs and pitfalls. In a corporate environment other things equal you are better off with an open source solution behind which there is at least one start-up. Badly configured or buggy monitoring package can be a big security risk. In no way that means that, say, Tivoli installations in real world are secure, but they are more obscure and security via obscurity works pretty well in a real world ;-)
Let's reiterate the key problems with monster, "enterprise ready", packages:
Licensing and Maintenance Costs. One of the most common problems is the cost of license. Often "the big troika" is too expensive and just priced smaller and medium size companies out of the market. But the picture is more complex then that. For example IBM used to sell ITM Express 6 really cheap and this is actually full blown enterprise class monitoring system that is just limited to few nodes. But nodes can be aggregators of events based on some open source package, not individual servers so this limitation can be partially bypassed. By buying minimal or "express" edition or expensive tools organizations can get the first class GUI and robust correlation engine.
The second part of the total cost of ownership is the cost of maintenance contracts. Tech support
provided by large vendors is usually good or excellent but it costs money. Also due to the
level of complexity (or more correctly level of overcomplexity ;-) for some tasks you need
expensive consultants and those costs in five-ten years can run to the level comparable with the
cost of the license (see below).
Overcomplexity. Often smaller and medium size companies do not want all the "Christmas
tree" of features and wants slimmer, more flexible and more focused on their needs product. They
also cannot afford using expensive consultants on a regular basis (which is often the way Tivoli
is deployed and maintained so upfront costs is just the tip of the iceberg). Due to IT outsourcing
it is not clear if usage of consultant is the best path as in the absence of loyal staff there is
not countervailing force in complex technical negotiations and company are bound to overpay or buy
unnecessary services and solutions. I know several companies that use TEC but paradoxically do not
have specialists to write rules for TEC (TEC uses
Prolog as a rules language). That situation makes TEC inferior to simpler packages. Also
there are companies which use Tivoli monitoring exclusively to monitor disk space on the servers
the way even a simple Perl script that runs via cron can accomplish much better. In this case money
were wasted for tool that is used for tiny fraction of capacity.
Absence of insurance in case of abrupt changes of the course by the vendor. Tivoli users now understand that the fact the TEC is a close source can cost them substantial amount of money. Even if they do not want to move to Micromuse style solution IBM will drag them kicking and screaming. That would be good if the new solution is a clearly superior to the old. But this is not the case.
If you are designing a monitoring solution you need to solve almost a dozen of pretty complex design problem. The ingenuity and flexibility the solution for each of those problems represent the quality of architecture. Among those that we consider the most important are:
Often the interface with the "mothership" is delegated to a special agent (adapter in Tivoli
terminology) which contains all the complex machinery necessary for transmission of event
to the event server using some secure or not very secure protocol. In this case probes communicate
with the agent. In the simplest case it can be syslogd daemon, SMTP daemon of simple HTTP-client
(id HTTP is used for communication with the mothership.
In the simplest case the agent can be a stand alone executable that is invoked by each probe via pipe ("send event" type of the agent). In this case HTML/XML based protocols are natural (albeit more complex and more difficult to parse then necessary), although SMTP-style keyword-value pairs are also pretty competitive and much simpler. The only problem is long, multiline values, but here the boxy of smtp message can be used instead of extended headers. Unix also provides the necessary syntax in "here" documents.
For efficiency an agent can be coded in C, although on modern machines this is not strictly necessary. In case of HTML any command like browser like lynx can be used as a "poor man agent". In this case the communication with the server needs to be organized via forms.
I would like to stress that SMTP mail, as imperfect as it is, proved to be a viable communication
channel for transmitting events from probes to the "mothership" and then distributing them to interested
parties.
One simple and effective way of aggregation is converting events into "tickets": groups of events
that corresponds to a serviceable entity (for example a server)
Those question make sense for users too: if you are able to answer those questions for a particular monitoring solution that means that you pretty much understand the particular system architecture.
Not all components of the architecture need to be implemented. The most essential are probes. At the beginning everything else can be reused via available subsystems/protocols. Typically the first probe implemented and monitoring disk free space ;-) But even is you run pretty complex applications (for example LAMP stack) you can assemble your own monitoring solution just by integrating of ssh, custom shell/Perl/Python scripts (some can be adapted from existing solutions, for example from mon) and Apache server. Basic HTML tables serve well in this respect as a simple but effective dashboard, and are easy to generate, especially from Perl. SSH proved to adequate as a agent and data delivery mechanism. You can even run proves via ssh (so called agentless solution), but this solution has an obvious drawback in comparison from running the from cron -- if the server is overloaded of ssh daemon malfunctions the only thing you can say that you can't connect. But other protocols such as syslog might still be operative and prove that use them can still deliver useful information. If you run you probes from say /etc/cron.hourly (very few probes need to be run more often because in large organization, like in dinosaurs, the reaction is very slow, and nothing can be done in less then an hour ;-) you can automatically switch to syslog delivery if for example you ssh delivery does not work. Such adaptive delivery mechanism when the best channel of delivery of "tick" information is determined on the fly is more resilient.
The simples script that can run probes sequentially and can be called from cron can look something like this:
let $POLLING_INTERVAL=60 # 1 minute sleeping interval between probes.
for probe in /usr/local/monitor/probes/* ; do
$probe >> /tmp/probe_dir/tick # execute probe and send output to a named pipe
sleep $POLLING_INTERVAL # sleep interval should be specified in seconds
done
scp /tmp/probe_dir/tick $LOGHOST/tmp/probes_collector/$HOSTNAME
Another approach is to "inject" each server local crontab with necessary entries once a day and rely on local atd daemon for scheduling. This offloads large part of scheduling load from the "mothership" and at the same time has enough flexibility (some local cron scripts can be mini-schedulers in their own right).
As for representation of the results on the "mothership" server, typically local probes can be made capable generating HTML and submitting it as reply to some form to the Web server running on the mothership, which performs additional rendering and maintenance of history, trends, etc (see finance.yahoo.com for inspiration). Creating a convenient event viewer and dashboard is a larger and more complex task, but basic functionality can achieved without too much effort using apache, off-the shelf SMTP email Web browser (used as event viewer) and some SCI scripts. Again adaptability and programmability are much more important then fancy capabilities.
|
Adaptability and programmability are much more important then fancy capabilities. |
For example you can write a Perl script that generates a HTML table which contains the status of your devices. In such a table color bars can represent the status of the server ( for example, Green=GOOD : Yellow=LATENCY >100ms : Red=UNREACHABLE). See Set up customized network monitoring with Perl. I actually like very much the design of finance.yahoo.com interface and consider it to be a good prototype for generic system monitoring, as it is customizable and fits the need of server monitoring reasonably well. For example, the concept of portfolios is directly transferable to the concept of groups of servers or locations.
Similarly any Web-mail implementation represents an almost complete implementation of the event log. If it is written in a scripting language it can be gradually adapted to the needs (instead of trying to reinvent the bicycle and writing the event log software from scratch). I would like to reiterate it again that this is a very strong argument for SMTP-based or SMTP compatible/convertible structure of events, for example, sequence of lines with structure
keyword: value
until blank line and then text part of the message.
Using paradigm of small reusable components are the key to creation of flexible monitoring system. Even in Windows environment you now can do wonders using Cygwin, or free Microsoft analog called "Linux for Windows" ( SFU 3.5. ). SSH solves pretty complex problem of component delivery and updates over secure channel, so other things equal it might be preferable to installation of often buggy and insecure (and that includes many misconfigured Tivoli installations) local agents. Actually this is not completely true: local installation of Perl can serve as a very powerful local agent with probes scripts sending information, for example to Web server. And Perl is installed by default on all major Unixes and Linux. In the most primitive way refreshing of information from probes can be implemented as automatic refresh of HTML pages in frames. But there are multiple open source monitoring packages were people worked on refining those ideas for several years and you need critically analyze them and select the package that is most suitable for you.
Still simplicity pays great dividends in monitoring as you can add your own customarization with much less efforts.
|
Simplicity pays great dividends in monitoring as you can add your own customarization with much less efforts and without spending inordinate amount of time studying obscure details of excessively complex architecture |
I would recommend to start with a very simple package written in Perl (which every sysadmin should know ;-) and later when you get understanding of issues and compromises inherent in the design of monitoring for your particular environment (which can deviate from a typical in a number of ways) you can move up in complexity. Return on investment in fancy graphs is usually less then expected after first two or three days (outside presentations to executives), but your mileage may vary. If you need graphic output then you definitely need a more complex package that does the necessary heavy lifting for you. It does not make much sense to reinvent the bicycle again and again but in case you need usually a spreadsheet has the ability to create complex graphs from tables and some spreadsheets are highly programmable.
| I would recommend to start with a very simple package written in Perl (which every Unix sysadmin should know ;-) and later when you get understanding of issues and compromises inherent in the design you can move up in complexity. |
Open source packages show great promise in monitoring and in my opinion can compete with packages from traditional vendors in small and medium size enterprise space. The only problematic area is the correlation of events but even here you can do quite a lot by simply using capabilities of manipulation of "event window" by any SQL database (preferably memory based database).
The key question of adopting an open source package is deciding whether it can satisfy you r needs and have architecture that you consider logical enough to work with. This requirement translates into amount of time and patience necessary to evaluate them. I hope that this page (and relevant subpages) might provide some starting points and hints on where to look. Also with AJAX the flexibility and quality of open source Web server based monitoring consoles dramatically increased. Again, for the capabilities of the AJAX technology you can look at finance.yahoo.com.
Even if the company anticipates getting a commercial product, creating a prototype using an open source tools might pay off in the major way, giving the ability to cut though the thick layer of vendor hype into the actual capabilities of a particular commercial application. Even in production environment the simplicity and flexibility can compensate for less polished interface and lack of certain more complex capabilities, so I would like to stress it again that in this area open source tools looks very competitive to complex and expensive commercial tools like Tivoli.
The tales about overcomplexity of Tivoli product line are simply legendary and we will not repeat them here. But one lesson emerges: simple applications can complete with very complex commercial monitoring solutions for one simple reason: overcomplexity undermines both reliability and flexibility, the two major criteria for monitoring application. Consider criteria for the monitoring application to be close to criteria for the handguns or rifles: it should not jam in sand and water.
|
Overcomplexity undermines both reliability and flexibility |
If you use ticker based architecture in which individual probes run from cron script on each individual server and push "ticks" to the "mothership" (typically LOGHOST server) were it is process by special "electrocardiogram" script each hour (or each 15 min if you inpatient ;-), you can write a usable variant with half a dozen of most useful checks (uptime check for overload, DF check for missing mounts and free space, log check for strange of too many messages per interval, check of status for a couple of critical daemons, and a couple of others) in say 40-80 hours in shell. Probably less if you use Perl (you can also use both writing probes in shell and electrocardiogram script in Perl). Probes are generally should be written in uniform style and use common library of functions. This is easier done in Perl but if the server is heavily loaded such probes might not run. ticks can be displayed via web server, providing a primitive dashboard.
If you are good programmer you probably can write such system in one evening, but as Russians say The appetite comes during a meal… and this system need to evolve for at least a week to be really usable and satisfy real needs. BTW to write a good, flexible "filesystem free space' script is a real challenge, despite the fact that the task is really simple. The simplest way to start might be to rely on individual "per server" manifests (edited outputs of df from the server), which specify which filesystems to check and what are upper limits and one "universal" config file which deals with default percentages that are uniform across the servers.
There are several interesting open source monitoring products each of which tries "to reinvent the bicycle" in a different way (and/or convert it into moped ;-) by adding heartbeat, graphic and statistical packages, AJAX, improving the security and storing events in backend database. But again the essence of monitoring is reliability and flexibility, not necessary the availability of eye popping excel-style graphs.
Monitoring Unix system is a tool by sysadmins for sysadmins and should be useful primarily for this purpose, not for the occasional demonstration to the vice-president for the IT of the particular company. That means that even within open source monitoring system not all systems belong to the same category and we need to distinguish between them based both on the implementation language and complexity of the codebase.
Like in boxing there should be several categories (usage of scripting language and the size of codebase if the main create used here):
| Weight | Examples |
|---|---|
| Featherweight | mon (Perl) |
| Lightweight | Spong (Perl) |
| Middleweight | Big Sister (Perl) |
| Super middleweight | OpenSMART (Perl), ZABBIX (PHP, C, agent and agentless) |
| Light heavyweight | Nagios (C, agentless, primitive agent support), OpenNMS (Java) |
| Heavyweight | Tivoli (old line of products in mostly mainly C++, new line is mostly Java), OpenView, Unicenter |
One very useful feature is the concept of server groups -- servers that have similar characteristics. That gives you an ability to perform group probes and/or configuration files changes for the whole group as a single operation. Groups are actually sets and standard set operations can be performed on them. For example HTTP servers evolved into highly specialized class of servers and can benefit from less generic scripts to monitor key components, but in your organization the can belong to a larger group of RHEL 6.8 servers. The same is true for DNS servers, mail servers and database servers.
Another useful feature is hierarchical HTML pages layout that provides a nice general picture (in most primitive form using 3-5 animated icons for "big picture" (OK, warnings, problems, serious problems, dead) with the ability of more detailed multilevel drilling "in depth" for each icon. Generic groupings of servers can include, for example:
the first level icons are displaying a general health picture composed of server groups
the second level displaying a specific server group information
the third level is an individual server level
the fourth level is individual sensor (CPU, disk space, etc)/script level.
Dr. Nikolai Bezroukov
|
|
Switchboard | ||||
| Latest | |||||
| Past week | |||||
| Past month | |||||
| Always listen to experts. They'll tell you what can't be done, and why. Then
do it.
-- Robert Heinlein |
May 21, 2020 | www.tecmint.com
Watchman – A File and Directory Watching Tool for Changes
by Aaron Kili | Published: March 14, 2019 | Last Updated: April 7, 2020
Linux Certifications - RHCSA / RHCE Certification | Ansible Automation Certification | LFCS / LFCE Certification Watchman is an open source and cross-platform file watching service that watches files and records or performs actions when they change. It is developed by Facebook and runs on Linux, OS X, FreeBSD, and Solaris. It runs in a client-server model and employs the inotify utility of the Linux kernel to provide a more powerful notification.Useful Concepts of Watchman
- It recursively watches watch one or more directory trees.
- Each watched directory is called a root.
- It can be configured via the command-line or a configuration file written in JSON format.
- It records changes to log files.
- Supports subscription to file changes that occur in a root.
- Allows you to query a root for file changes since you last checked, or the current state of the tree.
- It can watch an entire project.
In this article, we will explain how to install and use watchman to watch (monitor) files and record when they change in Linux. We will also briefly demonstrate how to watch a directory and invoke a script when it changes.
Installing Watchman File Watching Service in LinuxWe will install watchman service from sources, so first install these required dependencies libssl-dev , autoconf , automake libtool , setuptools , python-devel and libfolly using following command on your Linux distribution.
----------- On Debian/Ubuntu -----------
$ sudo apt install autoconf automake build-essential python-setuptools python-dev libssl-dev libtool

----------- On RHEL/CentOS -----------
# yum install autoconf automake python-setuptools python-devel openssl-devel libssl-devel libtool
# yum groupinstall 'Development Tools'

----------- On Fedora -----------
$ sudo dnf install autoconf automake python-setuptools openssl-devel libssl-devel libtool
$ sudo dnf groupinstall 'Development Tools'
Once required dependencies installed, you can start building watchman by downloading its github repository, move into the local repository, configure, build and install it using following commands.
$ git clone https://github.com/facebook/watchman.git
$ cd watchman
$ git checkout v4.9.0
$ ./autogen.sh
$ ./configure
$ make
$ sudo make install
Watching Files and Directories with Watchman in LinuxWatchman can be configured in two ways: (1) via the command-line while the daemon is running in background or (2) via a configuration file written in JSON format.
To watch a directory (e.g
~/bin) for changes, run the following command.$ watchman watch ~/bin/<img aria-describedby="caption-attachment-32120" src="https://www.tecmint.com/wp-content/uploads/2019/03/watch-a-directory.png" alt="Watch a Directory in Linux" width="572" height="135" />
Watch a Directory in Linux
The following command writes a configuration file called
stateunder /usr/local/var/run/watchman/<username>-state/ , in JSON format as well as a log file calledlogin the same location.You can view the two files using the cat command as show.
$ cat /usr/local/var/run/watchman/aaronkilik-state/state
$ cat /usr/local/var/run/watchman/aaronkilik-state/log
You can also define what action to trigger when a directory being watched for changes. For example in the following command, '
test-trigger' is the name of the trigger and~bin/pav.shis the script that will be invoked when changes are detected in the directory being monitored.For test purposes, the
pav.shscript simply creates a file with a timestamp (i.efile.$time.txt) within the same directory where the script is stored.time=`date +%Y-%m-%d.%H:%M:%S` touch file.$time.txtSave the file and make the script executable as shown.
$ chmod +x ~/bin/pav.shTo launch the trigger, run the following command.
$ watchman -- trigger ~/bin 'test-trigger' -- ~/bin/pav.sh<img aria-describedby="caption-attachment-32121" src="https://www.tecmint.com/wp-content/uploads/2019/03/create-a-trigger.png" alt="Create a Trigger on Directory" width="842" height="135" srcset="https://www.tecmint.com/wp-content/uploads/2019/03/create-a-trigger.png 842w, https://www.tecmint.com/wp-content/uploads/2019/03/create-a-trigger-768x123.png 768w" sizes="(max-width: 842px) 100vw, 842px" />
Create a Trigger on Directory
When you execute watchman to keep an eye on a directory, its added to the watch list and to view it, run the following command.
$ watchman watch-list<img aria-describedby="caption-attachment-32122" src="https://www.tecmint.com/wp-content/uploads/2019/03/view-watch-list.png" alt="View Watch List " width="572" height="173" />
View Watch List
To view the trigger list for a root , run the following command (replace
~/binwith therootname).$ watchman trigger-list ~/bin<img aria-describedby="caption-attachment-32124" src="https://www.tecmint.com/wp-content/uploads/2019/03/show-trigger-list-for-a-root.png" alt="Show Trigger List for a Root" width="612" height="401" />
Show Trigger List for a Root
Based on the above configuration, each time the
~/bindirectory changes, a file such asfile.2019-03-13.23:14:17.txtis created inside it and you can view them using ls command .$ ls<img aria-describedby="caption-attachment-32123" src="https://www.tecmint.com/wp-content/uploads/2019/03/test-watchman-configuration.png" alt="Test Watchman Configuration" width="672" height="648" />
Test Watchman Configuration Uninstalling Watchman Service in Linux
If you want to uninstall watchman , move into the source directory and run the following commands:
$ sudo make uninstall
$ cd '/usr/local/bin' && rm -f watchman
$ cd '/usr/local/share/doc/watchman-4.9.0 ' && rm -f README.markdown
For more information, visit the Watchman Github repository: https://github.com/facebook/watchman .
You might also like to read these following related articles.
- Swatchdog – Simple Log File Watcher in Real-Time in Linux
- 4 Ways to Watch or Monitor Log Files in Real Time
- fswatch – Monitors Files and Directory Changes in Linux
- Pyintify – Monitor Filesystem Changes in Real Time in Linux
- Inav – Watch Apache Logs in Real Time in Linux
Watchman is an open source file watching service that watches files and records, or triggers actions, when they change. Use the feedback form below to ask questions or share your thoughts with us.
Sharing is Caring...
Mar 23, 2020 | linuxconfig.org
In this tutorial you will learn:
- How to install NRPE on Debian/Red Hat based distributions
- How to configure NRPE to accept commands from the server
- How to configure a custom check on the server and client side
Nov 08, 2019 | opensource.com
Common types of alerts and visualizations Alerts
Let's first cover what alerts are not . Alerts should not be sent if the human responder can't do anything about the problem. This includes alerts that are sent to multiple individuals with only a few who can respond, or situations where every anomaly in the system triggers an alert. This leads to alert fatigue and receivers ignoring all alerts within a specific medium until the system escalates to a medium that isn't already saturated.
For example, if an operator receives hundreds of emails a day from the alerting system, that operator will soon ignore all emails from the alerting system. The operator will respond to a real incident only when he or she is experiencing the problem, emailed by a customer, or called by the boss. In this case, alerts have lost their meaning and usefulness.
Alerts are not a constant stream of information or a status update. They are meant to convey a problem from which the system can't automatically recover, and they are sent only to the individual most likely to be able to recover the system. Everything that falls outside this definition isn't an alert and will only damage your employees and company culture.
Everyone has a different set of alert types, so I won't discuss things like priority levels (P1-P5) or models that use words like "Informational," "Warning," and "Critical." Instead, I'll describe the generic categories emergent in complex systems' incident response.
You might have noticed I mentioned an "Informational" alert type right after I wrote that alerts shouldn't be informational. Well, not everyone agrees, but I don't consider something an alert if it isn't sent to anyone. It is a data point that many systems refer to as an alert. It represents some event that should be known but not responded to. It is generally part of the visualization system of the alerting tool and not an event that triggers actual notifications. Mike Julian covers this and other aspects of alerting in his book Practical Monitoring . It's a must read for work in this area.
Non-informational alerts consist of types that can be responded to or require action. I group these into two categories: internal outage and external outage. (Most companies have more than two levels for prioritizing their response efforts.) Degraded system performance is considered an outage in this model, as the impact to each user is usually unknown.
Internal outages are a lower priority than external outages, but they still need to be responded to quickly. They often include internal systems that company employees use or components of applications that are visible only to company employees.
External outages consist of any system outage that would immediately impact a customer. These don't include a system outage that prevents releasing updates to the system. They do include customer-facing application failures, database outages, and networking partitions that hurt availability or consistency if either can impact a user. They also include outages of tools that may not have a direct impact on users, as the application continues to run but this transparent dependency impacts performance. This is common when the system uses some external service or data source that isn't necessary for full functionality but may cause delays as the application performs retries or handles errors from this external dependency.
VisualizationsThere are many visualization types, and I won't cover them all here. It's a fascinating area of research. On the data analytics side of my career, learning and applying that knowledge is a constant challenge. We need to provide simple representations of complex system outputs for the widest dissemination of information. Google Charts and Tableau have a wide selection of visualization types. We'll cover the most common visualizations and some innovative solutions for quickly understanding systems.
Line chartThe line chart is probably the most common visualization. It does a pretty good job of producing an understanding of a system over time. A line chart in a metrics system would have a line for each unique metric or some aggregation of metrics. This can get confusing when there are a lot of metrics in the same dashboard (as shown below), but most systems can select specific metrics to view rather than having all of them visible. Also, anomalous behavior is easy to spot if it's significant enough to escape the noise of normal operations. Below we can see purple, yellow, and light blue lines that might indicate anomalous behavior.
monitoring_guide_line_chart.pngAnother feature of a line chart is that you can often stack them to show relationships. For example, you might want to look at requests on each server individually, but also in aggregate. This allows you to understand the overall system as well as each instance in the same graph.
monitoring_guide_line_chart_aggregate.png HeatmapsAnother common visualization is the heatmap. It is useful when looking at histograms. This type of visualization is similar to a bar chart but can show gradients within the bars representing the different percentiles of the overall metric. For example, suppose you're looking at request latencies and you want to quickly understand the overall trend as well as the distribution of all requests. A heatmap is great for this, and it can use color to disambiguate the quantity of each section with a quick glance.
The heatmap below shows the higher concentration around the centerline of the graph with an easy-to-understand visualization of the distribution vertically for each time bucket. We might want to review a couple of points in time where the distribution gets wide while the others are fairly tight like at 14:00. This distribution might be a negative performance indicator.
monitoring_guide_histogram.png GaugesThe last common visualization I'll cover here is the gauge, which helps users understand a single metric quickly. Gauges can represent a single metric, like your speedometer represents your driving speed or your gas gauge represents the amount of gas in your car. Similar to the gas gauge, most monitoring gauges clearly indicate what is good and what isn't. Often (as is shown below), good is represented by green, getting worse by orange, and "everything is breaking" by red. The middle row below shows traditional gauges.
monitoring_guide_gauges.png Image source: Grafana.org (© Grafana Labs)This image shows more than just traditional gauges. The other gauges are single stat representations that are similar to the function of the classic gauge. They all use the same color scheme to quickly indicate system health with just a glance. Arguably, the bottom row is probably the best example of a gauge that allows you to glance at a dashboard and know that everything is healthy (or not). This type of visualization is usually what I put on a top-level dashboard. It offers a full, high-level understanding of system health in seconds.
Flame graphsA less common visualization is the flame graph, introduced by Netflix's Brendan Gregg in 2011. It's not ideal for dashboarding or quickly observing high-level system concerns; it's normally seen when trying to understand a specific application problem. This visualization focuses on CPU and memory and the associated frames. The X-axis lists the frames alphabetically, and the Y-axis shows stack depth. Each rectangle is a stack frame and includes the function being called. The wider the rectangle, the more it appears in the stack. This method is invaluable when trying to diagnose system performance at the application level and I urge everyone to give it a try.
monitoring_guide_flame_graph.png Image source: Wikimedia.org ( Creative Commons BY SA 3.0 ) Tool optionsThere are several commercial options for alerting, but since this is Opensource.com, I'll cover only systems that are being used at scale by real companies that you can use at no cost. Hopefully, you'll be able to contribute new and innovative features to make these systems even better.
Alerting tools BosunIf you've ever done anything with computers and gotten stuck, the help you received was probably thanks to a Stack Exchange system. Stack Exchange runs many different websites around a crowdsourced question-and-answer model. Stack Overflow is very popular with developers, and Super User is popular with operations. However, there are now hundreds of sites ranging from parenting to sci-fi and philosophy to bicycles.
Stack Exchange open-sourced its alert management system, Bosun , around the same time Prometheus and its AlertManager system were released. There were many similarities in the two systems, and that's a really good thing. Like Prometheus, Bosun is written in Golang. Bosun's scope is more extensive than Prometheus' as it can interact with systems beyond metrics aggregation. It can also ingest data from log and event aggregation systems. It supports Graphite, InfluxDB, OpenTSDB, and Elasticsearch.
Bosun's architecture consists of a single server binary, a backend like OpenTSDB, Redis, and scollector agents . The scollector agents automatically detect services on a host and report metrics for those processes and other system resources. This data is sent to a metrics backend. The Bosun server binary then queries the backends to determine if any alerts need to be fired. Bosun can also be used by tools like Grafana to query the underlying backends through one common interface. Redis is used to store state and metadata for Bosun.
A really neat feature of Bosun is that it lets you test your alerts against historical data. This was something I missed in Prometheus several years ago, when I had data for an issue I wanted alerts on but no easy way to test it. To make sure my alerts were working, I had to create and insert dummy data. This system alleviates that very time-consuming process.
Bosun also has the usual features like showing simple graphs and creating alerts. It has a powerful expression language for writing alerting rules. However, it only has email and HTTP notification configurations, which means connecting to Slack and other tools requires a bit more customization ( which its documentation covers ). Similar to Prometheus, Bosun can use templates for these notifications, which means they can look as awesome as you want them to. You can use all your HTML and CSS skills to create the baddest email alert anyone has ever seen.
CabotCabot was created by a company called Arachnys . You may not know who Arachnys is or what it does, but you have probably felt its impact: It built the leading cloud-based solution for fighting financial crimes. That sounds pretty cool, right? At a previous company, I was involved in similar functions around "know your customer" laws. Most companies would consider it a very bad thing to be linked to a terrorist group, for example, funneling money through their systems. These solutions also help defend against less-atrocious offenders like fraudsters who could also pose a risk to the institution.
So why did Arachnys create Cabot? Well, it is kind of a Christmas present to everyone, as it was a Christmas project built because its developers couldn't wrap their heads around Nagios . And really, who can blame them? Cabot was written with Django and Bootstrap, so it should be easy for most to contribute to the project. (Another interesting factoid: The name comes from the creator's dog.)
The Cabot architecture is similar to Bosun in that it doesn't collect any data. Instead, it accesses data through the APIs of the tools it is alerting for. Therefore, Cabot uses a pull (rather than a push) model for alerting. It reaches out into each system's API and retrieves the information it needs to make a decision based on a specific check. Cabot stores the alerting data in a Postgres database and also has a cache using Redis.
Cabot natively supports Graphite , but it also supports Jenkins , which is rare in this area. Arachnys uses Jenkins like a centralized cron, but I like this idea of treating build failures like outages. Obviously, a build failure isn't as critical as a production outage, but it could still alert the team and escalate if the failure isn't resolved. Who actually checks Jenkins every time an email comes in about a build failure? Yeah, me too!
Another interesting feature is that Cabot can integrate with Google Calendar for on-call rotations. Cabot calls this feature Rota, which is a British term for a roster or rotation. This makes a lot of sense, and I wish other systems would take this idea further. Cabot doesn't support anything more complex than primary and backup personnel, but there is certainly room for additional features. The docs say if you want something more advanced, you should look at a commercial option.
StatsAggStatsAgg ? How did that make the list? Well, it's not every day you come across a publishing company that has created an alerting platform. I think that deserves recognition. Of course, Pearson isn't just a publishing company anymore; it has several web presences and a joint venture with O'Reilly Media . However, I still think of it as the company that published my schoolbooks and tests.
StatsAgg isn't just an alerting platform; it's also a metrics aggregation platform. And it's kind of like a proxy for other systems. It supports Graphite, StatsD, InfluxDB, and OpenTSDB as inputs, but it can also forward those metrics to their respective platforms. This is an interesting concept, but potentially risky as loads increase on a central service. However, if the StatsAgg infrastructure is robust enough, it can still produce alerts even when a backend storage platform has an outage.
StatsAgg is written in Java and consists only of the main server and UI, which keeps complexity to a minimum. It can send alerts based on regular expression matching and is focused on alerting by service rather than host or instance. Its goal is to fill a void in the open source observability stack, and I think it does that quite well.
Visualization tools GrafanaAlmost everyone knows about Grafana , and many have used it. I have used it for years whenever I need a simple dashboard. The tool I used before was deprecated, and I was fairly distraught about that until Grafana made it okay. Grafana was gifted to us by Torkel Ödegaard. Like Cabot, Grafana was also created around Christmastime, and released in January 2014. It has come a long way in just a few years. It started life as a Kibana dashboarding system, and Torkel forked it into what became Grafana.
Grafana's sole focus is presenting monitoring data in a more usable and pleasing way. It can natively gather data from Graphite, Elasticsearch, OpenTSDB, Prometheus, and InfluxDB. There's an Enterprise version that uses plugins for more data sources, but there's no reason those other data source plugins couldn't be created as open source, as the Grafana plugin ecosystem already offers many other data sources.
What does Grafana do for me? It provides a central location for understanding my system. It is web-based, so anyone can access the information, although it can be restricted using different authentication methods. Grafana can provide knowledge at a glance using many different types of visualizations. However, it has started integrating alerting and other features that aren't traditionally combined with visualizations.
Now you can set alerts visually. That means you can look at a graph, maybe even one showing where an alert should have triggered due to some degradation of the system, click on the graph where you want the alert to trigger, and then tell Grafana where to send the alert. That's a pretty powerful addition that won't necessarily replace an alerting platform, but it can certainly help augment it by providing a different perspective on alerting criteria.
Grafana has also introduced more collaboration features. Users have been able to share dashboards for a long time, meaning you don't have to create your own dashboard for your Kubernetes cluster because there are several already available -- with some maintained by Kubernetes developers and others by Grafana developers.
The most significant addition around collaboration is annotations. Annotations allow a user to add context to part of a graph. Other users can then use this context to understand the system better. This is an invaluable tool when a team is in the middle of an incident and communication and common understanding are critical. Having all the information right where you're already looking makes it much more likely that knowledge will be shared across the team quickly. It's also a nice feature to use during blameless postmortems when the team is trying to understand how the failure occurred and learn more about their system.
VizceralNetflix created Vizceral to understand its traffic patterns better when performing a traffic failover. Unlike Grafana, which is a more general tool, Vizceral serves a very specific use case. Netflix no longer uses this tool internally and says it is no longer actively maintained, but it still updates the tool periodically. I highlight it here primarily to point out an interesting visualization mechanism and how it can help solve a problem. It's worth running it in a demo environment just to better grasp the concepts and witness what's possible with these systems.
Nov 08, 2019 | opensource.com
Examining collected data
The output from the sar command can be detailed, or you can choose to limit the data displayed. For example, enter the
sarcommand with no options, which displays only aggregate CPU performance data. The sar command uses the current day by default, starting at midnight, so you should only see the CPU data for today.On the other hand, using the
sar -Acommand shows all of the data that has been collected for today. Enter thesar -A | lesscommand now and page through the output to view the many types of data collected by SAR, including disk and network usage, CPU context switches (how many times per second the CPU switched from one program to another), page swaps, memory and swap space usage, and much more. Use the man page for the sar command to interpret the results and to get an idea of the many options available. Many of those options allow you to view specific data, such as network and disk performance.I typically use the
sar -Acommand because many of the types of data available are interrelated, and sometimes I find something that gives me a clue to a performance problem in a section of the output that I might not have looked at otherwise. The-Aoption displays all of the collected data types.Look at the entire output of the
sar -A | lesscommand to get a feel for the type and amount of data displayed. Be sure to look at the CPU usage data as well as the processes started per second (proc/s) and context switches per second (cswch/s). If the number of context switches increases rapidly, that can indicate that running processes are being swapped off the CPU very frequently.You can limit the total amount of data to the total CPU activity with the
sar
    -u
command. Try that and notice that you only get the composite CPU data, not the data for the individual CPUs. Also try the-roption for memory, and-Sfor swap space. Combining these options so the following command will display CPU, memory, and swap space is also possible:sar -urSUsing the
-poption displays block device names for hard drives instead of the much more cryptic device identifiers, and-ddisplays only the block devices -- the hard drives. Issue the following command to view all of the block device data in a readable format using the names as they are found in the /dev directory:sar -dp | lessIf you want only data between certain times, you can use
-sand-eto define the start and end times, respectively. The following command displays all CPU data, both individual and aggregate for the time period between 7:50 AM and 8:11 AM today:sar -P ALL -s 07:50:00 -e 08:11:00Note that all times must be in 24-hour format. If you have multiple CPUs, each CPU is detailed individually, and the average for all CPUs is also given.
The next command uses the
-noption to display network statistics for all interfaces:sar -n ALL | lessData for previous daysData collected for previous days can also be examined by specifying the desired log file. Assume that today's date is September 3 and you want to see the data for yesterday, the following command displays all collected data for September 2. The last two digits of each file are the day of the month on which the data was collected:
sar -A -f /var/log/sa/sa02 | lessYou can use the command below, where
DDis the day of the month for yesterday:sar -A -f /var/log/sa/saDD | lessRealtime dataYou can also use SAR to display (nearly) realtime data. The following command displays memory usage in 5- second intervals for 10 iterations:
sar -r 5 10This is an interesting option for sar as it can provide a series of data points for a defined period of time that can be examined in detail and compared. The /proc filesystem All of this data for SAR and the system monitoring tools covered in my previous article must come from somewhere. Fortunately, all of that kernel data is easily available in the /proc filesystem. In fact, because the kernel performance data stored there is all in ASCII text format, it can be displayed using simple commands like
catso that the individual programs do not have to load their own kernel modules to collect it. This saves system resources and makes the data more accurate. SAR and the system monitoring tools I have discussed in my previous article all collect their data from the /proc filesystem.Note that /proc is a virtual filesystem and only exists in RAM while Linux is running. It is not stored on the hard drive.
Even though I won't get into detail, the /proc filesystem also contains the live kernel tuning parameters and variables. Thus you can change the kernel tuning by simply changing the appropriate kernel tuning variable in /proc; no reboot is required.
Change to the /proc directory and list the files there.You will see, in addition to the data files, a large quantity of numbered directories. Each of these directories represents a process where the directory name is the Process ID (PID). You can delve into those directories to locate information about individual processes that might be of interest.
To view this data, simply cat some of the following files:
cmdline-- displays the kernel command line, including all parameters passed to it.cpuinfo-- displays information about the CPU(s) including flags, model name stepping, and cache size.meminfo-- displays very detailed information about memory, including data such as active and inactive memory, and total virtual memory allocated and that used, that is not always displayed by other tools.iomemandioports-- lists the memory ranges and ports defined for various I/O devices.You will see that, although the data is available in these files, much of it is not annotated in any way. That means you will have work to do to identify and extract the desired data. However, the monitoring tools already discussed already do that for the data they are designed to display.
There is so much more data in the /proc filesystem that the best way to learn more about it is to refer to the proc(5) man page, which contains detailed information about the various files found there.
Next time I will pull all this together and discuss how I have used these tools to solve problems.
David Both - David Both is an Open Source Software and GNU/Linux advocate, trainer, writer, and speaker who lives in Raleigh North Carolina. He is a strong proponent of and evangelist for the "Linux Philosophy." David has been in the IT industry for nearly 50 years. He has taught RHCE classes for Red Hat and has worked at MCI Worldcom, Cisco, and the State of North Carolina. He has been working with Linux and Open Source Software for over 20 years.
Nov 07, 2019 | opensource.com
Common types of alerts and visualizations Alerts
Let's first cover what alerts are not . Alerts should not be sent if the human responder can't do anything about the problem. This includes alerts that are sent to multiple individuals with only a few who can respond, or situations where every anomaly in the system triggers an alert. This leads to alert fatigue and receivers ignoring all alerts within a specific medium until the system escalates to a medium that isn't already saturated.
For example, if an operator receives hundreds of emails a day from the alerting system, that operator will soon ignore all emails from the alerting system. The operator will respond to a real incident only when he or she is experiencing the problem, emailed by a customer, or called by the boss. In this case, alerts have lost their meaning and usefulness.
Alerts are not a constant stream of information or a status update. They are meant to convey a problem from which the system can't automatically recover, and they are sent only to the individual most likely to be able to recover the system. Everything that falls outside this definition isn't an alert and will only damage your employees and company culture.
Everyone has a different set of alert types, so I won't discuss things like priority levels (P1-P5) or models that use words like "Informational," "Warning," and "Critical." Instead, I'll describe the generic categories emergent in complex systems' incident response.
You might have noticed I mentioned an "Informational" alert type right after I wrote that alerts shouldn't be informational. Well, not everyone agrees, but I don't consider something an alert if it isn't sent to anyone. It is a data point that many systems refer to as an alert. It represents some event that should be known but not responded to. It is generally part of the visualization system of the alerting tool and not an event that triggers actual notifications. Mike Julian covers this and other aspects of alerting in his book Practical Monitoring . It's a must read for work in this area.
Non-informational alerts consist of types that can be responded to or require action. I group these into two categories: internal outage and external outage. (Most companies have more than two levels for prioritizing their response efforts.) Degraded system performance is considered an outage in this model, as the impact to each user is usually unknown.
Internal outages are a lower priority than external outages, but they still need to be responded to quickly. They often include internal systems that company employees use or components of applications that are visible only to company employees.
External outages consist of any system outage that would immediately impact a customer. These don't include a system outage that prevents releasing updates to the system. They do include customer-facing application failures, database outages, and networking partitions that hurt availability or consistency if either can impact a user. They also include outages of tools that may not have a direct impact on users, as the application continues to run but this transparent dependency impacts performance. This is common when the system uses some external service or data source that isn't necessary for full functionality but may cause delays as the application performs retries or handles errors from this external dependency.
VisualizationsThere are many visualization types, and I won't cover them all here. It's a fascinating area of research. On the data analytics side of my career, learning and applying that knowledge is a constant challenge. We need to provide simple representations of complex system outputs for the widest dissemination of information. Google Charts and Tableau have a wide selection of visualization types. We'll cover the most common visualizations and some innovative solutions for quickly understanding systems.
Line chartThe line chart is probably the most common visualization. It does a pretty good job of producing an understanding of a system over time. A line chart in a metrics system would have a line for each unique metric or some aggregation of metrics. This can get confusing when there are a lot of metrics in the same dashboard (as shown below), but most systems can select specific metrics to view rather than having all of them visible. Also, anomalous behavior is easy to spot if it's significant enough to escape the noise of normal operations. Below we can see purple, yellow, and light blue lines that might indicate anomalous behavior.
monitoring_guide_line_chart.pngAnother feature of a line chart is that you can often stack them to show relationships. For example, you might want to look at requests on each server individually, but also in aggregate. This allows you to understand the overall system as well as each instance in the same graph.
monitoring_guide_line_chart_aggregate.png HeatmapsAnother common visualization is the heatmap. It is useful when looking at histograms. This type of visualization is similar to a bar chart but can show gradients within the bars representing the different percentiles of the overall metric. For example, suppose you're looking at request latencies and you want to quickly understand the overall trend as well as the distribution of all requests. A heatmap is great for this, and it can use color to disambiguate the quantity of each section with a quick glance.
The heatmap below shows the higher concentration around the centerline of the graph with an easy-to-understand visualization of the distribution vertically for each time bucket. We might want to review a couple of points in time where the distribution gets wide while the others are fairly tight like at 14:00. This distribution might be a negative performance indicator.
monitoring_guide_histogram.png GaugesThe last common visualization I'll cover here is the gauge, which helps users understand a single metric quickly. Gauges can represent a single metric, like your speedometer represents your driving speed or your gas gauge represents the amount of gas in your car. Similar to the gas gauge, most monitoring gauges clearly indicate what is good and what isn't. Often (as is shown below), good is represented by green, getting worse by orange, and "everything is breaking" by red. The middle row below shows traditional gauges.
monitoring_guide_gauges.png Image source: Grafana.org (© Grafana Labs)This image shows more than just traditional gauges. The other gauges are single stat representations that are similar to the function of the classic gauge. They all use the same color scheme to quickly indicate system health with just a glance. Arguably, the bottom row is probably the best example of a gauge that allows you to glance at a dashboard and know that everything is healthy (or not). This type of visualization is usually what I put on a top-level dashboard. It offers a full, high-level understanding of system health in seconds.
Flame graphsA less common visualization is the flame graph, introduced by Netflix's Brendan Gregg in 2011. It's not ideal for dashboarding or quickly observing high-level system concerns; it's normally seen when trying to understand a specific application problem. This visualization focuses on CPU and memory and the associated frames. The X-axis lists the frames alphabetically, and the Y-axis shows stack depth. Each rectangle is a stack frame and includes the function being called. The wider the rectangle, the more it appears in the stack. This method is invaluable when trying to diagnose system performance at the application level and I urge everyone to give it a try.
monitoring_guide_flame_graph.png Image source: Wikimedia.org ( Creative Commons BY SA 3.0 ) Tool optionsThere are several commercial options for alerting, but since this is Opensource.com, I'll cover only systems that are being used at scale by real companies that you can use at no cost. Hopefully, you'll be able to contribute new and innovative features to make these systems even better.
Alerting tools BosunIf you've ever done anything with computers and gotten stuck, the help you received was probably thanks to a Stack Exchange system. Stack Exchange runs many different websites around a crowdsourced question-and-answer model. Stack Overflow is very popular with developers, and Super User is popular with operations. However, there are now hundreds of sites ranging from parenting to sci-fi and philosophy to bicycles.
Stack Exchange open-sourced its alert management system, Bosun , around the same time Prometheus and its AlertManager system were released. There were many similarities in the two systems, and that's a really good thing. Like Prometheus, Bosun is written in Golang. Bosun's scope is more extensive than Prometheus' as it can interact with systems beyond metrics aggregation. It can also ingest data from log and event aggregation systems. It supports Graphite, InfluxDB, OpenTSDB, and Elasticsearch.
Bosun's architecture consists of a single server binary, a backend like OpenTSDB, Redis, and scollector agents . The scollector agents automatically detect services on a host and report metrics for those processes and other system resources. This data is sent to a metrics backend. The Bosun server binary then queries the backends to determine if any alerts need to be fired. Bosun can also be used by tools like Grafana to query the underlying backends through one common interface. Redis is used to store state and metadata for Bosun.
A really neat feature of Bosun is that it lets you test your alerts against historical data. This was something I missed in Prometheus several years ago, when I had data for an issue I wanted alerts on but no easy way to test it. To make sure my alerts were working, I had to create and insert dummy data. This system alleviates that very time-consuming process.
Bosun also has the usual features like showing simple graphs and creating alerts. It has a powerful expression language for writing alerting rules. However, it only has email and HTTP notification configurations, which means connecting to Slack and other tools requires a bit more customization ( which its documentation covers ). Similar to Prometheus, Bosun can use templates for these notifications, which means they can look as awesome as you want them to. You can use all your HTML and CSS skills to create the baddest email alert anyone has ever seen.
CabotCabot was created by a company called Arachnys . You may not know who Arachnys is or what it does, but you have probably felt its impact: It built the leading cloud-based solution for fighting financial crimes. That sounds pretty cool, right? At a previous company, I was involved in similar functions around "know your customer" laws. Most companies would consider it a very bad thing to be linked to a terrorist group, for example, funneling money through their systems. These solutions also help defend against less-atrocious offenders like fraudsters who could also pose a risk to the institution.
So why did Arachnys create Cabot? Well, it is kind of a Christmas present to everyone, as it was a Christmas project built because its developers couldn't wrap their heads around Nagios . And really, who can blame them? Cabot was written with Django and Bootstrap, so it should be easy for most to contribute to the project. (Another interesting factoid: The name comes from the creator's dog.)
The Cabot architecture is similar to Bosun in that it doesn't collect any data. Instead, it accesses data through the APIs of the tools it is alerting for. Therefore, Cabot uses a pull (rather than a push) model for alerting. It reaches out into each system's API and retrieves the information it needs to make a decision based on a specific check. Cabot stores the alerting data in a Postgres database and also has a cache using Redis.
Cabot natively supports Graphite , but it also supports Jenkins , which is rare in this area. Arachnys uses Jenkins like a centralized cron, but I like this idea of treating build failures like outages. Obviously, a build failure isn't as critical as a production outage, but it could still alert the team and escalate if the failure isn't resolved. Who actually checks Jenkins every time an email comes in about a build failure? Yeah, me too!
Another interesting feature is that Cabot can integrate with Google Calendar for on-call rotations. Cabot calls this feature Rota, which is a British term for a roster or rotation. This makes a lot of sense, and I wish other systems would take this idea further. Cabot doesn't support anything more complex than primary and backup personnel, but there is certainly room for additional features. The docs say if you want something more advanced, you should look at a commercial option.
StatsAggStatsAgg ? How did that make the list? Well, it's not every day you come across a publishing company that has created an alerting platform. I think that deserves recognition. Of course, Pearson isn't just a publishing company anymore; it has several web presences and a joint venture with O'Reilly Media . However, I still think of it as the company that published my schoolbooks and tests.
StatsAgg isn't just an alerting platform; it's also a metrics aggregation platform. And it's kind of like a proxy for other systems. It supports Graphite, StatsD, InfluxDB, and OpenTSDB as inputs, but it can also forward those metrics to their respective platforms. This is an interesting concept, but potentially risky as loads increase on a central service. However, if the StatsAgg infrastructure is robust enough, it can still produce alerts even when a backend storage platform has an outage.
StatsAgg is written in Java and consists only of the main server and UI, which keeps complexity to a minimum. It can send alerts based on regular expression matching and is focused on alerting by service rather than host or instance. Its goal is to fill a void in the open source observability stack, and I think it does that quite well.
Visualization tools GrafanaAlmost everyone knows about Grafana , and many have used it. I have used it for years whenever I need a simple dashboard. The tool I used before was deprecated, and I was fairly distraught about that until Grafana made it okay. Grafana was gifted to us by Torkel Ödegaard. Like Cabot, Grafana was also created around Christmastime, and released in January 2014. It has come a long way in just a few years. It started life as a Kibana dashboarding system, and Torkel forked it into what became Grafana.
Grafana's sole focus is presenting monitoring data in a more usable and pleasing way. It can natively gather data from Graphite, Elasticsearch, OpenTSDB, Prometheus, and InfluxDB. There's an Enterprise version that uses plugins for more data sources, but there's no reason those other data source plugins couldn't be created as open source, as the Grafana plugin ecosystem already offers many other data sources.
What does Grafana do for me? It provides a central location for understanding my system. It is web-based, so anyone can access the information, although it can be restricted using different authentication methods. Grafana can provide knowledge at a glance using many different types of visualizations. However, it has started integrating alerting and other features that aren't traditionally combined with visualizations.
Now you can set alerts visually. That means you can look at a graph, maybe even one showing where an alert should have triggered due to some degradation of the system, click on the graph where you want the alert to trigger, and then tell Grafana where to send the alert. That's a pretty powerful addition that won't necessarily replace an alerting platform, but it can certainly help augment it by providing a different perspective on alerting criteria.
Grafana has also introduced more collaboration features. Users have been able to share dashboards for a long time, meaning you don't have to create your own dashboard for your Kubernetes cluster because there are several already available -- with some maintained by Kubernetes developers and others by Grafana developers.
The most significant addition around collaboration is annotations. Annotations allow a user to add context to part of a graph. Other users can then use this context to understand the system better. This is an invaluable tool when a team is in the middle of an incident and communication and common understanding are critical. Having all the information right where you're already looking makes it much more likely that knowledge will be shared across the team quickly. It's also a nice feature to use during blameless postmortems when the team is trying to understand how the failure occurred and learn more about their system.
VizceralNetflix created Vizceral to understand its traffic patterns better when performing a traffic failover. Unlike Grafana, which is a more general tool, Vizceral serves a very specific use case. Netflix no longer uses this tool internally and says it is no longer actively maintained, but it still updates the tool periodically. I highlight it here primarily to point out an interesting visualization mechanism and how it can help solve a problem. It's worth running it in a demo environment just to better grasp the concepts and witness what's possible with these systems.
Nov 06, 2019 | www.linuxjournal.com
A common pitfall sysadmins run into when setting up monitoring systems is to alert on too many things. These days, it's simple to monitor just about any aspect of a server's health, so it's tempting to overload your monitoring system with all kinds of system checks. One of the main ongoing maintenance tasks for any monitoring system is setting appropriate alert thresholds to reduce false positives. This means the more checks you have in place, the higher the maintenance burden. As a result, I have a few different rules I apply to my monitoring checks when determining thresholds for notifications.
Critical alerts must be something I want to be woken up about at 3am.
A common cause of sysadmin burnout is being woken up with alerts for systems that don't matter. If you don't have a 24x7 international development team, you probably don't care if the build server has a problem at 3am, or even if you do, you probably are going to wait until the morning to fix it. By restricting critical alerts to just those systems that must be online 24x7, you help reduce false positives and make sure that real problems are addressed quickly.
Critical alerts must be actionable.
Some organizations send alerts when just about anything happens on a system. If I'm being woken up at 3am, I want to have a specific action plan associated with that alert so I can fix it. Again, too many false positives will burn out a sysadmin that's on call, and nothing is more frustrating than getting woken up with an alert that you can't do anything about. Every critical alert should have an obvious action plan the sysadmin can follow to fix it.
Warning alerts tell me about problems that will be critical if I don't fix them.
There are many problems on a system that I may want to know about and may want to investigate, but they aren't worth getting out of bed at 3am. Warning alerts don't trigger a pager, but they still send me a quieter notification. For instance, if load, used disk space or RAM grows to a certain point where the system is still healthy but if left unchecked may not be, I get a warning alert so I can investigate when I get a chance. On the other hand, if I got only a warning alert, but the system was no longer responding, that's an indication I may need to change my alert thresholds.
Repeat warning alerts periodically.
I think of warning alerts like this thing nagging at you to look at it and fix it during the work day. If you send warning alerts too frequently, they just spam your inbox and are ignored, so I've found that spacing them out to alert every hour or so is enough to remind me of the problem but not so frequent that I ignore it completely.
Everything else is monitored, but doesn't send an alert.
There are many things in my monitoring system that help provide overall context when I'm investigating a problem, but by themselves, they aren't actionable and aren't anything I want to get alerts about. In other cases, I want to collect metrics from my systems to build trending graphs later. I disable alerts altogether on those kinds of checks. They still show up in my monitoring system and provide a good audit trail when I'm investigating a problem, but they don't page me with useless notifications.
Kyle's rule.
One final note about alert thresholds: I've developed a practice in my years as a sysadmin that I've found is important enough as a way to reduce burnout that I take it with me to every team I'm on. My rule is this:
If sysadmins were kept up during the night because of false alarms, they can clear their projects for the next day and spend time tuning alert thresholds so it doesn't happen again.
There is nothing worse than being kept up all night because of false positive alerts and knowing that the next night will be the same and that there's nothing you can do about it. If that kind of thing continues, it inevitably will lead either to burnout or to sysadmins silencing their pagers. Setting aside time for sysadmins to fix false alarms helps, because they get a chance to improve their night's sleep the next night. As a team lead or manager, sometimes this has meant that I've taken on a sysadmin's tickets for them during the day so they can fix alerts.
PagingSending an alert often is referred to as paging or being paged, because in the past, sysadmins, like doctors, carried pagers on them. Their monitoring systems were set to send a basic numerical alert to the pager when there was a problem, so that sysadmins could be alerted even when they weren't at a computer or when they were asleep. Although we still refer to it as paging, and some older-school teams still pass around an actual pager, these days, notifications more often are handled by alerts to mobile phones.
The first question you need to answer when you set up alerting is what method you will use for notifications. When you are deciding how to set up pager notifications, look for a few specific qualities.
Something that will alert you wherever you are geographically.
A number of cool office projects on the web exist where a broken software build triggers a big red flashing light in the office. That kind of notification is fine for office-hour alerts for non-critical systems, but it isn't appropriate as a pager notification even during the day, because a sysadmin who is in a meeting room or at lunch would not be notified. These days, this generally means some kind of notification needs to be sent to your phone.
An alert should stand out from other notifications.
False alarms can be a big problem with paging systems, as sysadmins naturally will start ignoring alerts. Likewise, if you use the same ringtone for alerts that you use for any other email, your brain will start to tune alerts out. If you use email for alerts, use filtering rules so that on-call alerts generate a completely different and louder ringtone from regular emails and vibrate the phone as well, so you can be notified even if you silence your phone or are in a loud room. In the past, when BlackBerries were popular, you could set rules such that certain emails generated a "Level One" alert that was different from regular email notifications.
The BlackBerry days are gone now, and currently, many organizations (in particular startups) use Google Apps for their corporate email. The Gmail Android application lets you set per-folder (called labels) notification rules so you can create a filter that moves all on-call alerts to a particular folder and then set that folder so that it generates a unique alert, vibrates and does so for every new email to that folder. If you don't have that option, most email software that supports multiple accounts will let you set different notifications for each account so you may need to resort to a separate email account just for alerts.
Something that will wake you up all hours of the night.
Some sysadmins are deep sleepers, and whatever notification system you choose needs to be something that will wake them up in the middle of the night. After all, servers always seem to misbehave at around 3am. Pick a ringtone that is loud, possibly obnoxious if necessary, and also make sure to enable phone vibrations. Also configure your alert system to re-send notifications if an alert isn't acknowledged within a couple minutes. Sometimes the first alert isn't enough to wake people up completely, but it might move them from deep sleep to a lighter sleep so the follow-up alert will wake them up.
While ChatOps (using chat as a method of getting notifications and performing administration tasks) might be okay for general non-critical daytime notifications, they are not appropriate for pager alerts. Even if you have an application on your phone set to notify you about unread messages in chat, many chat applications default to a "quiet time" in the middle of the night. If you disable that, you risk being paged in the middle of the night just because someone sent you a message. Also, many third-party ChatOps systems aren't necessarily known for their mission-critical reliability and have had outages that have spanned many hours. You don't want your critical alerts to rely on an unreliable system.
Something that is fast and reliable.
Your notification system needs to be reliable and able to alert you quickly at all times. To me, this means alerting is done in-house, but many organizations opt for third parties to receive and escalate their notifications. Every additional layer you can add to your alerting is another layer of latency and another place where a notification may be dropped. Just make sure whatever method you choose is reliable and that you have some way of discovering when your monitoring system itself is offline.
In the next section, I cover how to set up escalations -- meaning, how you alert other members of the team if the person on call isn't responding. Part of setting up escalations is picking a secondary, backup method of notification that relies on a different infrastructure from your primary one. So if you use your corporate Exchange server for primary notifications, you might select a personal Gmail account as a secondary. If you have a Google Apps account as your primary notification, you may pick SMS as your secondary alert.
Email servers have outages like anything else, and the goal here is to make sure that even if your primary method of notifications has an outage, you have some alternate way of finding out about it. I've had a number of occasions where my SMS secondary alert came in before my primary just due to latency with email syncing to my phone.
Create some means of alerting the whole team.
In addition to having individual alerting rules that will page someone who is on call, it's useful to have some way of paging an entire team in the event of an "all hands on deck" crisis. This may be a particular email alias or a particular key word in an email subject. However you set it up, it's important that everyone knows that this is a "pull in case of fire" notification and shouldn't be abused with non-critical messages.
Alert EscalationsOnce you have alerts set up, the next step is to configure alert escalations. Even the best-designed notification system alerting the most well intentioned sysadmin will fail from time to time either because a sysadmin's phone crashed, had no cell signal, or for whatever reason, the sysadmin didn't notice the alert. When that happens, you want to make sure that others on the team (and the on-call person's second notification) is alerted so someone can address the alert.
Alert escalations are one of those areas that some monitoring systems do better than others. Although the configuration can be challenging compared to other systems, I've found Nagios to provide a rich set of escalation schedules. Other organizations may opt to use a third-party notification system specifically because their chosen monitoring solution doesn't have the ability to define strong escalation paths. A simple escalation system might look like the following:
- Initial alert goes to the on-call sysadmin and repeats every five minutes.
- If the on-call sysadmin doesn't acknowledge or fix the alert within 15 minutes, it escalates to the secondary alert and also to the rest of the team.
- These alerts repeat every five minutes until they are acknowledged or fixed.
The idea here is to give the on-call sysadmin time to address the alert so you aren't waking everyone up at 3am, yet also provide the rest of the team with a way to find out about the alert if the first sysadmin can't fix it in time or is unavailable. Depending on your particular SLAs, you may want to shorten or lengthen these time periods between escalations or make them more sophisticated with the addition of an on-call backup who is alerted before the full team. In general, organize your escalations so they strike the right balance between giving the on-call person a chance to respond before paging the entire team, yet not letting too much time pass in the event of an outage in case the person on call can't respond.
If you are part of a larger international team, you even may be able to set up escalations that follow the sun. In that case, you would select on-call administrators for each geographic region and set up the alerts so that they were aware of the different time periods and time of day in those regions, and then alert the appropriate on-call sysadmin first. Then you can have escalations page the rest of the team, regardless of geography, in the event that an alert isn't solved.
On-Call RotationDuring World War One, the horrors of being in the trenches at the front lines were such that they caused a new range of psychological problems (labeled shell shock) that, given time, affected even the most hardened soldiers. The steady barrage of explosions, gun fire, sleep deprivation and fear day in and out took its toll, and eventually both sides in the war realized the importance of rotating troops away from the front line to recuperate.
It's not fair to compare being on call with the horrors of war, but that said, it also takes a kind of psychological toll that if left unchecked, it will burn out your team. The responsibility of being on call is a burden even if you aren't alerted during a particular period. It usually means you must carry your laptop with you at all times, and in some organizations, it may affect whether you can go to the movies or on vacation. In some badly run organizations, being on call means a nightmare of alerts where you can expect to have a ruined weekend of firefighting every time. Because being on call can be stressful, in particular if you get a lot of nighttime alerts, it's important to rotate out sysadmins on call so they get a break.
The length of time for being on call will vary depending on the size of your team and how much of a burden being on call is. Generally speaking, a one- to four-week rotation is common, with two-week rotations often hitting the sweet spot. With a large enough team, a two-week rotation is short enough that any individual member of the team doesn't shoulder too much of the burden. But, even if you have only a three-person team, it means a sysadmin gets a full month without worrying about being on call.
Holiday on call.
Holidays place a particular challenge on your on-call rotation, because it ends up being unfair for whichever sysadmin it lands on. In particular, being on call in late December can disrupt all kinds of family time. If you have a professional, trustworthy team with good teamwork, what I've found works well is to share the on-call burden across the team during specific known holiday days, such as Thanksgiving, Christmas Eve, Christmas and New Year's Eve. In this model, alerts go out to every member of the team, and everyone responds to the alert and to each other based on their availability. After all, not everyone eats Thanksgiving dinner at the same time, so if one person is sitting down to eat, but another person has two more hours before dinner, when the alert goes out, the first person can reply "at dinner", but the next person can reply "on it", and that way, the burden is shared.
If you are new to on-call alerting, I hope you have found this list of practices useful. You will find a lot of these practices in place in many larger organizations with seasoned sysadmins, because over time, everyone runs into the same kinds of problems with monitoring and alerting. Most of these policies should apply whether you are in a large organization or a small one, and even if you are the only DevOps engineer on staff, all that means is that you have an advantage at creating an alerting policy that will avoid some common pitfalls and overall burnout.
Oct 13, 2019 | stackoverflow.com
Find size and free space of the filesystem containing a given file Ask Question Asked 8 years, 10 months ago Active 6 months ago Viewed 110k times 67 21
Piskvor ,Aug 21, 2013 at 7:19
I'm using Python 2.6 on Linux. What is the fastest way:
- to determine which partition contains a given directory or file?
For example, suppose that
/dev/sda2is mounted on/home, and/dev/mapper/foois mounted on/home/foo. From the string"/home/foo/bar/baz"I would like to recover the pair("/dev/mapper/foo", "home/foo").- and then, to get usage statistics of the given partition? For example, given
/dev/mapper/fooI would like to obtain the size of the partition and the free space available (either in bytes or approximately in megabytes).Sven Marnach ,May 5, 2016 at 11:11
If you just need the free space on a device, see the answer usingos.statvfs()below.If you also need the device name and mount point associated with the file, you should call an external program to get this information.
dfwill provide all the information you need -- when called asdf filenameit prints a line about the partition that contains the file.To give an example:
import subprocess
df = subprocess.Popen(["df", "filename"], stdout=subprocess.PIPE)
output = df.communicate()[0]
device, size, used, available, percent, mountpoint = \
    output.split("\n")[1].split()
Note that this is rather brittle, since it depends on the exact format of the
dfoutput, but I'm not aware of a more robust solution. (There are a few solutions relying on the/procfilesystem below that are even less portable than this one.)Halfgaar ,Feb 9, 2017 at 10:41
This doesn't give the name of the partition, but you can get the filesystem statistics directly using thestatvfsUnix system call. To call it from Python, useos.statvfs('/home/foo/bar/baz').The relevant fields in the result, according to POSIX :
unsigned long f_frsize   Fundamental file system block size.
fsblkcnt_t    f_blocks   Total number of blocks on file system in units of f_frsize.
fsblkcnt_t    f_bfree    Total number of free blocks.
fsblkcnt_t    f_bavail   Number of free blocks available to
                         non-privileged process.
So to make sense of the values, multiply by
f_frsize:import os statvfs = os.statvfs('/home/foo/bar/baz') statvfs.f_frsize * statvfs.f_blocks # Size of filesystem in bytes statvfs.f_frsize * statvfs.f_bfree # Actual number of free bytes statvfs.f_frsize * statvfs.f_bavail # Number of free bytes that ordinary users # are allowed to use (excl. reserved space)Halfgaar ,Feb 9, 2017 at 10:44
import os

def get_mount_point(pathname):
    "Get the mount point of the filesystem containing pathname"
    pathname= os.path.normcase(os.path.realpath(pathname))
    parent_device= path_device= os.stat(pathname).st_dev
    while parent_device == path_device:
        mount_point= pathname
        pathname= os.path.dirname(pathname)
        if pathname == mount_point: break
        parent_device= os.stat(pathname).st_dev
    return mount_point

def get_mounted_device(pathname):
    "Get the device mounted at pathname"
    # uses "/proc/mounts"
    pathname= os.path.normcase(pathname) # might be unnecessary here
    try:
        with open("/proc/mounts", "r") as ifp:
            for line in ifp:
                fields= line.rstrip('\n').split()
                # note that line above assumes that
                # no mount points contain whitespace
                if fields[1] == pathname:
                    return fields[0]
    except EnvironmentError:
        pass
    return None # explicit

def get_fs_freespace(pathname):
    "Get the free space of the filesystem containing pathname"
    stat= os.statvfs(pathname)
    # use f_bfree for superuser, or f_bavail if filesystem
    # has reserved space for superuser
    return stat.f_bfree*stat.f_bsize
Some sample pathnames on my computer:
path 'trash': mp /home /dev/sda4 free 6413754368 path 'smov': mp /mnt/S /dev/sde free 86761562112 path '/usr/local/lib': mp / rootfs free 2184364032 path '/proc/self/cmdline': mp /proc proc free 0PSif on Python ≥3.3, there's
shutil.disk_usage(path)which returns a named tuple of(total, used, free)expressed in bytes.Xiong Chiamiov ,Sep 30, 2016 at 20:39
As of Python 3.3, there an easy and direct way to do this with the standard library:$ cat free_space.py #!/usr/bin/env python3 import shutil total, used, free = shutil.disk_usage(__file__) print(total, used, free) $ ./free_space.py 1007870246912 460794834944 495854989312These numbers are in bytes. See the documentation for more info.
Giampaolo Rodolà ,Aug 16, 2017 at 9:08
This should make everything you asked:import os from collections import namedtuple disk_ntuple = namedtuple('partition', 'device mountpoint fstype') usage_ntuple = namedtuple('usage', 'total used free percent') def disk_partitions(all=False): """Return all mountd partitions as a nameduple. If all == False return phyisical partitions only. """ phydevs = [] f = open("/proc/filesystems", "r") for line in f: if not line.startswith("nodev"): phydevs.append(line.strip()) retlist = [] f = open('/etc/mtab', "r") for line in f: if not all and line.startswith('none'): continue fields = line.split() device = fields[0] mountpoint = fields[1] fstype = fields[2] if not all and fstype not in phydevs: continue if device == 'none': device = '' ntuple = disk_ntuple(device, mountpoint, fstype) retlist.append(ntuple) return retlist def disk_usage(path): """Return disk usage associated with path.""" st = os.statvfs(path) free = (st.f_bavail * st.f_frsize) total = (st.f_blocks * st.f_frsize) used = (st.f_blocks - st.f_bfree) * st.f_frsize try: percent = ret = (float(used) / total) * 100 except ZeroDivisionError: percent = 0 # NB: the percentage is -5% than what shown by df due to # reserved blocks that we are currently not considering: # http://goo.gl/sWGbH return usage_ntuple(total, used, free, round(percent, 1)) if __name__ == '__main__': for part in disk_partitions(): print part print " %s\n" % str(disk_usage(part.mountpoint))On my box the code above prints:
giampaolo@ubuntu:~/dev$ python foo.py
partition(device='/dev/sda3', mountpoint='/', fstype='ext4')
    usage(total=21378641920, used=4886749184, free=15405903872, percent=22.9)

partition(device='/dev/sda7', mountpoint='/home', fstype='ext4')
    usage(total=30227386368, used=12137168896, free=16554737664, percent=40.2)

partition(device='/dev/sdb1', mountpoint='/media/1CA0-065B', fstype='vfat')
    usage(total=7952400384, used=32768, free=7952367616, percent=0.0)

partition(device='/dev/sr0', mountpoint='/media/WB2PFRE_IT', fstype='iso9660')
    usage(total=695730176, used=695730176, free=0, percent=100.0)

partition(device='/dev/sda6', mountpoint='/media/Dati', fstype='fuseblk')
    usage(total=914217758720, used=614345637888, free=299872120832, percent=67.2)
AK47 ,Jul 7, 2016 at 10:37
The simplest way to find out it.import os from collections import namedtuple DiskUsage = namedtuple('DiskUsage', 'total used free') def disk_usage(path): """Return disk usage statistics about the given path. Will return the namedtuple with attributes: 'total', 'used' and 'free', which are the amount of total, used and free space, in bytes. """ st = os.statvfs(path) free = st.f_bavail * st.f_frsize total = st.f_blocks * st.f_frsize used = (st.f_blocks - st.f_bfree) * st.f_frsize return DiskUsage(total, used, free)tzot ,Aug 8, 2011 at 10:11
For the first point, you can try usingos.path.realpathto get a canonical path, check it against/etc/mtab(I'd actually suggest callinggetmntent, but I can't find a normal way to access it) to find the longest match. (to be sure, you should probablystatboth the file and the presumed mountpoint to verify that they are in fact on the same device)For the second point, use
os.statvfsto get block size and usage information.(Disclaimer: I have tested none of this, most of what I know came from the coreutils sources)
andrew ,Dec 15, 2017 at 0:55
For the second part of your question, "get usage statistics of the given partition", psutil makes this easy with the disk_usage(path) function. Given a path,disk_usage()returns a named tuple including total, used, and free space expressed in bytes, plus the percentage usage.Simple example from documentation:
>>> import psutil
>>> psutil.disk_usage('/')
sdiskusage(total=21378641920, used=4809781248, free=15482871808, percent=22.5)
Psutil works with Python versions from 2.6 to 3.6 and on Linux, Windows, and OSX among other platforms.
Donald Duck ,Jan 12, 2018 at 18:28
import os

def disk_stat(path):
    disk = os.statvfs(path)
    percent = (disk.f_blocks - disk.f_bfree) * 100 / (disk.f_blocks -disk.f_bfree + disk.f_bavail) + 1
    return percent


print disk_stat('/')
print disk_stat('/data')
> ,
Usually the/procdirectory contains such information in Linux, it is a virtual filesystem. For example,/proc/mountsgives information about current mounted disks; and you can parse it directly. Utilities liketop,dfall make use of/proc.I haven't used it, but this might help too, if you want a wrapper: http://bitbucket.org/chrismiles/psi/wiki/Home
Jun 01, 2017 | medium.com
Python Script to monitor disk space and send an email in case threshold reached(gmail as provider)
devops everyday challenge Jun 1, 2017 · 2 min read
To send a message we are going to use smtplib library to dispatch it to SMTP server
# First we are building message from email.mime.text import MIMEText
msg = MIMEText("Server is running out of disk space")
msg["Subject"] = "Low disk space warning"
msg["From"] = "[email protected]"
msg["To"] = "[email protected]"
msg.as_string()
'Content-Type: text/plain; charset="us-ascii"\nMIME-Version: 1.0\nContent-Transfer-Encoding: 7bit\nSubject: Low disk space warning\nTo: [email protected]\nFrom: [email protected]\nTo: [email protected]\n\nServer is running out of disk space'# To send a message we need to connect to SMTP server
import smtplibserver=smtplib.SMTP("smtp.gmail.com", 587)
server.ehlo()
(250, b'smtp.gmail.com at your service, [54.202.39.68]\nSIZE 35882577\n8BITMIME\nSTARTTLS\nENHANCEDSTATUSCODES\nPIPELINING\nCHUNKING\nSMTPUTF8')
server.starttls()
(220, b'2.0.0 Ready to start TLS')
server.login("gmail_username","gmail_password")
(235, b'2.7.0 Accepted')
server.sendmail("[email protected]","[email protected]",msg.as_string())
{}
server.quit()
(221, b'2.0.0 closing connection o76sm39310782pfi.119 - gsmtp')
In case if you are getting error like this
server.login(gmail_user, gmail_pwd)
    File "/usr/lib/python3.4/smtplib.py", line 639, in login
   raise SMTPAuthenticationError(code, resp)
   smtplib.SMTPAuthenticationError: (534, b'5.7.14
   <https://accounts.google.com/ContinueSignIn?sarp=1&scc=1&plt=AKgnsbtl1\n5.7.14       Li2yir27TqbRfvc02CzPqZoCqope_OQbulDzFqL-msIfsxObCTQ7TpWnbxIoAaQoPuL9ge\n5.7.14 BUgbiOqhTEPqJfb02d_L6rrdduHSxv26s_Ztg_JYYavkrqgs85IT1xZYwtbWIRE8OIvQKf\n5.7.14 xxtT7ENlZTS0Xyqnc1u4_MOrBVW8pgyNyeEgKKnKNyxce76JrsdnE1JgSQzr3pr47bL-kC\n5.7.14 XifnWXg> Please log in via your web browser and then try again.\n5.7.14 Learn more at\n5.7.14 https://support.google.com/mail/bin/answer.py?answer=78754 fl15sm17237099pdb.92 - gsmtp')
Go to this link and select Turn On
https://www.google.com/settings/security/lesssecureappsPython Script to monitor disk space usage
threshold = 90
partition = "/"df = subprocess.Popen(["df","-h"], stdout=subprocess.PIPE)
 for line in df.stdout:
 splitline = line.decode().split()
 if splitline[5] == partition:
 if int(splitline[4][:-1]) > threshold:
Now combine both of them
import subprocess
import smtplib
from email.mime.text import MIMETextthreshold = 40
partition = "/"def report_via_email():
 msg = MIMEText("Server running out of disk space")
 msg["Subject"] = "Low disk space warning"
 msg["From"] = "[email protected]"
 msg["To"] = "[email protected]"
 with smtplib.SMTP("smtp.gmail.com", 587) as server:
 server.ehlo()
 server.starttls()
 server.login("gmail_user","gmail_password)
 server.sendmail("[email protected]","[email protected]",msg.as_string())def check_once():
 df = subprocess.Popen(["df","-h"], stdout=subprocess.PIPE)
 for line in df.stdout:
 splitline = line.decode().split()
 if splitline[5] == partition:
 if int(splitline[4][:-1]) > threshold:
 report_via_email()
check_once()
Sep 13, 2019 | linuxconfig.org
... ... ...
We can also include our own custom configuration file(s) in our custom packages, thus allowing updating client monitoring configuration in a centralized and automated way. Keeping that in mind, we'll configure the client in/etc/nrpe.d/custom.cfgon all distributions in the following examples.NRPE does not accept any commands other then
localhostby default. This is for security reasons. To allow command execution from a server, we need to set the server's IP address as an allowed address. In our case the server is a Nagios server, with IP address10.101.20.34. We add the following to our client configuration:allowed_hosts=10.101.20.34
Multiple addresses or hostnames can be added, separated by commas. Note that the above logic requires static address for the monitoring server. Using
Configuring a custom check on the server and client sidedhcpon the monitoring server will surely break your configuration, if you use IP address here. The same applies to the scenario where you use hostnames, and the client can't resolve the server's hostname.To demonstrate our monitoring setup's capabilites, let's say we would like to know if the local postfix system delivers a mail on a client for user
root. The mail could contain acronjoboutput, some report, or something that is written to theSTDERRand is delivered as a mail by default. For instance,abrtsends a crash report torootby default on a process crash. We did not setup a mail relay, but we still would like to know if a mail arrives. Let's write a custom check to monitor that.
- Our first piece of the puzzle is the check itself. Consider the following simple bash script called
check_unread_mail:#!/bin/bash USER=root if [ "$(command -v finger >> /dev/null; echo $?)" -gt 0 ]; then echo "UNKNOWN: utility finger not found" exit 3 fi if [ "$(id "$USER" >> /dev/null ; echo $?)" -gt 0 ]; then echo "UNKNOWN: user $USER does not exist" exit 3 fi ## check for mail if [ "$(finger -pm "$USER" | tail -n 1 | grep -ic "No mail.")" -gt 0 ]; then echo "OK: no unread mail for user $USER" exit 0 else echo "WARNING: unread mail for user $USER" exit 1 fiThis simple check uses the
fingerutility to check for unread mail for userroot. Output of thefinger -pmmay vary by version and thus distribution, so some adjustments may be needed.For example on Fedora 30, last line of the output of
finger -pm
        <username>
is "No mail.", but on openSUSE Leap 15.1 it would be "No Mail." (notice the upper case Mail). In this case thegrep -ihandles this difference, but it shows well that when working with different distributions and versions, some additional work may be needed.- We'll need
fingerto make this check work. The package's name is the same on all distributions, so we can install it withapt,zypper,dnforyum.- We need to set the check executable:
# chmod +x check_unread_mail- We'll place the check into the
/usr/lib64/nagios/pluginsdirectory, the common place for nrpe checks. We'll reference it later.- We'll call our command
check_mail_root. Let's place another line into our custom client configuration, where we tellnrpewhat commands we accept, and what need to be done when a given command arrives:command[check_mail_root]=/usr/lib64/nagios/plugins/check_unread_mail- With this our client configuration is complete. We can start the service on the client with
systemd. The service name isnagios-nrpe-serveron Debian derivatives, and simplynrpeon other distributions.# systemctl start nagios-nrpe-server # systemctl status nagios-nrpe-server ● nagios-nrpe-server.service - Nagios Remote Plugin Executor Loaded: loaded (/lib/systemd/system/nagios-nrpe-server.service; enabled; vendor preset: enabled) Active: active (running) since Tue 2019-09-10 13:03:10 CEST; 1min 51s ago Docs: http://www.nagios.org/documentation Main PID: 3782 (nrpe) Tasks: 1 (limit: 3549) CGroup: /system.slice/nagios-nrpe-server.service └─3782 /usr/sbin/nrpe -c /etc/nagios/nrpe.cfg -f szept 10 13:03:10 mail-test-client systemd[1]: Started Nagios Remote Plugin Executor. szept 10 13:03:10 mail-test-client nrpe[3782]: Starting up daemon szept 10 13:03:10 mail-test-client nrpe[3782]: Server listening on 0.0.0.0 port 5666. szept 10 13:03:10 mail-test-client nrpe[3782]: Server listening on :: port 5666. szept 10 13:03:10 mail-test-client nrpe[3782]: Listening for connections on port 5666
- Now we can configure the server side. If we don't have one already, we can define a command that calls a remote
nrpeinstance with a command as it's sole argument:# this command runs a program $ARG1$ with no arguments define command { command_name check_nrpe_1arg command_line $USER1$/check_nrpe -H $HOSTADDRESS$ -t 60 -c $ARG1$ 2>/dev/null }- We also define the client as a host:
define host {
        use                     linux-server
        host_name               mail-test-client
        alias                   mail-test-client
        address                 mail-test-client
}
The address can be an IP address or hostname. In the later case we need to ensure it can be resolved by the monitoring server.- We can define a service on the above host using the Nagios side command and the client side command:
define service {
        use                        generic-service
        host_name                  mail-test-client
        service_description        OS:unread mail for root
        check_command              check_nrpe_1arg!check_mail_root
}
These adjustments can be placed to any configuration file the Nagios server reads on startup, but it is a good practice to keep configuration files tidy.- We verify our new Nagios configuration:
# nagios -v /etc/nagios/nagios.cfgIf "Things look okay", we can apply the configuration with a server reload:
Feb 07, 2019 | lintut.com
Nagios is an opensource software used for network and infrastructure monitoring . Nagios will monitor servers, switches, applications and services . It alerts the System Administrator when something went wrong and also alerts back when the issues has been rectified.
View also: How to Enable EPEL Repository for RHEL/CentOS 6/5
View also: How to Enable EPEL Repository for RHEL/CentOS 6/5
yum install nagios nagios-devel nagios-plugins* gd gd-devel httpd php gcc glibc glibc-commonBydefualt on doing yum install nagios, in cgi.cfg file, authorized user name nagiosadmin is mentioned and for htpasswd file /etc/nagios/passwd file is used.So for easy steps I am using the same name.
# htpasswd -c /etc/nagios/passwd nagiosadminCheck the below given values in /etc/nagios/cgi.cfg
nano /etc/nagios/cgi.cfg
# AUTHENTICATION USAGE
use_authentication=1
# SYSTEM/PROCESS INFORMATION ACCESS
authorized_for_system_information=nagiosadmin
# CONFIGURATION INFORMATION ACCESS
authorized_for_configuration_information=nagiosadmin
# SYSTEM/PROCESS COMMAND ACCESS
authorized_for_system_commands=nagiosadmin
# GLOBAL HOST/SERVICE VIEW ACCESS
authorized_for_all_services=nagiosadmin
authorized_for_all_hosts=nagiosadmin
# GLOBAL HOST/SERVICE COMMAND ACCESS
authorized_for_all_service_commands=nagiosadmin
authorized_for_all_host_commands=nagiosadminFor provoding the access to nagiosadmin user in http, /etc/httpd/conf.d/nagios.conf file exist. Below is the nagios.conf configuration for nagios server.
cat /etc/http/conf.d/nagios.conf
# SAMPLE CONFIG SNIPPETS FOR APACHE WEB SERVER
# Last Modified: 11-26-2005
#
# This file contains examples of entries that need
# to be incorporated into your Apache web server
# configuration file. Customize the paths, etc. as
# needed to fit your system.ScriptAlias /nagios/cgi-bin/ "/usr/lib/nagios/cgi-bin/"
# SSLRequireSSL
Options ExecCGI
AllowOverride None
Order allow,deny
Allow from all
# Order deny,allow
# Deny from all
# Allow from 127.0.0.1
AuthName "Nagios Access"
AuthType Basic
AuthUserFile /etc/nagios/passwd
Require valid-userAlias /nagios "/usr/share/nagios/html"
# SSLRequireSSL
Options None
AllowOverride None
Order allow,deny
Allow from all
# Order deny,allow
# Deny from all
Allow from 127.0.0.1
AuthName "Nagios Access"
AuthType Basic
AuthUserFile /etc/nagios/passwd
Require valid-userStart the httpd and nagios /etc/init.d/httpd start /etc/init.d/nagios start [warn]Note: SELINUX and IPTABLE are disabled.[/warn] Access the nagios server by http://nagios_server_ip-address/nagios Give the username = nagiosadmin and password which you have given to nagiosadmin user.
Jan 31, 2019 | www.thegeekdiary.com
Troubleshooting performance issue in CentOS/RHEL using collectl utility
By admin
Unlike most monitoring tools that either focus on a small set of statistics, format their output in only one way, run either interactively or as a daemon but not both, collectl tries to do it all. You can choose to monitor any of a broad set of subsystems which currently include buddyinfo, cpu, disk, inodes, InfiniBand, lustre, memory, network, nfs, processes, quadrics, slabs, sockets and tcp.
Installing collectlThe collectl community project is maintained at http://collectl.sourceforge.net/ as well as provided in the Fedora community project. For Red Hat Enterprise Linux 6 and 7, the easiest way to install collectl is via the EPEL repositories (Extra Packages for Enterprise Linux) maintained by the Fedora community.
Once set up, collectl can be installed with the following command:
# yum install collectlThe packages are also available for direct download using the following links:
RHEL 5 x86_64 (available in the EPEL archives) https://archive.fedoraproject.org/pub/archive/epel/5/x86_64/
General usage of collectl
RHEL 6 x86_64 http://dl.fedoraproject.org/pub/epel/6/x86_64/
RHEL 7 x86_64 http://dl.fedoraproject.org/pub/epel/7/x86_64/The collectl utility can be run manually via the command line or as a service. Data will be logged to /var/log/collectl/*.raw.gz . The logs will be rotated every 24 hours by default. To run as a service:
# chkconfig collectl on       # [optional, to start at boot time]
# service collectl start
Sample IntervalsWhen run manually from the command line, the first Interval value is 1 . When running as a service, default sample intervals are as show below. It might sometimes be desired to lower these to avoid averaging, such as 1,30,60.
# grep -i interval /etc/collectl.conf
#Interval =     10
#Interval2 =    60
#Interval3 =   120
Using collectl to troubleshoot disk or SAN storage performanceThe defaults of 10s for all but process data which is collected at 60s intervals are best left as is, even for storage performance analysis.
The SAR Equivalence Matrix shows common SAR command equivalents to help experienced SAR users learn to use Collectl. The following example command will view summary detail of the CPU, Network and Disk from the file /var/log/collectl/HOSTNAME-20190116-164506.raw.gz :
# collectl -scnd -oT -p HOSTNAME-20190116-164506.raw.gz
#         <----CPU[HYPER]-----><----------Disks-----------><----------Network---------->
#Time     cpu sys inter  ctxsw KBRead  Reads KBWrit Writes   KBIn  PktIn  KBOut  PktOut
16:46:10    9   2 14470  20749      0      0     69      9      0      1      0       2
16:46:20   13   4 14820  22569      0      0    312     25    253    174      7      79
16:46:30   10   3 15175  21546      0      0     54      5      0      2      0       3
16:46:40    9   2 14741  21410      0      0     57      9      1      2      0       4
16:46:50   10   2 14782  23766      0      0    374      8    250    171      5      75
....
The next example will output the 1 minute period from 17:00 – 17:01.
# collectl -scnd -oT --from 17:00 --thru 17:01 -p HOSTNAME-20190116-164506.raw.gz
#         <----CPU[HYPER]-----><----------Disks-----------><----------Network---------->
#Time     cpu sys inter  ctxsw KBRead  Reads KBWrit Writes   KBIn  PktIn  KBOut  PktOut
17:00:00   13   3 15870  25320      0      0     67      9    251    172      6      90
17:00:10   16   4 16386  24539      0      0    315     17    246    170      6      84
17:00:20   10   2 14959  22465      0      0     65     26      5      6      1       8
17:00:30   11   3 15056  24852      0      0    323     12    250    170      5      69
17:00:40   18   5 16595  23826      0      0    463     13      1      5      0       5
17:00:50   12   3 15457  23663      0      0     57      9    250    170      6      76
17:01:00   13   4 15479  24488      0      0    304      7    254    176      5      70
The next example will output Detailed Disk data.
# collectl -scnD -oT -p HOSTNAME-20190116-164506.raw.gz

### RECORD    7 >>> tabserver <<< (1366318860.001) (Thu Apr 18 17:01:00 2013) ###

# CPU[HYPER] SUMMARY (INTR, CTXSW & PROC /sec)
# User  Nice   Sys  Wait   IRQ  Soft Steal  Idle  CPUs  Intr  Ctxsw  Proc  RunQ   Run   Avg1  Avg5 Avg15 RunT BlkT
     8     0     3     0     0     0     0    86     8   15K    24K     0   638     5   1.07  1.05  0.99    0    0

# DISK STATISTICS (/sec)
#          <---------reads---------><---------writes---------><--------averages--------> Pct
#Name       KBytes Merged  IOs Size  KBytes Merged  IOs Size  RWSize  QLen  Wait SvcTim Util
sda              0      0    0    0     304     11    7   44      44     2    16      6    4
sdb              0      0    0    0       0      0    0    0       0     0     0      0    0
dm-0             0      0    0    0       0      0    0    0       0     0     0      0    0
dm-1             0      0    0    0       5      0    1    4       4     1     2      2    0
dm-2             0      0    0    0     298      0   14   22      22     1     4      3    4
dm-3             0      0    0    0       0      0    0    0       0     0     0      0    0
dm-4             0      0    0    0       0      0    0    0       0     0     0      0    0
dm-5             0      0    0    0       0      0    0    0       0     0     0      0    0
dm-6             0      0    0    0       0      0    0    0       0     0     0      0    0
dm-7             0      0    0    0       0      0    0    0       0     0     0      0    0
dm-8             0      0    0    0       0      0    0    0       0     0     0      0    0
dm-9             0      0    0    0       0      0    0    0       0     0     0      0    0
dm-10            0      0    0    0       0      0    0    0       0     0     0      0    0
dm-11            0      0    0    0       0      0    0    0       0     0     0      0    0

# NETWORK SUMMARY (/sec)
# KBIn  PktIn SizeIn  MultI   CmpI  ErrsI  KBOut PktOut  SizeO   CmpO  ErrsO
   253    175   1481      0      0      0      5     70     79      0      0
....
Commonly used optionsThese generate summary, which is the total of ALL data for a particular type
- b - buddy info (memory fragmentationc cpu
- d - disk
- f - nfs
- i - inodes
- j - interrupts by CPU
- l - lustre
- m - memory
- n - network
- s - sockets
- t - tcp
- x – Interconnect
- y – Slabs (system object caches)
These generate detail data, typically but not limited to the device level
- C - individual CPUs, including interrupts if sj or sJ
- D - individual Disks
- E - environmental (fan, power, temp) [requires ipmitool]
- F - nfs data
- J - interrupts by CPU by interrupt number
- L - lustre
- M - memory numa/node
- N - individual Networks
- T - tcp details (lots of data!)
- X - interconnect ports/rails (Infiniband/Quadrics)
- Y - slabs/slubs
- Z - processes
The most useful switches are listed here
Final Thoughts
- -sD detailed disk data
- -sC detailed CPU data
- -sN detailed network data
- -sZ detailed process data
Performance Co-Pilot (PCP) is the preferred tool for collecting comprehensive performance metrics for performance analysis and troubleshooting. It is shipped and supported in Red Hat Enterprise Linux 6 & 7 and is the preferred recommendation over Collectl or Sar/Sysstat. It also includes conversion tools between its own performance data and Collectl & Sar/Syststat.
Oct 30, 2018 | theregister.co.uk
oops there goes ansibleSo how many ibm competitors will want to use ansible now?
Oct 14, 2018 | linux.slashdot.org
raymorris ( 2726007 ) , Sunday May 27, 2018 @03:35PM ( #56684542 ) Journalinotify / fswatch ( Score: 5 , Informative)>. Files don't generally call you, for example, you have to poll.
That's called inotify. If you want to be compatible with systems that have something other than inotify, fswatch is a wrapper around various implementations of "call me when a file changes".
Polling is normally the safest and simplest paradigm, though, because the standard thing is "when a file changes, do this". Polling / waiting makes that simple and self-explanatory:
while tail file

      do

      something

      done
The alternative, asynchronously calling the function like this has a big problem:
when file changes

      do something
The biggest problem is that a file can change WHILE you're doing something(), meaning it will re-start your function while you're in the middle of it. Re-entrancy carries with it all manner of potential problems. Those problems can be handled of you really know what you're doing, you're careful, and you make a full suite of re-entrant integration tests. Or you can skip all that and just use synchronous io, waiting or polling. Neither is the best choice in ALL situations, but very often simplicity is the best choice.
Nov 12, 2017 | www.howtoforge.com
Installing Nagios 3.4.4 On CentOS 6.3 Introduction
Nagios is a monitoring tool under GPL licence. This tool lets you monitor servers, network hardware (switches, routers, ...) and applications. A lot of plugins are available and its big community makes Nagios the biggest open source monitoring tool. This tutorial shows how to install Nagios 3.4.4 on CentOS 6.3.
PrerequisitesAfter installing your CentOS server, you have to disable selinux & install some packages to make nagios work.
To disable selinux, open the file: /etc/selinux/config
# vi /etc/selinux/config
# This file controls the state of SELinux on the system.
# SELINUX= can take one of these three values:
#     enforcing - SELinux security policy is enforced.
#     permissive - SELinux prints warnings instead of enforcing.
#     disabled - No SELinux policy is loaded.
SELINUX=permissive // change this value to disabled
# SELINUXTYPE= can take one of these two values:
#     targeted - Targeted processes are protected,
#     mls - Multi Level Security protection.
SELINUXTYPE=targeted
Now, download all packages you need:
# yum install gd gd-devel httpd php gcc glibc glibc-common
Nagios InstallationCreate a directory:
# mkdir /root/nagios
Navigate to this directory:
# cd /root/nagios
Download nagios-core & plugin:
# wget http://prdownloads.sourceforge.net/sourceforge/nagios/nagios-3.4.4.tar.gz
# wget http://prdownloads.sourceforge.net/sourceforge/nagiosplug/nagios-plugins-1.4.16.tar.gzUntar nagios core:
# tar xvzf nagios-3.4.4.tar.gz
Go to the nagios dir:
# cd nagios
Configure before make:
# ./configure
Make all necessary files for Nagios:
# make all
Installation:
# make install
# make install-init
# make install-commandmode
# make install-config
# make install-webconf
Create a password to log into the web interface:
# htpasswd -c /usr/local/nagios/etc/htpasswd.users nagiosadmin
Start the service and start it on boot:
# chkconfig nagios on
# service nagios startNow, you have to install the plugins:
# cd ..
# tar xvzf nagios-plugins-1.4.15.tar.gz
# cd nagios-plugins-1.4.15
# ./configure
# make
# make installStart the apache service and enable it on boot:
# service httpd start
# chkconfig httpd onNow, connect to your nagios system:
http://Your-Nagios-IP/nagios and enter login : nagiosadmin & password you have chosen above.
And after the installation ?After the installation you have to configure all your host & services in nagios configuration files.This step is performed in command line and is complicated, so I recommand to install tool like Centreon, that is a beautiful front-end to add you host & services.
To go further, I recommend you to read my article on Nagios & Centreon monitoring .
Nov 12, 2017 | www.tecmint.com
Requirements
Step 1: Install Pre-requirements for Nagios1. Before installing Nagios Core from sources in Ubuntu or Debian , first install the following LAMP stack components in your system, without MySQL RDBMS database component, by issuing the below command.
# apt install apache2 libapache2-mod-php7.0 php7.02. On the next step, install the following system dependencies and utilities required to compile and install Nagios Core from sources, by issuing the follwoing command.
# apt install wget unzip zip autoconf gcc libc6 make apache2-utils libgd-devStep 2: Install Nagios 4 Core in Ubuntu and Debian3. On the first step, create nagios system user and group and add nagios account to the Apache www-data user, by issuing the below commands.
# useradd nagios
# usermod -a -G nagios www-data
4. After all dependencies, packages and system requirements for compiling Nagios from sources are present in your system, go to Nagios webpage and grab the latest version of Nagios Core stable source archive by issuing the following command.
# wget https://assets.nagios.com/downloads/nagioscore/releases/nagios-4.3.4.tar.gz5. Next, extract Nagios tarball and enter the extracted nagios directory, with the following commands. Issue ls command to list nagios directory content.
# tar xzf nagios-4.3.4.tar.gz
# cd nagios-4.3.4/
# ls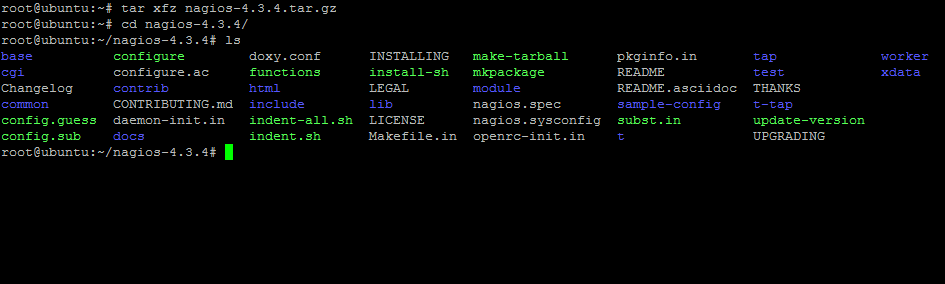
List Nagios Content
6. Now, start to compile Nagios from sources by issuing the below commands. Make sure you configure Nagios with Apache sites-enabled directory configuration by issuing the below command.
# ./configure --with-httpd-conf=/etc/apache2/sites-enabled7. In the next step, build Nagios files by issuing the following command.
# make all8. Now, install Nagios binary files, CGI scripts and HTML files by issuing the following command.
# make install9. Next, install Nagios daemon init and external command mode configuration files and make sure you enable nagios daemon system-wide by issuing the following commands.
# make install-init
# make install-commandmode
# systemctl enable nagios.service
10. Next, run the following command in order to install some Nagios sample configuration files needed by Nagios to run properly by issuing the below command.
# make install-config11. Also, install Nagios configuration file for Apacahe web server, which can be fount in /etc/apacahe2/sites-enabled/ directory, by executing the below command.
# make install-webconf12. Next, create nagiosadmin account and a password for this account necessary by Apache server to log in to Nagios web panel by issuing the following command.
# htpasswd -c /usr/local/nagios/etc/htpasswd.users nagiosadmin13. To allow Apache HTTP server to execute Nagios cgi scripts and to access Nagios admin panel via HTTP, first enable cgi module in Apache and then restart Apache service and start and enable Nagios daemon system-wide by issuing the following commands.
# a2enmod cgi
# systemctl restart apache2
# systemctl start nagios
# systemctl enable nagios
14. Finally, log in to Nagios Web Interface by pointing a browser to your server's IP address or domain name at the following URL address via HTTP protocol. Log in to Nagios with nagiosadmin user the password setup with htpasswd script.
http://IP-Address/nagios
OR
http://DOMAIN/nagios
Jan 26, 2012 | sanctum.geek.nz
Nagios is useful for monitoring pretty much any kind of network service, with a wide variety of community-made plugins to test pretty much anything you might need. However, its configuration and interface can be a little bit cryptic to initiates. Fortunately, Nagios is well-packaged in Debian and Ubuntu and provides a basic default configuration that is instructive to read and extend.
There's a reason that a lot of system administrators turn into monitoring fanatics when tools like Nagios are available. The rapid feedback of things going wrong and being fixed and the pleasant sea of green when all your services are up can get addictive for any halfway dedicated administrator.
In this article I'll walk you through installing a very simple monitoring setup on a Debian or Ubuntu server. We'll assume you have two computers in your home network, a workstation on
192.168.1.1and a server on192.168.1.2, and that you maintain a web service of some sort on a remote server, for which I'll usewww.example.com.We'll install a Nagios instance on the server that monitors both local services and the remote webserver, and emails you if it detects any problems.
For those not running a Debian-based GNU/Linux distribution or perhaps BSD, much of the configuration here will still apply, but the initial setup will probably be peculiar to your ports or packaging system unless you're compiling from source.
Installing the packagesWe'll work on a freshly installed Debian Stable box as the server, which at the time of writing is version 6.0.3 "Squeeze". If you don't have it working already, you should start by installing Apache HTTPD:
# apt-get install apache2Visit the server on
http://192.168.1.1/and check that you get the "It works!", and that should be all you need. Note that by default this installation of Apache is not terribly secure, so you shouldn't allow access to it from outside your private network until you've locked it down a bit, which is outside the scope of this article.Next we'll install the
nagios3package, which will include a default set of useful plugins, and a simple configuration. The list of packages it needs to support these is quite long so you may need to install a lot of dependencies, whichapt-getwill manage for you.# apt-get install nagios3The installation procedure will include requesting a password for the administration area; provide it with a suitable one. You may also get prompted to configure a workgroup for the
samba-commonpackage; don't worry, you aren't installing asambaservice by doing this, it's just information for thesmbclientprogram in case you want to monitor any SMB/CIFS services.That should provide you with a basic self-monitoring Nagios setup. Visit
http://192.168.1.1/nagios3/in your browser to verify this; use the usernamenagiosadminand the password you gave during the install process. If you see something like the below, you're in business; this is the Nagios web reporting and administration panel.
The Nagios administration area's front page Default setup
To start with, click the Services link in the left menu. You should see something like the below, which is the monitoring for
localhostand the service monitoring that the packager set up for you by default:
Default Nagios monitoring hosts and services
Note that on my system, monitoring for the already-existing HTTP and SSH daemons was automatically set up for me, along with the default checks for load average, user count, and process count. If any of these pass a threshold, they'll turn yellow for WARNING, and red for CRITICAL states.
This is already somewhat useful, though a server monitoring itself is a bit problematic because of course it won't be able to tell you if it goes completely down. So for the next step, we're going to set up monitoring for the remote host
Default configurationwww.example.com, which means firing up your favourite text editor to edit a few configuration files.Nagios configuration is at first blush a bit complex, because monitoring setups need to be quite finely-tuned in order to be useful long term, particularly if you're managing a large number of hosts. Take a look at the files in
/etc/nagios3/conf.d.# ls /etc/nagios3/conf.d contacts_nagios2.cfg extinfo_nagios2.cfg generic-host_nagios2.cfg generic-service_nagios2.cfg hostgroups_nagios2.cfg localhost_nagios2.cfg services_nagios2.cfg timeperiods_nagios2.cfgYou can actually arrange a Nagios configuration any way you like, including one big well-ordered file, but it makes some sense to break it up into sections if you can. In this case, the default setup includes the following files:
contacts_nagios2.cfgdefines the people and groups of people who should receive notifications and alerts when Nagios detects problems or resolutions.extinfo_nagios2.cfgmakes some miscellaneous enhancements to other configurations, kept in a separate file for clarity.generic-host_nagios2.cfgis Debian's host template, defining a few common variables that you're likely to want for most hosts, saving you repeating yourself when defining host definitions.generic-service_nagios2.cfgis the same idea, but it's a template service to monitor.hostgroups_nagios2.cfgdefines groups of hosts in case it's valuable for you to monitor individual groups of hosts, which the Nagios admin allows you to do.localhost_nagios2.cfgis where the monitoring for thelocalhosthost we were just looking at is defined.services_nagios2.cfgis where further services are defined that might be applied to groups.timeperiods_nagios2.cfgdefines periods of time for monitoring services; for example, you might want to get paged if a webserver dies 24/7, but you might not care as much about 5% packet loss on some international link at 2am on Saturday morning.This isn't my favourite method of organising Nagios configuration, but it'll work fine for us. We'll start by defining a remote host, and add services to it.
Testing servicesFirst of all, let's check we actually have connectivity to the host we're monitoring from this server for both of the services we intend to check; ICMP ECHO (PING) and HTTP.
$ ping -n -c 1 www.example.com
PING www.example.com (192.0.43.10) 56(84) bytes of data.
64 bytes from 192.0.43.10: icmp_req=1 ttl=243 time=168 ms
--- www.example.com ping statistics --- 1 packets transmitted, 1 received,
0% packet loss, time 0ms rtt min/avg/max/mdev = 168.700/168.700/168.700/0.000 ms

$ wget www.example.com -O - | grep -i found
tom@novus:~$ wget www.example.com -O -
--2012-01-26 21:12:00--  http://www.example.com/
Resolving www.example.com... 192.0.43.10, 2001:500:88:200::10
Connecting to www.example.com|192.0.43.10|:80... connected.
HTTP request sent, awaiting response... 302 Found
...
All looks well, so we'll go ahead and add the host and its services.
Defining the remote hostWrite a new file in the
/etc/nagios3/conf.ddirectory calledwww.example.com_nagios2.cfg, with the following contents:define host { use generic-host host_name www.example.com address www.example.com }The first stanza of
localhost_nagios2.conflooks very similar to this, indeed, it uses the same host template,generic-host. All we need to do is define what to call the host, and where to find it.However, in order to get it monitoring appropriate services, we might need to add it to one of the already existing groups. Open up
hostgroups_nagios2.cfg, and look for the stanza that includeshostgroup_name http-servers. Addwww.example.comto the group's members, so that that stanza looks like this:# A list of your web servers define hostgroup { hostgroup_name http-servers alias HTTP servers members localhost,www.example.com }With this done, you need to restart the Nagios process:
# service nagios3 restartIf that succeeds, you should notice under your Hosts and Services section is a new host called "www.example.com", and it's being monitored for HTTP. At first, it'll be PENDING, but when the scheduled check runs, it should come back (hopefully!) as OK.
April 27, 2014 | tecmint.com
... ... ...
6. Htop – Linux Process Monitoring
Htop is a much advanced interactive and real time Linux process monitoring tool. This is much similar to Linux top command but it has some rich features like user friendly interface to manage process, shortcut keys, vertical and horizontal view of the processes and much more. Htop is a third party tool and doesn't included in Linux systems, you need to install it using YUM package manager tool. For more information on installation read our article below.
7. Iotop – Monitor Linux Disk I/O
Iotop is also much similar to top command and Htop program, but it has accounting function to monitor and display real time Disk I/O and processes. This tool is much useful for finding the exact process and high used disk read/writes of the processes.
... ... ...
9. IPTraf – Real Time IP LAN Monitoring
IPTraf is an open source console-based real time network (IP LAN) monitoring utility for Linux. It collects a variety of information such as IP traffic monitor that passes over the network, including TCP flag information, ICMP details, TCP/UDP traffic breakdowns, TCP connection packet and byne counts. It also gathers information of general and detaled interface statistics of TCP, UDP, IP, ICMP, non-IP, IP checksum errors, interface activity etc.
10. Psacct or Acct – Monitor User Activity
psacct or acct tools are very useful for monitoring each users activity on the system. Both daemons runs in the background and keeps a close watch on the overall activity of each user on the system and also what resources are being consumed by them.
These tools are very useful for system administrators to track each users activity like what they are doing, what commands they issued, how much resources are used by them, how long they are active on the system etc.
For installation and example usage of commands read the article on Monitor User Activity with psacct or acct
11. Monit – Linux Process and Services Monitoring
Monit is a free open source and web based process supervision utility that automatically monitors and managers system processes, programs, files, directories, permissions, checksums and filesystems.
It monitors services like Apache, MySQL, Mail, FTP, ProFTP, Nginx, SSH and so on. The system status can be viewed from the command line or using it own web interface.
12. NetHogs – Monitor Per Process Network Bandwidth
NetHogs is an open source nice small program (similar to Linux top command) that keeps a tab on each process network activity on your system. It also keeps a track of real time network traffic bandwidth used by each program or application.
NetHogs Linux Bandwidth MonitoringNetHogs Linux Bandwidth Monitoring
Read More : Monitor Linux Network Bandwidth Using NetHogs
13. iftop – Network Bandwidth Monitoring
iftop is another terminal-based free open source system monitoring utility that displays a frequently updated list of network bandwidth utilization (source and destination hosts) that passing through the network interface on your system. iftop is considered for network usage, what 'top' does for CPU usage. iftop is a 'top' family tool that monitor a selected interface and displays a current bandwidth usage between two hosts.
14. Monitorix – System and Network Monitoring
Monitorix is a free lightweight utility that is designed to run and monitor system and network resources as many as possible in Linux/Unix servers. It has a built in HTTP web server that regularly collects system and network information and display them in graphs. It Monitors system load average and usage, memory allocation, disk driver health, system services, network ports, mail statistics (Sendmail, Postfix, Dovecot, etc), MySQL statistics and many more. It designed to monitor overall system performance and helps in detecting failures, bottlenecks, abnormal activities etc.
... ... ...
April 17, 2013
Monitorix is witten in Perl, Licenced under GNU monitoring tool. It collects server and network data and display the information in graphs using its own web interface. Monitorix allows to monitor overall system performance and also help in detecting bottlenecks, failures, unwanted long response times and other abnormal activities.
It uses RRDtool to generate graphs and display them using web interface.
This tool is specifically created for monitoring Red Hat, CentOS, Fedora based Linux systems, but can run of ther flavours of Unix too.
Features
- System load average, active processes, per-processor kernel usage, global kernel usage and memory allocation.
- Monitors Disk drive temperatures and health.
- Filesystem usage and I/O activity of filesystems.
- Network traffic usage up to 10 network devices.
- System services including SSH, FTP, Vsftpd, ProFTP, SMTP, POP3, IMAP, POP3, VirusMail and Spam.
- MTA Mail statistics including input and output connections.
- Network port traffic including TCP, UDP, etc.
- FTP statistics with log file formats of FTP servers.
- Apache statistics of local or remote servers.
- MySQL statistics of local or remote servers.
- Squid Proxy Web Cache statistics.
- Fail2ban statistics.
- Monitor remote servers (Multihost).
- Ability to view statistics in graphs or in plain text tables per day, week, month or year.
- Ability to zoom graphs for better view.
- Ability to define the number of graphs per row.
- Built-in HTTP server.
For a full list of new features and updates, please check out the official feature page.
freshmeat.net
Monitorix is a lightweight system monitoring tool designed to monitor as many services and system resources as possible. It has been created to be used under production UNIX/Linux servers, but due to its simplicity and small size you may also use it on embedded devices as well. It mainly consists of two programs: a collector called monitorix, which is a Perl daemon that is started automatically like any other system service, and a CGI script called monitorix.cgi.
Aug 8, 2009 | HP Blogs
HP Operations Manager has long had the ability to monitor Linux servers. We are now getting ready to release a version of Operations Manager that runs on Linux. This complements our existing Operations Manager on Windows (OMW) and Operations Manager on Unix (OMU).
Testimonials
"Scout offers customization and extensibility without extra overhead, doing just what you need and then getting out of your way. It's just the kind of app our customers love, a simple solution for a complicated problem."
- Dan Benjamin, Hivelogic"Scout is the first server monitoring tool to find the right balance of simplicity and flexibility."
- Hampton Catlin, Unspace"Scout brilliantly eliminates the hassle of manually installing and updating monitoring scripts on each of our servers."
- Nick Pearson, Banyan Theory"I wrote a Scout plugin in about ten minutes - it's as simple as writing Ruby. And since I'm in love with Ruby, naturally, Scout is my new favorite tool for keeping an eye on my servers."
- Tim Morgan, Tulsa Ruby User Group"Support is excellent: swift, friendly, and helpful."
- Andrew Stewart, AirBlade Software"Server performance problems are notoriously hard to anticipate or reproduce. Scout's long memory and clean graphs make it an awesome tool for collecting and analyzing performance metrics of all kinds."
- Lance Ivy, UserVoice
This is a major review of Open Source products for Network and Systems Management.
The paper is available as a PDF file:
Note that the file is fairly large (18MB).
Oct 19, 2007 | Novell
Nagios is a popular host and service monitoring tool used by many administrators to keep an eye on their systems.
Since I wrote a basic installation guide in Jan 2006 on Cool Solutions many new versions were published and many Nagios plugins are now available. Because of that I think it's time to write a series of articles here that show you some very interesting solutions. I hope that you find them helpful and that you can use them in your environment. If you are not yet and nagios user I hope that I can inspire you and you give it a try.
I don't want to write here a full documentation about Nagios, I prefer to give you a basic installation guide so you can set it up very easy and play with it yourself. The installation guide will show you how to install Nagios as well as some interesting extensions and how they integrate into each other. During this installation you will make many modifications to the installation that will help to understand how it works, how you can integrate systems and different services. I will also provide some articles about monitoring special services where I describe what they do and what configuration changes are needed. All together should give you a very good overview and documentation on how you can enhance the Nagios installation yourself.
If you would like to read some detailed information about Nagios visit the documentation at the project homepage at http://www.nagios.org/docs or go through my short article from Jan 2006 at http://www.novell.com/coolsolutions/feature/16723.html
Munin the monitoring tool surveys all your computers and remembers what it saw. It presents all the information in graphs through a web interface. Its emphasis is on plug and play capabilities. After completing a installation a high number of monitoring plugins will be playing with no more effort.
Using Munin you can easily monitor the performance of your computers, networks, SANs, applications, weather measurements and whatever comes to mind. It makes it easy to determine "what's different today" when a performance problem crops up. It makes it easy to see how you're doing capacity-wise on any resources.
Munin uses the excellent RRDTool (written by Tobi Oetiker) and the framework is written in Perl, while plugins may be written in any language. Munin has a master/node architecture in which the master connects to all the nodes at regular intervals and asks them for data. It then stores the data in RRD files, and (if needed) updates the graphs. One of the main goals has been ease of creating new plugins (graphs).
This site is a wiki as well as a project management tool. We appreciate any contributions to the documentation. While this is the homepage of the Munin project, we will still make all releases through Sourceforge.
I used Nagios for health/performance monitoring of devices/servers for years at a previous job. It has been a while, and I'm starting to look into this space again. There are a lot more options out there for remote monitoring these days.
Here is what I have found that look good:
Do you know of any others I am missing? I'll update this list if I get replies. The requirement is that there must be an Open Source version of the tool.
5 comments:
- OpenNMS. Might be more than you need, but it's fully open source.
- February 24, 2009 1:19 PM

- Opsview is another one
- February 24, 2009 7:45 PM
- We use nagios2 installed from ubuntu 804 package.
We are planing to update to nagios 3 wich is available in ubuntu 810.
There are some nice addons like http://www.nagvis.org/screenshots
The best asset for nagios in our case is that it's very easy to developp new plugins. We complement this with some centralized administrative tool which allow us to deploy new plugins or change parameters: cfengine (for *nix) or SCCM 2007 for MS.
- February 26, 2009 5:03 PM
- @sysadim guy:
yea I really like Nagios a lot. I developed the WebInject plugin for it to monitor websites. My plugin is pretty popular:
www.webinject.orgStill haven't tried Nagios 3 yet
- February 26, 2009 5:07 PM
- I found the following slideshare presentation on monitoring systems very helpful
http://www.slideshare.net/KrisBuytaert/opensource-monitoring-tool-an-overview?nocache=5601
Also, dude, the webinject forum isn't working: e.g.
http://www.webinject.org/cgi-bin/forums/YaBB.cgi?board=Users;action=display;num=1201702796
Sep 3, 2008 | freshmeat.net
About: TraffStats is a monitoring and traffic analysis application that uses SNMP to collect data from any enabled device. It has the ability to generate graphs (using jpgraph) with the option to compare and sum up different devices. It has a multiuser-design with rights-management and support for multiple languages.
freshmeat.net
About: MUSCLE (Multi User Server Client Linking Environment) is an N-way messaging server and networking API. It includes client-side networking APIs for various languages, including C, C++, C#, Delphi, Java, and Python. MUSCLE lets programs communicate over a network via streams of serialized Message objects. The included server program ("muscled") lets its clients message each other and store information in its server-side hierarchical database. The database supports flexible queries via hierarchical wildcarding, and "live" updates via a subscription mechanism.
Changes: This release compiles again under Win32. A fork() vs forkpty() option has been added to the ChildProcessDataIO class. Directory and FilePathInfo classes have been added. There are other minor changes.
SourceForge.net
FSHeal aims to be a general filesystem tool that can scan and report vital "defective" information about the filesystem like broken symlinks, forgotten backup files, and left-over object files, but also source files, documentation files, user documents, and so on.
It will scan the filesystem without modifying anything and reporting all the data to a logfile specified by the user which can then be reviewed and actions taken accordingly.
About: httping is a "ping"-like tool for HTTP requests. Give it a URL and it will show how long it takes to connect, send a request, and retrieve the reply (only the headers). It can be used for monitoring or statistical purposes (measuring latency).
Changes: Binding to an adapter did not work and "SIGPIPE" was not handled correctly. Both of these problems were fixed.
freshmeat.net
About: check_oracle_health is a plugin for the Nagios monitoring software that allows you to monitor various metrics of an Oracle database. It includes connection time, SGA data buffer hit ratio, SGA library cache hit ratio, SGA dictionary cache hit ratio, SGA shared pool free, PGA in memory sort ratio, tablespace usage, tablespace fragmentation, tablespace I/O balance, invalid objects, and many more.
Release focus: Major feature enhancements
Changes: The tablespace-usage mode now takes into account when tablespaces use autoextents. The data-buffer/library/dictionary-cache-hitratio are now more accurate. Sqlplus can now be used instead of DBD::Oracle.
freshmeat.net
About: check_lm_sensors is a Nagios plugin to monitor the values of on-board sensors and hard disk temperatures on Linux systems.
Changes: The plugin now uses the standard Nagios::Plugin CPAN classes, fixing issues with embedded perl.
freshmeat.net
About: Ortro is a framework for enterprise scheduling and monitoring. It allows you to easily assemble jobs to perform workflows and run existing scripts on remote hosts in a secure way using ssh. It also tests your Web applications, creates simple reports using queries from databases (in HTML, text, CSV, or XLS), emails them, and sends notifications of job results using email, SMS, Tibco Rvd, Tivoli postemsg, or Jabber.
Changes: Key features such as auto-discovery of hosts and import/export tools are now available. The telnet plugin was improved and the mail plugin was updated. The PEAR libraries were updated.
freshmeat.net
check_logfiles 2.3.3 (Default)
Added: Sun, Mar 12th 2006 15:09 PDT (2 years, 1 month ago)
Updated: Tue, May 6th 2008 10:37 PDT (today)
About:check_logfiles is a plugin for Nagios which checks logfiles for defined patterns. It is capable of detecting logfile rotation. If you tell it how the rotated archives look, it will also examine these files. Unlike check_logfiles, traditional logfile plugins were not aware of the gap which could occur, so under some circumstances they ignored what had happened between their checks. A configuration file is used to specify where to search, what to search, and what to do if a matching line is found.
freshmeat.net
About: Plash is a sandbox for running GNU/Linux programs with minimum privileges. It is suitable for running both command line and GUI programs. It can dynamically grant Gtk-based GUI applications access rights to individual files that you want to open or edit. This happens transparently through the Open/Save file chooser dialog box, by replacing GtkFileChooserDialog. Plash virtualizes the file namespace and provides per-process/per-sandbox namespaces. It can grant processes read-only or read-write access to specific files and directories, mapped at any point in the filesystem namespace. It does not require modifications to the Linux kernel.
Changes: The build system for PlashGlibc has been changed to integrate better with glibc's normal build process. As a result, it is easier to build Plash on architectures other than i386, and this is the first release to support AMD-64. The forwarding of stdin/stdout/stderr that was introduced in the previous release caused a number of bugs that should now be fixed.
freshmeat.net
About: Tcpreplay is a set of Unix tools which allows the editing and replaying of captured network traffic in pcap (tcpdump) format. It can be used to test a variety of passive and inline network devices, including IPS's, UTM's, routers, firewalls, and NIDS.
Changes: This release dramatically improves packet timing, introduces full fragroute support in tcprewrite, and improves Windows/Cygwin and FreeBSD support. Additionally, a number of smaller enhancements have been made and user discovered bugs have been resolved. All users are strongly encouraged to update.
Qlusters, maker of the open source systems management software OpenQRM, last week announced on SourceForge.net that the most recent release of its OpenQRM systems management software would be the last from Qlusters.
onlamp.com
Imagine managing virtual machines and physical machines from the same console and creating pools of machines booted from identical images, one taking over from the other when needed. Imagine booting virtual nodes from the same remote iSCSI disk as physical nodes. Imagine having those tools integrated with Nagios and Webmin.
Remember the nightmare you ran into when having to build and deploy new kernels, or redeploy an image on different hardware? Stop worrying. Stop imagining. openQRM can do all of this.
openQRM, which just reached version 3.1, is an open source cluster resource management platform for physical and virtual data centers. In a previous life it was a proprietary project. Now it's open source and is succeeding in integrating different leading open source projects into one console. With a pluggable architecture, there is more to come. I've called it "cluster resource management," but it's really a platform to manage your infrastructure.
Whether you are deploying Xen, Qemu, VMWare, or even just physical machines, openQRM can help you manage your environment.
This article explains the different key concepts of openQRM
openQRM consists mainly of four components:
- A storage server, such as iSCSI or NFS volumes, which can export volumes to your clients.
- A filesystem image, captured by openQRM, created, or generated yourself.
- A boot image, from which the node boots, consisting of a kernel, its initrd, and a small filesystem containing openQRM tools.
- A virtual environment, which is actually the combination of a boot image and a filesystem.
freshmeat.net
About: OpenSMART is a monitoring (and reporting) environment for servers and applications in a network. Its main features are a nice Web front end, monitored servers requiring only a Perl installation, XML configuration, and good documentation. It is easy to write more checks. Supported platforms are Linux, HP/UX, Solaris, AIX, *BSD, and Windows (only as a client).
Changes: New checks include mqconnect, which tests if a connection to a WebSphere MQ QueueManager is possible; mysqlconnect, which tests if a connection to a MySQL database is possible; readfile, which tests if a file in a (potentially network-based) filesystem is readable; and db2lck, which tests if there are critical lock situations on your DB2 database. Many bugs were fixed. A username and password can be specified. Recursive include functionality was added for osagent.conf.xml. Major performance improvements were made.
freshmeat.net
dstat is a versatile replacement for vmstat, iostat, netstat, nfsstat, and ifstat. It includes various counters (in separate plugins) and allows you to select and view all of your system resources instantly; you can, for example, compare disk usage in combination with interrupts from your IDE controller, or compare the network bandwidth numbers directly with the disk throughput (in the same interval).
Release focus: Major feature enhancements
Changes:
Various improvements were made to internal infrastructure. C plugins are now possible too. New topcpu, topmem, topio/tiobio, and topoom process plugins were added along with new innodb, mysql, and mysql5 application plugins. A new vmknic VMware plugin was added. Various fixes and improvements were made to plugins and output.Author:
Dag Wieers [contact developer]
freshmeat.net
About: collectd is a small and modular daemon which collects system information periodically and provides means to store the values. Included in the distribution are numerous plug-ins for collecting CPU, disk, and memory usage, network interface and DNS traffic, network latency, database statistics, and much more. Custom statistics can easily be added in a number of ways, including execution of arbitrary programs and plug-ins written in Perl. Advanced features include a powerful network code to collect statistics for entire setups and SNMP integration to query network equipment.
Changes: Simple threshold checking and notifications have been added to the daemon. The hostname can now be set to the FQDN automatically. Inclusion files have been made more flexible by allowing shell wildcards and including entire directories. The new libvirt plugin is able to collect some statistics about virtual guest systems without additional software on the guests themselves. The perl plugin has been improved a lot. It can now handle multiple threads and is now longer considered experimental. The csv plugin can now convert counter values to rates.
freshmeat.net
About: SSH Factory is a set of Java based client components for communicating with SSH and telnet servers. Including both SSH (Secure Shell) and telnet components, developers will appreciate the easy-to-use API making it possible to communicate with a remote server using just a few lines of code. In addition, SSH Factory includes a full-featured scripting API and easy to use scripting language. This allows developers to build and automate complex tasks with a minimum amount of effort.
Changes: The SshTask and TelnetTask classes were updated so that when the cancel() method is invoked, the underlying thread is stopped without delay. Timeout support was improved in SSH and telnet related classes. The com.jscape.inet.ipclientssh.SshTunneler class was added for use in creating local port forwarding SSH tunnels. Proxy support was improved so that proxy data is no longer applied to the entire JVM. HTTP proxy support was added.
freshmeat.net
About: The sysstat package contains the sar, sadf, iostat, mpstat, and pidstat commands for Linux.
The sar command collects and reports system activity information. The statistics reported by sar concern I/O transfer rates, paging activity, process-related activites, interrupts, network activity, memory and swap space utilization, CPU utilization, kernel activities, and TTY statistics, among others.
The sadf command may be used to display data collected by sar in various formats. The iostat command reports CPU statistics and I/O statistics for tty devices and disks.
The pidstat command reports statistics for Linux processes. The mpstat command reports global and per-processor statistics.
Changes: This version takes account of all memory zone types when calculating pgscank, pgscand, and pgsteal displayed by sar -B. An XML Schema was added. NLS was updated, adding Dutch, Brazilian Portuguese, Vietnamese, and Kirghiz translations.
freshmeat.net
sarvant analyzes files from the sysstat utility "sar" and produces graphs of the collected data using gnuplot. It supports user-defined data source collection, debugging, start and end times, interval counting, and output types (Postscript, PDF, and PNG). It's also capable of using gnuplot's graph smoothing capability to soften spiked line graphs. It can analyze performance data over both short and long periods of time.
You will find here a tutorial describing a few use cases for some sysstat commands. The first section below concerns the sar and sadf commands. The second one concerns the pidstat command. Of course, you should really have a look at the manual pages to know all the features and how these commands can help you to monitor your system (follow the Documentation link above for that).
- Section 1: Using sar and sadf
- Section 2: Using pidstat
Right now, OpenESM has OpenESM for Monitoring v1.3. This release of the software is a combination of Zabbix, Apache, Simple Event Correlation and MySQL. Out of the box, we provide monitoring - warehousing of monitoring data - SLA reporting - correlation and notification. We offer the source code, but we also have a VMWARE based appliance.
First, thanks for writing something that seems to be clean and easy to extend. I have been using Nagios @ work for some time and am anxious to replace it.
Richard F. Rebel - whenu.com
Very nice -- we're just starting to test Argus for a small monitoring job, and so far it seems useful. Thanks for your contribution to the open source community. p>
Andre van Eyssen - gothconsultants.com
thanks great tool!! p
Sorin Esanu - from.ro
I am really happy with your soft, it is probably one of the best i have never found!
I own a hosting and this tool has been really cool for my business :)Raul Mate Galan - economiza.com
Argus works excellently. We use it to log data about all traffic through our router so that we can produce bandwidth usage statistics for customers.
Geoff Powell - lanrex.com.au
Conky is an advanced, highly configurable system monitor for X based on torsmo. Conky is an powerful desktop app that posts system monitoring info onto the root window. It is hard to set up properly (has unlisted dependencies, special command line compile options, and requires a mod to xorg.conf to stop it from flickering, and the apt-get version doesnt work properly). Most people can't get it working right, but its an AWESOME app if it can be set up right done.
monit is a utility for managing and monitoring, processes, files, directories and devices on a UNIX system. Monit conducts automatic maintenance and repair and can execute meaningful causal actions in error situations.Monit Features
* Daemon mode - poll programs at a specified interval
* Monitoring modes - active, passive or manual
* Start, stop and restart of programs
* Group and manage groups of programs
* Process dependency definition
* Logging to syslog or own logfile
* Configuration - comprehensive controlfile
* Runtime and TCP/IP port checking (tcp and udp)
* SSL support for port checking
* Unix domain socket checking
* Process status and process timeout
* Process cpu usage
* Process memory usage
* Process zombie check
* Check the systems load average
* Check a file or directory timestamp
* Alert, stop or restart a process based on its characteristics
* MD5 checksum for programs started and stopped by monit
* Alert notification for program timeout, restart, checksum, stop resource and timestamp error
* Flexible and customizable email alert messages
* Protocol verification. HTTP, FTP, SMTP, POP, IMAP, NNTP, SSH, DWP,LDAPv2 and LDAPv3
* An http interface with optional SSL support to make monit accessible from a webbrowserInstall Monit in Debian
#apt-get install monit
This will complete the installation with all the required software.
Configuring Monit
Default configuration file located at /etc/monit/monitrc you need to edit this file to configure your options
Sample Configuration file as follows and uncomment all the following options
## Start monit in background (run as daemon) and check the services at 2-minute
## intervals.
#
set daemon 120## Set syslog logging with the 'daemon' facility. If the FACILITY option is
## omited, monit will use 'user' facility by default. You can specify the
## path to the file for monit native logging.
#
set logfile syslog facility log_daemon## Set list of mailservers for alert delivery. Multiple servers may be
## specified using comma separator. By default monit uses port 25 - it is
## possible to override it with the PORT option.
#
set mailserver localhost # primary mailserver## Monit by default uses the following alert mail format:
From: monit@$HOST # sender
Subject: monit alert - $EVENT $SERVICE # subject$EVENT Service $SERVICE
Date: $DATE
Action: $ACTION
Host: $HOST # body
Description: $DESCRIPTIONYour faithful,
monit## You can override the alert message format or its parts such as subject
## or sender using the MAIL-FORMAT statement. Macros such as $DATE, etc.
## are expanded on runtime. For example to override the sender:
#
set mail-format { from: [email protected] }## Monit has an embedded webserver, which can be used to view the
## configuration, actual services parameters or manage the services using the
## web interface.
#
set httpd port 2812 and
use address localhost # only accept connection from localhost
allow localhost # allow localhost to connect to the server and
allow 172.29.5.0/255.255.255.0
allow admin:monit # require user 'admin' with password 'monit'# Monitoring the apache2 web services.
# It will check process apache2 with given pid file.
# If process name or pidfile path is wrong then monit will
# give the error of failed. tough apache2 is running.
check process apache2 with pidfile /var/run/apache2.pid#Below is actions taken by monit when service got stuck.
start program = "/etc/init.d/apache2 start"
stop program = "/etc/init.d/apache2 stop"
# Admin will notify by mail if below of the condition satisfied.
if cpu is greater than 60% for 2 cycles then alert
if cpu > 80% for 5 cycles then restart
if totalmem > 200.0 MB for 5 cycles then restart
if children > 250 then restart
if loadavg(5min) greater than 10 for 8 cycles then stop
if 3 restarts within 5 cycles then timeout
group server#Monitoring Mysql Service
check process mysql with pidfile /var/run/mysqld/mysqld.pid
group database
start program = "/etc/init.d/mysql start"
stop program = "/etc/init.d/mysql stop"
if failed host 127.0.0.1 port 3306 then restart
if 5 restarts within 5 cycles then timeout#Monitoring ssh Service
check process sshd with pidfile /var/run/sshd.pid
start program "/etc/init.d/ssh start"
stop program "/etc/init.d/ssh stop"
if failed port 22 protocol ssh then restart
if 5 restarts within 5 cycles then timeoutYou can also include other configuration files via include directives:
include /etc/monit/default.monitrc
include /etc/monit/mysql.monitrcThis is only sample configuration file. The configuration file is pretty self-explaining; if you are unsure about an option, take a look at the monit documentation http://www.tildeslash.com/monit/doc/manual.php
After configuring your monit file you can check the configuration file syntax using the following command
#monit -t
Once you don't have any syntax errors you need to enable this service by changing the file /etc/default/monit
# You must set this variable to for monit to start
startup=0to
# You must set this variable to for monit to start
startup=1Now you need to start the service using the following command
#/etc/init.d/monit start
Monit Web interface
Monit Web interface will run on the port number 2812.If you have any firewall in your network setup you need to enable this port.
Now point your browser to http://yourserverip:2812/ (make sure port 2812 isn't blocked by your firewall), log in with admin and monit.If you want a secure login you can use https check here
Monitoring Different Services
Here's some real-world configuration examples for monit. It can be helpful to look at the examples given here to see how a service is running, where it put its pidfile, how to call the start and stop methods for a service, etc. Check here for more examples.
freshmeat.net
Ortro is a Web-based system for scheduling and application monitoring. It allows you to run existing scripts on remote hosts in a secure way using ssh, create simple reports using queries from databases (in HTML, text, CSV, or XLS) and email them, and send notifications of job results using email, SMS, Tibco Rvd, Tivoli postemsg, or Jabber.
Release focus: Major feature enhancements
Changes: Support for i18n was added, and English and Italian languages are now available. More plugins were added, such as zfs scrub check, svc check, and zpool check for Solaris. Session check and tablespace check for Oracle and Check Uri were added. The mail, custom_query, ping, and www plugins were updated. There are bugfixes and improvements for the GUI such as the "add" button in the toolbar. The PEAR libraries were updated to the latest stable version.
Be wouldn't it be tough for IT managers sell higher-ups on the virtues on a open source monitoring tool? It might be worth the effort, said James Turnbull, author of Pro Nagio 2.0. Turnbull spoke recently with SearchOpenSource.com Assistant Editor MiMi Yeh about how Nagios is different from its counterparts in the commercial world and why IT shops should give it a chance.What sets Nagios apart from other open source network monitoring tools like Big Brother, OpenNMS, OpenView and SysMon?
James Turnbull: I think there are three key reasons why Nagios is superior to many other products in this area -- ease of use, extensibility and community. Getting a Nagios server up and running generally only takes a few minutes. Nagios is also easily integrated and extended either by being able to receive data from other applications or sending data to reporting engines or other tools. Lastly, Nagios has excellent documentation backed up with a great community of users who are helpful, friendly and knowledgeable. All these factors make Nagios a good choice for enterprise management in small, medium and even large enterprises.
... ... ...
What tips, best practices and gotchas can you offer to sys admins working with Nagios?
Turnbull: I guess the best recommendation I can give is read the documentation. The other thing is to ask for help from the community -- don't be afraid to ask what you think are dumb questions on Wikis, Web sites, forums or mailing lists. Just remember the golden rule of asking questions on the Internet -- provide all the information you can and carefully explain what you want to know.
Are there workarounds to address the complaint that Nagios has no individual IP addresses for each host and service must be defined?
Turnbull: I think a lot of the 'automated' discovery tools are actually more of a hindrance than a help. One of the big flaws of enterprise monitoring is monitoring without context. It's all well and good to go out across the network and detect all your hosts and add them to the monitoring environment, but what do all these devices do?
You need to understand exactly what you are monitoring and why. When something you are monitoring fails, you not only know what that device is but what the implications of that failure are. Nagios is not a business context/business process tool. The fact that you have to think clearly about what you want to monitor and how means that you are more aware of your environment and the components that make up that environment.
Is there any advice you would give to users?
Turnbull: The key thing to say to new users is to try it out. All you need is a spare server and a few hours and you can configure and experiment with Nagios. Take a few problems areas you've had with monitoring and see if you can solve them with Nagios. I think you'll be pleasantly surprised.
Samba (windows file/domain server)
Hint: For enhanced controllability of the service it is handy to split up the samba init file into two pieces, one for smbd (the file service) and one for nmbd (the name service).
 check process smbd with pidfile /opt/samba2.2/var/locks/smbd.pid
   group samba
   start program = "/etc/init.d/smbd start"
   stop  program = "/etc/init.d/smbd stop"
   if failed host 192.168.1.1 port 139 type TCP  then restart
   if 5 restarts within 5 cycles then timeout
   depends on smbd_bin

 check file smbd_bin with path /opt/samba2.2/sbin/smbd
   group samba
   if failed checksum then unmonitor
   if failed permission 755 then unmonitor
   if failed uid root then unmonitor
   if failed gid root then unmonitor
check process nmbd with pidfile /opt/samba2.2/var/locks/nmbd.pid group samba start program = "/etc/init.d/nmbd start" stop program = "/etc/init.d/nmbd stop" if failed host 192.168.1.1 port 138 type UDP then restart if failed host 192.168.1.1 port 137 type UDP then restart if 5 restarts within 5 cycles then timeout depends on nmbd_bin check file nmbd_bin with path /opt/samba2.2/sbin/nmbd group samba if failed checksum then unmonitor if failed permission 755 then unmonitor if failed uid root then unmonitor if failed gid root then unmonitor
Systher is a small Perl tool that collects system information and presents it as an XML document. The information is collected using standard Unix tools, such as
netstat,uptimeandlsof.Systher can be used in many ways:
- When invoked from the command line, Systher simply shows the state of the system where it was invoked.
- Systher can be run as a stand-alone daemon, listening to an arbitrary TCP port, so that callers can remotely obtain the system information.
- Systher can be run as a cgi-bin script, so that browsers can connect to it.
In order to make the obtained information readable for humans, Systher is equipped with an XSLT processing stylesheet to convert the XML information into HTML. That way, the information can be made visible in a browser.
freshmeat.net
About: ZABBIX is an enterprise-class distributed monitoring solution for networks and applications. Native high-performance ZABBIX agents allow monitoring of performance and availability data of all operating systems.
Changes: This release introduces support of centralized distributed monitoring, flexible auto-discovery, advanced Web monitoring, and much more.
freshmeat.net
Unix Server Monitoring Scripts is a suite that will monitor Unix disk space, Web servers via HTTP, and the availability of SMTP servers via SMTP. It will save a history of these events to diagnose and pinpoint problems. It also sends a message via email if a Web server is down or if disk usage exceeds one of two thresholds. Each script acts independently of the others.
Main Scripts
- Web Server Monitoring Script: Monitor_web.sh
- Unix Disk Monitoring Script: Monitor_disk.sh
- SMTP Monitoring Script: Monitor_smtp.sh
- System Monitoring Dashboard: Monitor_stats.pl
- DNS Monitoring Script: NEW!! Monitor_dns.sh
Support Scripts
- Send_alert.pl (used for sending alerts instead of using /bin/mail)
- Connect.pl (used for testing ports)
- Banner.pl (used for testing emails)
Tarball of all files in the Suite
Feb 08, 2007 | SearchNetworking.com
Network monitoring and management applications can be costly and cumbersome, but recently a host of companies have sprung forth offering an open source alternative to IBM Tivoli, HP OpenView, CA and BMC -- and they're starting to gain traction.
The major commercial software vendors, known as the "big four," are frequently criticized for their high cost and complexity and, in some cases, are chided for being too robust -- having too many features that some enterprise users may find completely unnecessary.
Many of the open source alternatives are quick to admit that their solutions aren't for everyone, but they bring to the table arguments in their favor that networking pros can't ignore, namely low cost and ease of use.
"Open source is a huge phenomenon," Zenoss CEO and co-founder Bill Karpovich said. "It's providing an alternative for end users."
Zenoss makes Core, an integrated IT monitoring product that lets IT admins manage the status and health of their infrastructure through a single Web-based console. The latest version of the free, open source software features automated change tracking, automatic remediation, and expanded reports and export capabilities.
According to Karpovich, Zenoss software monitors complete networks, servers, applications, services, power and related environments. The biggest benefit, however, is its openness, meaning that users can tailor it to their systems any way they choose.
"It's complete enterprise IT monitoring," Karpovich said. "It's network monitoring and management, application management, and server management all through a single pane of glass."
Flexibility included
Some users have said the Tivolis and OpenViews of the world are hard to customize and very inflexible, but open source alternatives are often the opposite. They are known for their flexibility. "You can use the product as you want," Karpovich said.Nagios developer Ethan Galstad said flexibility is a major influence on enterprises looking to move ahead with an open source monitoring project. Nagios makes open source software that monitors network availability and the states of devices and services.
"You have as an end user much more influence on the future of the feature set," Galstad said, adding that through the open source community, end users can request a feature they want, discuss the pros and cons and, in many cases, implement that feature within a relatively short time.
And for things that Nagios and other open source monitoring tools don't do, end users can tie the tools in with other solutions to create the environment they want.
"There are a lot of hooks," Galstad said.
2006-07-28 | howtoforge.com
OpenNMS is an opensource enterprise network management tool. It helps network administrators to monitor critical services on remote machines and collects the information of remote nodes by using SNMP. OpenNMS has a very active community, where you can register yourself to discuss your problems. Normally OpenNMS installation and configuration takes time, but I have tried to cover the installation and configuration part in a few steps.
OpenNMS provides the following features.
ICMP Auto Discovery
SNMP Capability Checking
ICMP polling for interface availability
HTTP, SMTP, DNS and FTP polling for service availability
Fully distributed client server architecture
JAVA Real-time console to allow moment-to-moment status of the network
XML using XSL style web access and reporting
Business View partitioning of the network using policies and rules
Graphical rule builder to allow graphical drag/drag relationships to be built
JAVA configuration panels
Redundant and overlapping pollers and master station
Repeating and One-time calendaring for scheduled downtimeThe source code of OpenNMS is available for download from sourceforge.net. A production release (stable) and a development release (unstable), I have used 1.2.7 stable release in this howto.
I have tested this configuration with Redhat/Fedora, Suse, Slackware, Debian and it works smoothly. I am assuming that readers already have Linux background. You can use the following configuration for other distributions too. Before you start OpenNMS installation, you need to install following packages:
- jdk1.5*
- tomcat 4.*
- postgres 8.*
- rrdtool1.2*
March 10, 2006 | howtoforge.com
Zabbix has the capability to monitor just a about any event on your network from network traffic to how many papers are left in your printer. It produces really cool grahps.
In this howto we install software that has an agent and a server side. The goal is to end up with a setup that has a nice web interface that you can show off to your boss ;)
It's a great open source tool that lets you know what's out there.
This howto will not go into setting up the network but I might rewrite it one day so I really like your input on this. Much of what is covered here is in the online documentation however if you are like me new to this all this might be of some help to you.
freshmeat.net
GroundWork unifies leading open source projects like Nagios, Ganglia, RRDtool, Nmap, Sendpage, and MySQL, and offers a wide range of support for operating systems (Linux, Unix, Windows, and others), applications, and networked devices for complete enterprise-class monitoring.
Release focus: Major feature enhancements
New features include:
- Incorporation of RRD data: enhancing GWMOS with other tools that use RRDs should be much easier
- Performance graphing of historical data using the RRD data
- UI improvements to give you access to information of interest, with fewer clicks, in a cleaner interface
In addition to the source tarball downloadable fr the SVN repository is also accessible.GroundWork Monitor Open Source (GWMOS) 5.1-01 Bootable ISO now available: this image should boot cleanly in any ix86-compatible computer, or boot the image in a virtualized environment such as VMWare or Xen. It's a simple, super fast mechanism for evaluating GWMOS while setting up temporary monitoring quickly at any site: just pop in the CD and boot!
The GroundWork Monitor Open Source Bootable ISO automatically boots, logs you in, launches Firefox, and starts up GroundWork with all the associated services such as apache, Nagios(R), MySQL, and RRDtool, etc. all loaded and running.
The ISO is set up with included profiles to monitor the host system and two internet sites out-of-the-box, giving you some immediate data to observe without setting up any additional devices. When booted from a physical CD, everything runs in the computer's RAM: the hard drive of the host computer is never touched.
Have fun, and keep us posted on your experience at http://www.groundworkopensource.com/community/
Linux.com
I have used BigBrother and Nagios for a long time to troubleshoot network problems, and I was happy with them -- until Zabbix came along. Zabbix is an enterprise-class open source distributed monitoring solution for servers, network services, and network devices. It's easier to use and provides more functionality than Nagios or BigBrother.
Zabbix is a server-agent type of monitoring software, meaning you have a Zabbix server where all gathered data is collected, and a Zabbix agent running on each host.
All Zabbix data, including configuration and performance data, is stored in a relational database -- MySQL, PostgreSQL, or Oracle -- on the server.
Zabbix server can run on all Unix/Linux distributions, and Zabbix agents are available for Linux, Unix (AIX, HP-UX, Mac OS X, Solaris, FreeBSD), Netware, Windows, and network devices running SNMP v1, v2, and v3.
March 05, 2007 | InfoWorld
OpenNMS bests OpenView and Tivoli while Ipswitch spreads the FUD
Filed under: InfrastructureChalk up another victory for OSS over proprietary. OpenNMS beat out both OpenView and Tivoli in the SearchNetworking Product Leadership Awards. I wonder if that will shut up this ridiculous FUD from Ipswitch "Don't trust your network to open source."
I let Travis take the shots at this foolishness...wake up, Ipswitch, you are late to the FUD train. Javier...anything from you?
Myth #1 - Open Source is free - According to Greene, downloading open source from the Internet and then customizing to your environment "often is not a good use of your time." Greene adds that he'd "rather pay an upfront fee for software that does what I need and doesn't have any high-cost labor attached to it."Hmmm ... what about the fact that proprietary software (and *especially* network monitoring and management products) are often tremendously difficult to install / configure / maintain ongoing? How is being held hostage to a vendor for support / installation / configuration preferable? And how is being tied to a predetermined feature set preferable to having the ability to customize an open source approach solution to meet your environment's needs?Myth #2 - Bug fixes are faster and less expensive in an open source environment - the second "myth" that Greene exposes around open source is the notion that there are thousands of developers sitting at home contributing labor for free. Greene suggests that most of the contributing vendors are typically employed by large vendors ? and that "even when those individuals generously offer their time for free, can you really afford to wait for one to agree with you on the urgency of action if your network is down."Hmmm ...so it's better NOT to have access to the source code when you have a bug? It's preferable to have to open a help ticket with the vendor and wait in line? It's better NOT to have general visibility into the bugs and issues being reported by the members of the user community?Myth #3 - Your IT staff can buy a 'raw' tool and shape it to their needs - Greene's last point is that the industry has moved away from the "classic open source" model where folks download raw open source and customize to their needs - and to more of a commercial open source model, where organizations are leveraging open source distribution as a way to sell services.Feedback:
Hi,Not a very valid comparison as there are many products out there that do a far better job the HP OpenView or OpenNMS or Tivoli.
If you are an OSS type supporter in terms of your business model it would make finacial sense to use OpenNMS but in terms of best of breed this OSS product does not come close. Some might argue that using OSS software will cost you more as there are very few people who know how to use it and I mean use it, not some Linux script kiddy but someone with enterprise management experience. These days its not about implementation its about integration and the comparison should be about how nice does it play with the rest of my environment.
I don't see EMC SMARTS in the comparison list.
I am all for OSS software as long as it is not chosen as the cheapest option but rather as the best of breed option. As for NMS commercial software, I use it day in and day out and would like to see a more open model in terms of functionality and development.
Take a leaf out of SUN book, Open Solaris has proven to be a good business model for a commercial company and the benefits will be seen for years to come.
Posted by: James at March 8, 2007 04:34 AM
Networking.com
GOLD AWARD: OpenNMS
The network is the central nervous system of the modern enterprise -- complex and indispensable. Keeping tabs on how that enterprise is functioning requires a sophisticated "big picture" management system that can successfully integrate with other network and IT products. Unfortunately, many products in this category are just too expensive for any but the largest companies (with the most generous IT budgets) to afford.
Enter OpenNMS, the gold medal winner in our network and IT management platforms category. The open source enterprise-grade network management system was designed as a replacement for more expensive commercial products such as IBM Tivoli and HP OpenView. It periodically checks that services are available, isolates problems, collects performance information, and helps resolve outages. And it's free.
In our Product Leadership survey, readers praised OpenNMS for being easy to customize, easy to integrate and -- of course -- free. These attributes are all characteristic of any open source product. Because of its open source nature, OpenNMS has a community of developers contributing to its code. The code is open for anyone to view or adapt to suit individual needs.
Consequently, users can customize OpenNMS in ways that are limited only by their abilities and imagination -- not by licensing restraints. One reader said, "It is an open source product, so we can customize it easily." With traditional proprietary products, it may be difficult to find one piece of software that can manage the network effectively for every enterprise, but OpenNMS was designed to allow users to add management features over time. Its intentional compatibility with other open source (and proprietary) products provides seamless integration, requiring less piecemeal coding to fit things together.
Users of OpenNMS can also take advantage of the user community accessible through the OpenNMS Web site for answers to questions and help in troubleshooting problems. While one survey respondent remarked that "open source is advancing slowly to address some of the manageability issues," members of the OpenNMS mailing list are quick to answer any request with a friendly, knowledgeable response. For companies whose IT personnel are not afraid of an unconventional approach, the open source community provides support that is just as reliable as that of a commercial vendor -- and in many cases, more helpful.
But OpenNMS is not a "you get what you pay for" product, either. Readers said it "works great" and "significantly helped our network's bandwidth and packet management and controlled 'rogue' clients." Others found that it "works fine for a small business network" and is an "outstanding option." Even those whose experience was less positive found that any challenges were surmountable, such as the reader who said, "Since it's free, it was worth the effort."
Sys Admin
It is impossible to do systems administration without monitoring and alerting tools. Basically, these tools are scripts, and writing such monitoring scripts is an ancient part of systems administration that's often full of dangerous mistakes and misconceptions.
The traditional way of putting systems together is very stochastic and erratic, and that same method is often followed when developing monitoring tools. It is really rare to find a system that's been properly planned and designed from the start. The usual approach when something goes wrong is just to patch the immediate problem. Often, there are strange results from people making mistakes when they're in a hurry and under pressure.
Monitoring scripts are traditionally fired from root cron and send results by email. These emails can accumulate over time, flooding people with strange mails, creating problems on the monitored system, and causing other unexpected situations. Such scenarios are often unavoidable, because few enterprises can afford better measures than firefighting. In this article, I will mention a few tips that can be helpful when developing monitoring scripts, and I will provide three sample scripts.
What is a Unix Monitoring Script?
A monitoring tool or script is part of system management and to be really efficient must be part of an enterprise-wide effort, not a standalone tool. Its purpose is to detect problems and send alerts or, rarely, to try to correct the problem. Basically, a monitoring/alerting tool consists of four different parts:
- Configuration -- Defines the environment and does initializations, sets the defaults, etc.
- Sensor -- Collects data from the system or fetches pre-stored data.
- Conditions -- Decides whether events are fired.
- Actions -- Takes action if events are fired.
If these elements are simply bundled into a script without thinking, the script will be ineffective and un-adaptable. Good tools also include an abstraction layer added to simplify things later, when modifications are done.
To begin, we have to set some values, do some sanity checks, and even determine whether monitoring is allowed. In some situations, it is good to stop monitoring through the control file to avoid false notifications, during maintenance for example. This is all done in the configuration part of the script.
The script collects values from the system -- from monitored processes or the environment. This data collecting is done by the sensor part. This data can be the output of an external command or can be fetched from previously stored values, such as the current df output or previously stored df values (see Listing 1).
The conditions part of the script defines the events that are monitored. Each condition detects whether an event has happened and whether this is the start or the end of the event (arming or rearming). This process can compare current values to predefined limits or to stored values, if we are interested in rates instead of absolute values. Events can also be based on composite or calculated values, such as "Average idle from sar for the last 5 minutes is less than 10%" (see Listing 2).
Results at this level are logical values usually presented as some kind of empty/not-empty string, to be easily manipulated in later usage. The key is to have some point in the code where the clear status of the event is defined, so branching can be done simply and easily.
Actions consist of specific code that is executed in the context of a detected event, such as storing new values, sending traps, sending email, or performing some other automatically triggered action. It is good to put these into functions or separate scripts, since you can have similar actions for many events. Usually we want to send email to someone or send a trap. It is almost always the same code in all scripts, so keeping it separate is a good idea.
It is important to add some state support. We are not just interested in detecting limit violations; if that were the case, we would be flooded with messages. Detecting state changes can reduce unwanted messaging. When we define an event in which we are interested, we actually want to know when the event happened and when it ended -- that is, when the monitored values passed limits and when they returned. We are not interested in full-time notification that the event is still occurring. Thus, we need to know the change of the event state and value of the monitored variable.
State support is not necessary if there is some kind of console that can correlate notifications. In the simplest implementations, like a plain monitoring script, avoiding message flooding directly in the script itself is useful.
Each event must have a unique name and severity level. Usually, three levels of severity are enough, but sometimes five levels are used. It is best to start with a simple model such as:
Info -- Just information that something has happened
IBM Redbooks
Warning -- Warning of possible dangerous situation
Fatal -- Critical situation
- A Practical Guide for Resource Monitoring and Control (RMC), SG24-6615-00 -- http://www.redbooks.ibm.com/redbooks/SG246615.html
- Managing AIX Server Farms, SG24-6606-00 Redbook --http://www.redbooks.ibm.com/redbooks/SG246606.html
Books
- Frisch, Æleen. Essential System Administration, 3rd Edition, August 2002. O'Reilly & Associates. ISBN: 0-596-00343-9.
- Powers, Shelley, J. Peek, T. O'Reilly, and M. Loukides. Unix Power Tools, 3rd Edition, October 2002. O'Reilly & Associates. ISBN: 0-596-00330-7.
- Blank-Edelman, David. Perl for System Administration, 1st Edition, July 2000. O'Reilly & Associates. ISBN: 1-56592-609-9.
Links
- Stokely Consulting -- http://www.stokely.com/unix.sysadm.resources/index.html
- Big Brother Archive -- http://www.deadcat.net/browse.php
- BigAdmin Scripts -- http://www.sun.com/bigadmin/scripts/
- Shelldorado -- http://www.shelldorado.com
Damir Delija has been a Unix system engineer since 1991. He received a Ph.D. in Electrical Engineering in 1998. His primary job is systems administration, education, and other system-related activities.
Sys Admin
All of the scripts listed in this article are meant to be run from cron on a regular basis -- daily or hourly, depending on the routine in question -- with the output going to either email or to the systems administrator's pager. However, none of the things described in this article are foolproof. UNIX security mechanisms are only relevant if the root account has not been compromised. For example, scripts run through crontab can be easily disabled or modified if the attacker has attained root access, and most log files can be manipulated to cover tracks if the intruder has control over the root account.
I tested out OpenNMS but found Nagios to be easier to get running, plus OpenNMS was very linux centric last I checked. Which is annoying since it looks like it's just a java application, no reason it couldn't be made to run elsewhere.
Anyway, as far as I can tell Nagios does everything OpenNMS does and more. As a network monitoring tool it's been great, I have it polling all of our SNMP enabled devices and receiving traps. With the host and service dependencies it becomes easier to see if the cause of an application failure is software, hardware, or network based.
That being said I would still love to play with OpenNMS if anyone has a way to get it to work under FreeBSD.
On Thursday 10 October 2002 04:52 pm, Alan Horn wrote:
> On 10 Oct 2002, Stephen L Johnson wrote:
> >If your are mainly monitoring networks, network monitoring tools are
> >better. The non-commercials tools, that I have looked at are OpenNMS and
> >Naigos (NetSaint). These tools are designed monitor network mainly.
> >Systems monitoring can be added as well.
>
> Nagios is primarily for monitoring network _services_ in it's default
> install (via the nagios plugins you get with the tool). Not for monitoring
> network devices (although it'll do that too). I just wanted to clarify
> that since I read this as 'nagios for monitoring cisco kit etc...' By
> network services I mean stuff like DNS, webservers, smtp, imap, etc... All
> the services that you probably want to monitor first of all when you set
> out to do thia.
>
> Adding systems monitoring with nagios is very nice indeed, using the NRPE
> (Nagios Remote Plugin Executor) module, you can run whatever arbitrary
> code you desire on your system, and return results back to the monitor. I
> have it monitoring diskspace on critical fileservers, health of some
> custom applications etc...
>
> I've used nagios, nocol, and big brother (many many moons ago.. it's
> evolved since I used it). Nagios most recently. Nagios takes a bit of work
> to setup due to its flexibility, but I've found it to be the best for my
> needs in both a single and multi-site situation (we have branch offices
> located around the world via VPN which need to be monitored).
>
> And the knowledge of network topology is great too !
>
> Hope this helps.
>
> Cheers,
>
> Al
David Nolan
Fri, 08 Sep 2006 05:49:55 -0700On 9/3/06, Toddy Prawiraharjo <toddyp@...> wrote:
>
> Hello all,
>
> I am looking for alternative to Nagios (or should i stick with it? need
> opinions pls), and saw this Mon.The choice between Mon and other OSS monitoring systems like Nagios, Big Brother or any of the others is very much dependent upon your needs.
My best summary of Mon is that its monitoring for sysadmins. Its not pretty, its not designed for management, its designed to allow a sysadmin to automate the performance monitoring that might otherwise be done ad-hoc or with cron jobs. It doesn't trivially provide the typical statistics gathering that many bean-counters are looking for, but its extensible and scalable in amazing ways. (See recent posts on this list about one company deploying a network of 2400 mon servers and 1200 locations, and my mon site which runs 500K monitoring tests a day, some of those on hostgroups with hundreds of hosts.)
> Btw, i need some auto-monitoring tools to monitor basic unix and windows > based services, such as nfs, sendmail, smb, httpd, ftp, diskspace, etc.
> I love perl so much, but then its been long time since it's been updated. Is it still around and supported?
If you love perl, Mon may be perfect for you, because if there is a feature you need you can always send us a patch. :)
Its definitely still around and supported. (I just posted a link to a mon 1.2.0 release candidate.) There hasn't been a lot of updates to the system in the last couple of years, but that's in part because the system is pretty stable as-is. There are certainly some big-picture changes we would like to do, but none of the current developers have had pressing reasons to work on the system. Personally, most of my original patches were based on CMU's needs when we did our Mon deployment, and since that time no major internal effort has been spent on extending the system. A review process of our monitoring systems is just starting now and that may result in either more programmer time being allocated to Mon or CMU might move away from Mon to some other system. (Obviously I'd be unhappy with that result, but I would continue to work with Mon both personally and in my consulting work.)
> Any good reference on the web interface? (the one from the site, mon.lycos.com is dead).
I believe the most commonly used interface is mon.cgi, maintained by Ryan Clark, available at http://moncgi.sourceforge.net/
An older version of mon.cgi is included in the mon distribution.
> And most importantly, where to
> start? (any good documentation as starting point on how to use this Mon)Start by reading the documentation, looking at the sample config file, and experimentation. A small installation can be setup in a matter of minutes. Once you've done a proof-of-concept install you can decide if Mon is right for you.
-David
Nov 27, 2006
I'm looking for suggestions for any GPL/opensource system monitoring tools that folks can recommend.
FYI we've been using Nagios for about 6 months now with mixed results. While it works, we've had to do an awful lot of customization and writing our own checks (mostly application-level stuff for our proprietary software).
I think we would be a lot happier with something simpler and more flexible than Nagios. Right now it's a choice between further hacking of Nagios vs. "roll our own" (the latter, I think, will be much more maintainable over the long run). But of course I'm looking to avoid reinventing the wheel as much as possible.Any feedback or pointers are much appreciated.
thanks, JBRe: [BBLISA] GPL system monitoring tools? (alternatives to nagios)
Jason Qualkenbush
Tue, 28 Nov 2006 06:35:56 -0800I don't know about that. Nagios is really a roll your solution. All it really does is manage the polling intervals between checks. Just about everything else is something most people are going to write custom to their environments.
Just make sure you limit the active checks to simple things like ping, url, and some port checking. The system health checks (like disks, cpu usage, application checks) are really best done on the host itself. Just run a cron (or whatever the windows equivalent is) job that checks the system and submits the results to the nagios server via a passive check.
What customizations are you doing? The config files? What exactly is Nagios failing to do?
Re: [BBLISA] GPL system monitoring tools? (alternatives to nagios)
John P. Rouillard
Tue, 28 Nov 2006 12:48:17 -0800
In message <[EMAIL PROTECTED]>,
"Scott Nixon" writes:
>We have been looking at OpenNMS(opennms.org). It is developed full time
>by the OpenNMS Group(opennms.com). It was designed from the ground up to
>be an Enterprise class monitoring solution. If your interested, I'd
>suggest listening to this podcast with the *manager* of OpenNMS Tarus
>Balog (http://www.twit.tv/floss15).
I talked with Mr. Balog at the 2004 LISA IIRC. The big thing that makes opennms a non-starter for me was the inability to create dependencies between services. It's a pain to do in nagios but it's there and that is a critical tools for enterprise level operations. A fast perusal of the OpenNMS docs doesn't show that feature.
Compared to nagios the OpenNMS docs seem weak.
Also at the time all service monitors had to be written in java. I think there were plans to make a shell connector that would allow you to run any program and feed it's output back to OpenNMS. That means all the nagios plugins could be used with a suitable shell wrapper.
OpenNMS had a much nicer web interface and better access control IIRC. But at the time I don't think you could schedule downtime in the web interface. Alo I just looked at the demo and didn't see it (but that may be because it's a demo).
On the nice side, having multiple operational problem levels (5/6 IIRC) rather then nagios's 3: ok, warning, and critical was something I wished Nagios had.
Also the ability to annotate the events with more info than nagios allows was a win, but something similar could be done in nagios.
I liked it it just didn't provide the higher level functionality that we needed.
John Rouillard
===========================================================================
My employers don't acknowledge my existence much less my opinions.Feb 20
Nagios is frankly not very good, but it's better than most of the alternatives in my opinion. After all, you could spend buckets of cash on HP OpenView or Tivoli and still be faced with the same amount of work to customize it into a useful state....
Among the free alternatives, in my experience Big Brother is too unstable to trust, which makes me loath to buy a license as required for a commercial use.
Mon is quite good at monitoring and alerting, but it has all the same problems as Nagios plus a lack of sexy web GUI. I also don't like the way it handles service restoration alerts or blocking outages (dependencies) or multiple concurrent outages.
For an easy way to get started with Nagios, try GroundWork Monitor Open Source: it unifies Nagios with lots of other open source IT tools and is much easier to set up than vanilla Nagios.
freshmeat.net
About: Hyperic HQ is a distributed infrastructure management system whose architecture assures scalability, while keeping the solution easy to deploy. HQ's design is meant to deliver on the promise of a single integrated management portal capable of managing unlimited types of technologies in environments that range from small business IT departments to the operations groups of today's largest financial and industrial organizations.
Changes: This release features significant new functionality, including Operations Dashboard, a central view for real-time, general health of the entire infrastructure managed.
More powerful alerting is provided with alert escalation, alert acknowledgment, and RSS actions.
Event tracking and correlation provides historical and real-time information from any log resource, configuration file, or security module that can be correlated with availability, utilization, and performance.
freshmeat.net
About: DeleGate is a multi-purpose application level gateway or proxy server that mediates communication of various protocols, applying cache and conversion for mediated data, controlling access from clients, and routing toward servers. It translates protocols between clients and servers, converting between IPv4 and IPv6, applying SSL (TLS) to arbitrary protocols, merging several servers into a single server view with aliasing and filtering. It can be used as a simple origin server for some protocols (HTTP, FTP, and NNTP).
Changes: This version supports "implanted configuration parameters" in the executable file of DeleGate to restrict who can execute the executable and which functions of it are available, or to tailor the executable adapting to the environment in which it is used.
Linux.com
Conky is a lightweight system monitor that provides essential information in an easy-to-understand, highly customizable interface. The software is a fork of TORSMO, which is no longer maintained. Conky monitors your CPU usage, running processes, memory, and swap usage, and other system information, and displays the information as text or as a graph.
Debian and Fedora users can use apt-get and yum respectively to install Conky. A source tarball is also available.
Zenoss
Zenoss is an IT infrastructure monitoring product that allows you to monitor your entire infrastructure within a single, integrated software application.
Key features include:
- Monitors the entire stack
- networks, servers, applications, services, power, environment, etc...
- Monitors across all perspectives
- discovery, configuration, availability, performance, events, alerts, etc...
- Affordable and easy to use
- unlike the big suites offered by IBM, HP, BMC, CA, etc...
- unlike first generation open source tools...
- Complete open source package
- complete solution available as free, open source software
ZABBIX is a 24×7 monitoring solution without high cost.
ZABBIX is software that monitors numerous parameters of a network and the health and integrity of servers. ZABBIX uses a flexible notification mechanism that allows users to configure e-mail based alerts for virtually any event. This allows a fast reaction to server problems. ZABBIX offers excellent reporting and data visualization features based on the stored data. This makes ZABBIX ideal for capacity planning.
ZABBIX supports both polling and trapping. All ZABBIX reports and statistics, as well as configuration parameters are accessed through a web-based front end. A web-based front end ensures that the status of your network and the health of your servers can be assessed from any location. Properly configured, ZABBIX can play an important role in monitoring IT infrastructure. This is equally true for small organizations with a few servers and for large companies with a multitude of servers.
LinuxPlanet
Eyeing systems management as the next big market to "go open source," Zenoss, Inc. is now trying to give mid-sized customers another alternative beyond the two main choices available so far: massive suites from the "Big Four" giants or a mishmash of specialized point solutions.
"We're focusing on the IT infrastructures of the 'mid-market.' These aren't 'Mom and Pops.' They're organizations with about 50 to 5,000 employees, or $50 million to $500 million in revenues," said Bill Karpovich, CEO of the software firm
Earlier in May, the Zenoss, Inc.-sponsored Zenoss Project joined hands with Webmin, the Emu Software-sponsored NetDirector, and several other open source projects to form the Open Management Consortium (OMC).
Right now, a lot of mid-sized companies and not-for-profits are still struggling to string together effective systems management approaches with specialized tools such as WhatsUp Gold and Ipswitch's software.
Historically, organizations in this bracket have been largely ignored by the "Big Four"--IBM, Hewlett-Packard, BMC, and Computer Associates, according to Karpovich.
"These companies have concentrated mainly on the Fortune 500, and their suites are very heavy and expensive," Karpovich charged, during an interview with LinuxPlanet.
But Karpovich anticipates that the Big Four could start to widen their scope quite soon, spurred by analysts' projections of stellar growth in the systems management space.
Mercy Hospital, a $400 million health care facility in Baltimore, is one medium-sized organization that has already turned down overtures from a Big Four vendor in favor of Zenoss.
"We'd been using a hodgepodge of tools from different vendors," according to Jim Stalder, the hospital's CIO, who cited SolarWinds and Cisco as a couple of examples.
But over the past few years, Mercy's IT mainly Windows-based infrastructure has expanded precipitously, Stalder maintained, in another interview.
Mercy chose Zenoss over a Big Four alternative mostly on the basis of cost, according to the hospital's CIO.
Zenoss doesn't charge for its software, which is offered under GPL licensing. Karpovich said. Instead, its revenue model is built around professional services--including customization, integration, staff training, and best practices consulting -- and support fees.
Alternatively, organizations can "use their own resources" or hire other OMC partners or other third-party consultants for professional services.
Zenoss users can also customize the software code for integration or other purposes.
"We used to have 100 servers, but now we have close to 200," Stalder said. "Mercy has done a good job of embracing (advancements in) health care IT. But sometimes your staffing budget doesn't grow as linearly as your infrastructure. And it got difficult to keep tabs on all these servers with fewer (IT) people on hand."
Also according to Karpovich, many organizations--particularly in the midrange tier--don't need all of the features offered in the IBM/HP/BMC/CA suites.
As inspiration behind Xenoss' effort, he pointed to the success of JBoss in the open source application server market, EnterpriseDB and Postgres among databases, and SugarCRM in the CRM arena.
"All of these markets have been moving to open source one by one. And they've all been turned on their heads by really strong vendors. We expect that systems management will be the next place where open source has a big impact, and we want to lead the charge," he told LinuxPlanet.
"We want to do something that's somewhere 'in the middle,' offering a very rich solution with enterprise-grade monitoring at a price mid-sized organizations can afford."
Karpovich maintained that, to step beyond "first-generation" open source tools, Zenoss replaces the traditional ASCII interface with a template-enabled GUI geared to easy systems configurability.
The system also provides autodiscovery and many other features also found in pricier systems.
Zenoss revolves around four key modules: inventory configuration; availability monitoring; performance monitoring; and event management.
The inventory configuration module contains its own autopopulated database. "This is not just an ASCII. We've built a database that understands relationships. For a server, for example, this means, 'What are patches?' There's a real industry trend around ITIL, and we are doing that. A lot of commercial vendors are also talking about CDMD, and we'll be pushing that back toward open source," according to Karpovich.
The available monitoring in Zenoss is designed to assure that applications "are 'up' and responding," he told LinuxPlanet.
The performance monitoring module makes it possible to track metrics such as disk space over time, and to generate user configurable threshold-based alerts.
The event management capability, on the other hand, offers a centralized area for consolidating events. "Every Windows server has event logging. But we let you bring together events (from multiple servers) and prioritize them," according to the Zenoss CEO.
For his part, Mercy Hospital's Stalder is mainly quite satisfied with Zenoss. "So far, so good. This represented a major savings opportunity for us, and we wouldn't have used a fraction of the features in a (Big Four) suite," he told LinuxPlanet.
"We went live (with Zenoss) in early April, and got it up and running very quickly. We've been able to turn off several other tools, as a result. And Zenoss has shown us several (IT infrastructure) problems we weren't even aware existed," he said.
For example, in rolling up the logs of its SQL Server databases, Mercy found out that several databases weren't being backed up properly.
The hospital did need to turn on the SNMP in its servers to get autoduscovery to work. "But this was only because we'd never turned it on before," he added.
Yet Stalder did point to a couple of features on his future wish list for Zenoss. He'd like the software to include notification escalation--"so that if Joe doesn't respond to his pager, you can reach him somewhere else"--as well as a "synthetic transaction generator," to "emulate how the application appears to a user logging on."
But Karpovich readily admits that there's room for more functionality in the Zenoss environment. In fact, that's one of the main reasons behind the decision to join other open source ISVs in founding the OMC, he suggested.
"With our partners, we're building an ecosystem around products and systems integration," he told LinuxPlanet. "We haven't yet decided yet where all of us will fit. But we want to provide (customers) with all that they need for systems management. In areas where we don't have standards for integration, we can collaborate on integration."
Other founding members of the Open Management Consortium include Nagios, an open source project sponsored by Ayamon; openQRM, sponsored by Qlusters; and openSIMS, sponsored by Symtiog.
The consortium also plans to create a "systems integration repository around best practives for sharing instrumentation," Karpovich said.
"The business model is kind of like that of SugarCRM. Partners will build their own businesses selling services. Then, if one of their customers wants Zenoss, for example, the partner will get a commission," he elaborated.
But Zenoss will also do its best to avoid the bloatware phenomenon associated with the Big Four suites, according to Karpovich.
"One of the things people don't like about the 'Big Four' is that if they don't buy capabilities now, it will cost them more later. With Zenoss, you're not under that kind of pressure," the CEO told LinuxPlanet.
BixData addresses the major areas of management and monitoring.
System Management
- Excels at the retrieval of important system information and the modification of settings for critical services and installed software
Application monitoring
- Monitor critical aspects of applications and their performance. Through support for WMI on the Windows platforms, full application monitoring of any major Windows server application is supported, such as Exchange Server mail boxes or SQL server connection pools. It also supports .NET application monitoring
Network monitoring
- Supports monitoring of any device with SNMP
Performance monitoring
- Monitors critical operating system, hardware and software performance, including memory, processor, network and storage and specific application usage of resources
Hardware monitoring
- Native support for SMART hard disk information that includes monitoring of ATA, Serial ATA and SCSI hard disks
freshmeat.net
Host Grapher is a very simple collection of Perl scripts that provide graphical display of CPU, memory, process, disk, and network information for a system.
There are clients for Windows, Linux, FreeBSD, SunOS, AIX and Tru64. No socket will be opened on the client, nor will SNMP be used for obtaining the data.
Six of the leading open source systems management vendors are to announce that they have created a new consortium to further the adoption of open source systems management software and develop open standards.
The Open Management Consortium has been founded by a group of open source systems management and monitoring players, including
- Qlusters Inc,
- Emu Software Inc,
- Zenoss Inc,
- Symbiot Inc,
- the Webmin project, a
- nd Ayamon LLC, the consultancy company of Nagios creator, Ethan Galstad.
04/20/2006 | Linux Howtos and Tutorials
In this article I will describe how to monitor your server with munin and monit. munin produces nifty little graphics about nearly every aspect of your server (load average, memory usage, CPU usage, MySQL throughput, eth0 traffic, etc.) without much configuration, whereas monit checks the availability of services like Apache, MySQL, Postfix and takes the appropriate action such as a restart if it finds a service is not behaving as expected. The combination of the two gives you full monitoring: graphics that lets you recognize current or upcoming problems (like "We need a bigger server soon, our load average is increasing rapidly."), and a watchdog that ensures the availability of the monitored services.
Among the network-management start-ups that received second rounds of funding:
Company Product/description Latest funding Cittio WatchTower – enterprise monitoring and management software. March 2006 – $8 million from JK&B Capital, Hummer Winblad Venture Partners. GroundWork Open Source Solutions GroundWork Monitor Professional – IT monitoring tool based on open source software. March 2005 – $8.5 million from Mayfield, Canaan Partners. LogLogic LogLogic 3 – appliance that aggregates and stores log data. September 2004 – $13 million from Sequoia Capital, Telesoft Partners and Worldview Technology Partners. Splunk Splunk – downloadable software to search logs generated by hardware and software. January 2006 – $10 million from JK&B Capital
Moodss is a modular monitoring application, which supports operating systems (Linux, UNIX, Windows, etc.), databases (MySQL, Oracle, PostgreSQL, DB2, ODBC, etc.), networking (SNMP, Apache, etc.), and any device or process for which a module can be developed (in Tcl, Python, Perl, Java, and C). An intuitive GUI with full drag'n'drop support allows the construction of dashboards with graphs, pie charts, etc., while the thresholds functionality includes emails and user defined scripts. Monitored data can be archived in an SQL database by both the GUI and the companion daemon, so that complete history over time can be made available from Web pages or common spreadsheet software. It can even be used for future behavior prediction or capacity planning, from the included predictor tool, based on powerful statistical methods and artificial neural networks.
freshmeat.net
Big Sister is Perl-based, SNMP-aware monitoring program consisting of a Web-based server and a monitoring agent. It runs under various Unixes and Windows.
To better understand Splunk Base, look no further than the online encyclopedia Wikipedia.
Like Wikipedia, Splunk Base provides a global repository of user-regulated information, but the similarities end there. Splunk Inc. will formally unveil Splunk Base this week at the LinuxWorld 2006 Conference for all to see its free-of-charge community stockpiled error messages and troubleshooting tips for IT professionals from IT professionals -- for any system they can get their hands on.
At the head of this community effort is Splunk's chief community Splunker Patrick McGovern, who picked up much of his community experience while working with developers when he managed the open source project repository SourceForge.net.
Now at Splunk, McGovern manages Splunk Base, a global wiki of IT events that grants IT workers access to information about specific events recorded by any application, system or device.
freshmeat.net
Monit is a utility for managing and monitoring processes, files, directories, and devices on a Unix system. It conducts automatic maintenance and repair and can execute meaningful causal actions in error situations. It can be used to monitor files, directories, and devices for changes, such as timestamps changes, checksum changes, or size changes. It is controlled via an easy to configure control file based on a free-format, token-oriented syntax. It logs to syslog or to its own log file and notifies users about error conditions via customizable alert messages. It can perform various TCP/IP network checks, protocol checks, and can utilize SSL for such checks. It provides an HTTP(S) interface for access.
freshmeat.net
About: Zabbix is software that monitors your servers and applications. Polling and trapping techniques are both supported. It has a simple, yet very flexible notification mechanism, and a Web interface that allows quick and easy administration. It can be used for logging, monitoring, capacity planning, availability and performance measurement, and providing the latest information to a helpdesk.
Changes: This release introduces automatic refresh of unsupported items, support for SNMP Counter64, new naming schema for ZABBIX agent's parameters, more flexible user-defined parameters for UserParameters, double sided graphs, configurable refresh rate, and other enhancements.
["] user comment on ZABBIX
by LEM - Nov 17th 2004 05:07:23Excellent _product_:
. easy to install and configurue
. easy to custom
. easy to use
. very good functional level (multiple maps, availability, trigger/alerts dependancies, SLA calculation)
. use very few ressourcesI've been using ZABBIX to monitor about 500 éléments (servers, routers, switches...) in a heterogenous environment (windows, unices, snmp-aware equipements).
An excellent alternative to Nagios and MoM+Minautore.
["] Best network monitor I 've seen
by robertj - Feb 7th 2003 15:29:38This is a GREAT project. Best monitor I've seen. Puts the Big Brother monitoring to shame.
freshmeat.net
MoSSHe (MOnitoring with SSH Environment) is a simple, lightweight (both in size and system requirements) server monitoring package designed for secure and in-depth monitoring of a number of typical Internet systems.
It was developed to keep the impact on network and performance low, and to use a safe, encrypted connection for in-depth inspection of the system checked. It is not possible to remotely run (more or less arbitrary) commands via the monitoring system, nor is unsafe cleartext SNMP messaging necessary (yet possible). A read-only Web interface makes monitoring and status checks simple (and safe) for admins and helpdesk.
Checking scripts are included for remote services (DNS, HTTP, IMAP2, IMAP3, POP3, samba, SMTP, and SNMP) and local systems (disk space, load, CPU temperature, fan speed, free memory, print queue size and activity, processes, RAID status, and shells).
SEC is an open source and platform independent event correlation tool that was designed to fill the gap between commercial event correlation systems and homegrown solutions that usually comprise a few simple shell scripts. SEC accepts input from regular files, named pipes, and standard input, and can thus be employed as an event correlator for any application that is able to write its output events to a file stream. The SEC configuration is stored in text files as rules, each rule specifying an event matching condition, an action list, and optionally a Boolean expression whose truth value decides whether the rule can be applied at a given moment.
Regular expressions, Perl subroutines, etc. are used for defining event matching conditions. SEC can produce output events by executing user-specified shell scripts or programs (e.g., snmptrap or mail), by writing messages to pipes or files, and by various other means.
Faced with an increasing number of deployed Linux servers and no budget for commercial monitoring tools, our company looked into open-source solutions for gathering performance and security information from our Unix environment. There are many open-source monitoring packages to choose from, including Big Sister and Nagios to name a few. Though some of these try to provide an all-in-one solution, I knew we would probably end up combining a few tools to obtain the metrics we were looking for. This article is meant to give a general overview of the steps in building a monitoring solution. Take a look at the demo here which is a scaled down model of our production monitoring portal.
Required Packages
Package Link mrtg-2.10.15.tar.gz http://people.ee.ethz.ch/~oetiker/webtools/mrtg/ gd-2.0.28.tar.gz http://www.boutell.com/gd/ libpng-1.0.14-7 http://www.libpng.org/pub/png/libpng.html zlib-1.2.1.tar.gz http://www.gzip.org/zlib rrdtool-1.0.49.tar.gz http://people.ee.ethz.ch/~oetiker/webtools/rrdtool/pub/ apache-2.0.51.tar.gz http://www.apache.org angel-0.7.3.tar http://www.paganini.net/angel/ I started out with a base Red Hat ES 3.0 installation but any flavor of Linux will work. Depending on your distro, some of the above required packages might be already installed, particularly libpng, zlib and gd. You can check if any of these are installed by issuing the following from the command line;
rpm –qa | grep packagename
I selected MRTG (Multi-Router Traffic Grapher) for the base statistics engine. This tool is mainly used for tracking statistics on network devices but it can be easily modified to track performance metrics on your Unix or Windows servers. The instructions for installing MRTG on Unix can be found here. The gd, libpng and zlib packages are required to be compiled and installed before MRTG can be fired up. Even though you might have already installed them, if you try to compile MRTG with the default package installations, it will probably complain about various things including GD locations. For your sanity, you'll want to install these packages from scratch using the instructions from the MRTG website since they require specific "--" options when compiled. If you're feeling creative, you can also rebuild the SRPM's from source. Be sure to exclude these packages in the Up2date or Yum configuration files since when updates to these packages become available, the "update" application will overwrite your custom RPM's.
RRDTOOL is used as a backend database to store statistics gathered from MRTG. By default, MRTG stores data in text files which it gathers through SNMP. This method is fine for a few servers but when your environment starts growing, you'll need a faster method of reading and storing data. RDDTool (Round Robin Database) enables storage of server statistics into a compact database. Future versions of MRTG are going to use this format by default so you might as well start using it now.
Angelfire is great front-end tool for monitoring servers via ICMP and services running over TCP. This Perl program runs from CRON and generates a HTML table which contains the status of your devices. Color bars represent the status of the server. (Green=GOOD : Yellow=LATENCY >100ms : Red=UNREACHABLE).
For Apache, I used the default installation that comes with Red Hat. No need to install a fresh copy plus it will be easier to maintain for updates using RHN.
Proactive security checks are a mandatory part of system administration these days. Nessus is a great vulnerability scanner plus the HTML output options makes incorporating this into the portal very easy.
September 2004 | Linux Magazine
When using Linux in a business environment, it's important to monitor resource utilization. System monitoring helps with capacity planning, alerts you to performance problems, and generally makes managers happy.
So, in this month's "Tech Support," let's install Cacti, a resource monitoring application that utilizes RRDtool as a back-end. RRDTool stores and displays time-series data, such as network bandwidth, machine-room temperature, and server load average. With Cacti and RRDtool, you can graph system performance in a way that will not only make it more useful, it'll also impress your pointy-haired boss.
Start with RRDtool. Written by Tobi Oetiker (of MRTG fame) and licensed under the GNU General Public License (GPL), you can download RRDtool from http://people.ee.ethz.ch/~oetiker/webtools/rrdtool/download.html. Build and install the software with:
$ ./configure; make
# make install; make site-perl-install
To ease upgrades, you should also link /usr/local/rrdtool to the /usr/local/rrdtool-version directory created by make install.
Now that you have RRDtool installed, you're ready to install Cacti. Cacti is a complete front-end to RRDtool (based on PHP and MySQL) that stores all of the information necessary to create and populate performance graphs. Cacti utilizes templates, supports multiple graphing hierarchies, and has its own user-based authentication system, which allows administrators to create users and assign them different permissions to the Cacti interface. Also licensed under the GPL, Cacti can be downloaded from http://www.raxnet.net/products/cacti.
The first step to install Cacti is to unpack its tarball into a directory accessible via your web server. Next, create a MySQL database and user for Cacti (this article uses cacti as the database name). Optionally, you can also create a system account to run Cacti's cron jobs.
Once the Cacti database is created, import its contents by running mysql cacti < cacti.sql. Depending on your MySQL setup, you may need to supply a username and password for this step.
After you've imported the database, edit include/config.php and specify your Cacti MySQL database information. Also, if you plan to run Cacti as a user other than the one you're installing it as, set the appropriate permissions on Cacti's directories for graph/log generation. To do this, type chown cactiuser rra/ log/ in the Cacti directory.
You can now create the following cron job...
*/5 * * * * /path/to/php /path/to/www/cacti >
  /dev/null > 2&1
... replacing /path/to/php with the full pathname to your command-line PHP binary and /path/to/www/cacti with the web accessible directory you unpacked the Cacti tarball into.
Now, point your web browser to http://your-server/cacti/ and login with the default username and password of admin and admin. You must change the administrator password immediately. Then, make sure you carefully fill in all of the path variables on the next screen.
By default, Cacti only monitors a few items, such as load average, memory usage, and number of processes. While Cacti comes pre-configured with some additional data input methods and understands SNMP if you have it installed, its power lies in the fact that you can graph data created by an arbitrary script. You can find a list of contributed scripts at http://www.raxnet.net/products/cacti/additional_scripts.php, but you can easily write a script for almost anything.
To create a new graph, click on the "Console" tab and create a data input method to tell Cacti how to call the script and what to expect from it. Next, create a data source to tell Cacti how and where the data is stored, and create a graph to tell Cacti how to display the data. Finally, add the new graph to the "Graph View" to see the results.
While Cacti is a very powerful program, many other applications also utilize the power of RRDtool, including Cricket, FlowScan, OpenNMS, and SmokePing. Cricket is a high performance, extremely flexible system for monitoring trends in time-series data. FlowScan analyzes and reports on Internet Protocol (IP) flow data exported by routers and produces graph images that provide a continuous, near real-time view of network border traffic. OpenNMS is an open source project dedicated to the creation of an enterprise grade network management platform. And SmokePing measures latency, latency distribution, and packet loss in your network.
You can find a comprehensive list of front-ends available for RRDtool at http://people.ee.ethz.ch/~oetiker/webtools/rrdtool/rrdworld. Using some of these RRDtool-based applications in your environment will not only make your life easier, it may even get you a raise!
Spong
What is Spong?
Spong is a simple systems and network monitoring package. It does not compete with Tivoli, OpenView, UniCenter, or any other commercial packages. It is not SNMP based, it communcates via simple TCP based messages. It is written in Perl. It can currently run on every major Unix and Unix-like operating systems.
Feaures
- client based monitoring (CPU, disk, processes, logs, etc.)
- monitoring of network services (smtp, http, ping, pop, dns, etc.)
- grouping of hosts (routers, servers, workstations, PCs)
- rules based messaging when problems occur
- configurable on a host by host basis
- results displayed via text or web based interface
- history of problems
- verbose information to help diagnosis problems
- modular programs to makes it easy to add or replace check functions or features
- Big Brother BBSERVER emulation to allow Big Brother Clients to be used
Sample Spong Setup
This is my development Spong setup on my home network. It is Spong version 2.7. There are a lot of new features that have been added since verson 2.6f. But if you click on the "Hosts" Link in the top frame, you will get a good feel of how Spong 2.6f looks and works.
License
Spong is free software issued released under the GNU General Public License or the Perl Artistic License. You may choice whichever license is appropriate for your usage.
Documentation
Don't let the amount of documentation scare you, I still think spong is simple to setup and use.
Documentation for Spong is included with every release. For version 2.6f, the documentation is in HTML format located in the www/docs/ directory and is self contained (the links will still work if you move it), so you should be able to copy it to whatever location that you want. An online copy of the documentation is available here.
The documentation for Spong 2.7. is not complete. It is under going a complete rewrite into POD formation. This change will enable the documentation to converted into a multitude of different formats (i.e. HTML, man, text, etc.).
Release Notes / Changes
The CHANGE file for each release functions are the Release Notes and Change Log for each verion of Spong. The CHANGES file for Spong 2.6f is available here and the CHANGES file for Spong 2.7 is available here.
freshmeat.net
Argus is a system and network monitoring application. It will monitor nearly anything you ask it to monitor (TCP + UDP applications, IP connectivity, SNMP OIDS, etc). It presents a clean, easy-to-view Web interface. It can send alerts numerous ways (such as via pager) and can automatically escalate if someone falls asleep.
freshmeat.net
RRDutil is a a tool to collect statistics (typically every 5 minutes) from multiple servers, store the values in RRD databases (using RRDtool), and plot out pretty graphs to a Web server on demand. The graph types shown include CPU, memory, disk (space and I/O), Apache, MySQL queries and query types, email, Web hits, and more.
Google matched content |
This far more comprehensive page that this one but with slightly different focus, although host monitoring and network monitoring now by-and-large overlap.
This is a list of tools used for Network (both LAN and WAN) Monitoring tools and where to find out more about them. The audience is mainly network administrators. You are welcome to provide links to this web page. Please do not make a copy of this web page and place it at your web site since it will quickly be out of date.
Argus is a system and network monitoring application. It will monitor nearly anything you ask it to monitor (TCP + UDP applications, IP connectivity, SNMP OIDS, etc). It presents a clean, easy-to-view Web interface. It can send alerts numerous ways (such as via pager) and can automatically escalate if someone falls asleep.
Sys Admin > Using Email to Perform UNIX System Monitoring and ControlBig Sister is an SNMP-aware monitoring program consisting of a Web-based server and a monitoring agent. It runs under various Unixes and Windows. Big Sister does for you:
- monitor networked systems
- provide a simple view on the current network status
- notify you when your systems are becoming critical
- generate a history of status changes
- log and display a variety of system performance data
Moodss is a modular monitoring application, which supports operating systems (Linux, UNIX, Windows, etc.), databases (MySQL, Oracle, PostgreSQL, DB2, ODBC, etc.), networking (SNMP, Apache, etc.), and any device or process for which a module can be developed (in Tcl, Python, Perl, Java, and C).
An intuitive GUI with full drag'n'drop support allows the construction of dashboards with graphs, pie charts, etc., while the thresholds functionality includes warning by emails and user defined scripts. Any part of the visible data can be archived in an SQL database by both the GUI and the companion daemon, so that complete history over time can be made available from Web pages, common spreadsheet software, etc.
Homepage:
http://moodss.sourceforge.net/
MoSSHe (MOnitoring with SSH Environment) is a simple, lightweight (both in size and system requirements) server monitoring package designed for secure and in-depth monitoring of a number of typical Internet systems. It was developed to keep the impact on network and performance low, and to use a safe, encrypted connection for in-depth inspection of the system checked. It is not possible to remotely run (more or less arbitrary) commands via the monitoring system, nor is unsafe cleartext SNMP messaging necessary (yet possible). A read-only Web interface makes monitoring and status checks simple (and safe) for admins and helpdesk. Checking scripts are included for remote services (DNS, HTTP, IMAP2, IMAP3, POP3, samba, SMTP, and SNMP) and local systems (disk space, load, CPU temperature, fan speed, free memory, print queue size and activity, processes, RAID status, and shells).
Etc
nPULSE is a Web-based network monitoring package for Unix-like operating systems. It can quickly monitor up to thousands of sites/devices at a time on multiple ports. nPULSE is written in Perl and comes with its own (SSL optional) Web server for extra security.
Sentinel System Monitor is a plugin-based, extendable remote system monitoring utility that focuses on central management and flexibility while still being fully-featured. Stubs are used to allow remote monitoring of machines using probes. Monitoring can support multiple architectures because the monitoring probes are filed by a library process that hands out probes based on OS/arch/hostname. Execution of blocks can be triggered by either test failure or success.
It uses XML for configuration and OO Perl for most programming. Support for remote command execution via plugins allows reaction blocks to be created that can try and repair possible problems immediately, or just notify an administrator that there is a problem.
Open (SourceSystem) Monitoring and Reporting Tool
OpenSMART is a monitoring (and reporting) environment for servers and applications in a network. Its main features are a nice Web front end, monitored servers requiring only a Perl installation, XML configuration, and good documentation. It is easy to write more checks. Supported platforms are Linux, HP/UX, Solaris, *BSD, and Windows (only as a client).
InfoWatcher
InfoWatcher is a system and log monitoring program written in Perl. The major components of InfoWatcher are SLM and SSM. SLM is a log monitoring and filter daemon process which can monitor multiple logfiles simultaneously, and SSM is a system/process monitoring utility that monitors general system health, process status, disk usage, and others. Both programs are easily configurable and extensible.
Network And Service Monitoring System
Network and Service Monitoring System is a tool for assisting network administrators in managing and monitoring the activities of their network. It helps in getting the status information of critical processes running at any machine in the network.
It can be used to monitor the bandwidth usage of individual machines in the network. It also performs checks for IP-based network services like POP3, SMTP, NNTP, FTP, etc., and can give you the status of the DNS server. The system uses MySQL for storing the information, and the output is displayed via a Web interface.
Kane Secure Enterprise
(http://www.intrusion.com/products/technicalspec.asp?lngProdNmId=3) should
do everything you require, I also suggest you check out Andy's great IDS
site (www.networkintrusion.co.uk) (that's another fiver you owe me, Andythe best I can recommend is medusa DS9. it's configurable and makes machine secure. the computer with medusa using old bind (ver 8) and old sendmail (ver 8.10??) with no patches. it runs linux 2.2.5. machine was not rooted for nearly two years...
medusa homepage:
http://medusa.terminus.sk
http://medusa.fornax.sk
GMem 0.2
Gmem is a tool to monitor the memory usage of your system using GTK progress bars and uptime using the proc filesystem. It's configurable and user friendly.
The goal of the Benson Distributed Monitoring System project is to make a distributed monitoring system with the extensibility and flexibility of mod_perl. The end goal is for system administrators to be able to script up their own alerts and monitors into an extensible framework which hopefully lets them get sleep at night. The communication layer uses standard sockets, and the scripting language for the handlers is Perl. It includes command line utilities for sending, listing, and acknowledging traps, and starting up the benson system. There is also a Perl module interface to the benson network requests.
Network And Service Monitoring System
Network and Service Monitoring System is a tool for assisting network administrators in managing and monitoring the activities of their network. It helps in getting the status information of critical processes running at any machine in the network. It can be used to monitor the bandwidth usage of individual machines in the network. It also performs checks for IP-based network services like POP3, SMTP, NNTP, FTP, etc., and can give you the status of the DNS server. The system uses MySQL for storing the information, and the output is displayed via a Web interface.
Author:
Sreehari Nair [contact developer]
Monfarm is an alarm-enabled monitoring system for server farms. It produces dynamically updated HTML status pages showing the availability of servers. Alarms are generated if servers become unavailable.
Sentinel System Monitor is a plugin-based, extendable remote system monitoring utility that focuses on central management and flexibility while still being fully-featured. Stubs are used to allow remote monitoring of machines using probes. Monitoring can support multiple architectures because the monitoring probes are filed by a library process that hands out probes based on OS/arch/hostname. Execution of blocks can be triggered by either test failure or success. It uses XML for configuration and OO Perl for most programming. Support for remote command execution via plugins allows reaction blocks to be created that can try and repair possible problems immediately, or just notify an administrator that there is a problem.
Open (Source|System) Monitoring
and Reporting Tool
A monitoring tool with few dependencies, nice frontend, and easy extensibility.
Demarc PureSecure
An all-inclusive network monitoring client/server program and Snort frontend.
Percival Network Monitoring System
AAFID2
Framework for distributed system and network monitoring
Society
Groupthink : Two Party System as Polyarchy : Corruption of Regulators : Bureaucracies : Understanding Micromanagers and Control Freaks : Toxic Managers : Harvard Mafia : Diplomatic Communication : Surviving a Bad Performance Review : Insufficient Retirement Funds as Immanent Problem of Neoliberal Regime : PseudoScience : Who Rules America : Neoliberalism : The Iron Law of Oligarchy : Libertarian Philosophy
Quotes
War and Peace : Skeptical Finance : John Kenneth Galbraith :Talleyrand : Oscar Wilde : Otto Von Bismarck : Keynes : George Carlin : Skeptics : Propaganda : SE quotes : Language Design and Programming Quotes : Random IT-related quotes : Somerset Maugham : Marcus Aurelius : Kurt Vonnegut : Eric Hoffer : Winston Churchill : Napoleon Bonaparte : Ambrose Bierce : Bernard Shaw : Mark Twain Quotes
Bulletin:
Vol 25, No.12 (December, 2013) Rational Fools vs. Efficient Crooks The efficient markets hypothesis : Political Skeptic Bulletin, 2013 : Unemployment Bulletin, 2010 : Vol 23, No.10 (October, 2011) An observation about corporate security departments : Slightly Skeptical Euromaydan Chronicles, June 2014 : Greenspan legacy bulletin, 2008 : Vol 25, No.10 (October, 2013) Cryptolocker Trojan (Win32/Crilock.A) : Vol 25, No.08 (August, 2013) Cloud providers as intelligence collection hubs : Financial Humor Bulletin, 2010 : Inequality Bulletin, 2009 : Financial Humor Bulletin, 2008 : Copyleft Problems Bulletin, 2004 : Financial Humor Bulletin, 2011 : Energy Bulletin, 2010 : Malware Protection Bulletin, 2010 : Vol 26, No.1 (January, 2013) Object-Oriented Cult : Political Skeptic Bulletin, 2011 : Vol 23, No.11 (November, 2011) Softpanorama classification of sysadmin horror stories : Vol 25, No.05 (May, 2013) Corporate bullshit as a communication method : Vol 25, No.06 (June, 2013) A Note on the Relationship of Brooks Law and Conway Law
History:
Fifty glorious years (1950-2000): the triumph of the US computer engineering : Donald Knuth : TAoCP and its Influence of Computer Science : Richard Stallman : Linus Torvalds : Larry Wall : John K. Ousterhout : CTSS : Multix OS Unix History : Unix shell history : VI editor : History of pipes concept : Solaris : MS DOS : Programming Languages History : PL/1 : Simula 67 : C : History of GCC development : Scripting Languages : Perl history : OS History : Mail : DNS : SSH : CPU Instruction Sets : SPARC systems 1987-2006 : Norton Commander : Norton Utilities : Norton Ghost : Frontpage history : Malware Defense History : GNU Screen : OSS early history
Classic books:
The Peter Principle : Parkinson Law : 1984 : The Mythical Man-Month : How to Solve It by George Polya : The Art of Computer Programming : The Elements of Programming Style : The Unix Hater’s Handbook : The Jargon file : The True Believer : Programming Pearls : The Good Soldier Svejk : The Power Elite
Most popular humor pages:
Manifest of the Softpanorama IT Slacker Society : Ten Commandments of the IT Slackers Society : Computer Humor Collection : BSD Logo Story : The Cuckoo's Egg : IT Slang : C++ Humor : ARE YOU A BBS ADDICT? : The Perl Purity Test : Object oriented programmers of all nations : Financial Humor : Financial Humor Bulletin, 2008 : Financial Humor Bulletin, 2010 : The Most Comprehensive Collection of Editor-related Humor : Programming Language Humor : Goldman Sachs related humor : Greenspan humor : C Humor : Scripting Humor : Real Programmers Humor : Web Humor : GPL-related Humor : OFM Humor : Politically Incorrect Humor : IDS Humor : "Linux Sucks" Humor : Russian Musical Humor : Best Russian Programmer Humor : Microsoft plans to buy Catholic Church : Richard Stallman Related Humor : Admin Humor : Perl-related Humor : Linus Torvalds Related humor : PseudoScience Related Humor : Networking Humor : Shell Humor : Financial Humor Bulletin, 2011 : Financial Humor Bulletin, 2012 : Financial Humor Bulletin, 2013 : Java Humor : Software Engineering Humor : Sun Solaris Related Humor : Education Humor : IBM Humor : Assembler-related Humor : VIM Humor : Computer Viruses Humor : Bright tomorrow is rescheduled to a day after tomorrow : Classic Computer Humor
The Last but not Least Technology is dominated by two types of people: those who understand what they do not manage and those who manage what they do not understand ~Archibald Putt. Ph.D
Copyright © 1996-2021 by Softpanorama Society. www.softpanorama.org was initially created as a service to the (now defunct) UN Sustainable Development Networking Programme (SDNP) without any remuneration. This document is an industrial compilation designed and created exclusively for educational use and is distributed under the Softpanorama Content License. Original materials copyright belong to respective owners. Quotes are made for educational purposes only in compliance with the fair use doctrine.
FAIR USE NOTICE This site contains copyrighted material the use of which has not always been specifically authorized by the copyright owner. We are making such material available to advance understanding of computer science, IT technology, economic, scientific, and social issues. We believe this constitutes a 'fair use' of any such copyrighted material as provided by section 107 of the US Copyright Law according to which such material can be distributed without profit exclusively for research and educational purposes.
This is a Spartan WHYFF (We Help You For Free) site written by people for whom English is not a native language. Grammar and spelling errors should be expected. The site contain some broken links as it develops like a living tree...
|
|
You can use PayPal to to buy a cup of coffee for authors of this site |
Disclaimer:
The statements, views and opinions presented on this web page are those of the author (or referenced source) and are not endorsed by, nor do they necessarily reflect, the opinions of the Softpanorama society. We do not warrant the correctness of the information provided or its fitness for any purpose. The site uses AdSense so you need to be aware of Google privacy policy. You you do not want to be tracked by Google please disable Javascript for this site. This site is perfectly usable without Javascript.
Last updated: February 10, 2021